
 Optical coherence tomography characteristics of the optic nerve in Ecuadorian glaucoma patients
ABSTRACT
Objective: To characterize structural optic nerve changes in Ecuadorian glaucoma patients using optical coherence tomography data from 2015 to 2022.
Methods: This retrospective study analyzed anonymized optical coherence tomography data from 301 eyes of 162 patients diagnosed with primary open-angle glaucoma. Data were acquired using the Nidek RS-330 and analyzed with Statistical Package for the Social Sciences, version 21. We assessed peripapillary retinal nerve fiber layer thickness (global, quadrants, and clock-hour sectors) and cup-to-disc ratios.
Results: The mean global retinal nerve fiber layer thickness was 72.97 ± 16.48 μm (range 34 to 116 μm). The most affected retinal nerve fiber layer quadrants, in descending order of deterioration, were superior, inferior, nasal, and temporal. Pathological changes were most prevalent in clock-hour sectors 1, 5, 7, 11, and 12. Pathological horizontal cup-to-disc ratios were found in over 90% of patients.
Conclusion: Ecuadorian glaucoma patients showed significantly reduced retinal nerve fiber layer thickness and high rates of pathological optical coherence tomography parameters, particularly in superior/inferior quadrants and horizontal cup-to-disc ratios, suggesting a distinct neuropathy pattern in this population. This data is crucial for future studies on a distinct glaucomatous neuropathy pattern within the Ecuadorian population.
Keywords:
Glaucoma; Glaucoma, open-angle; Tomography, optical coherence; Optic disk; Ecuador
RESUMO
Objetivo: Caracterizar as alterações estruturais do nervo óptico em pacientes equatorianos com glaucoma, utilizando dados de tomografia de coerência óptica coletados entre 2015 e 2022.
Métodos: Este estudo retrospectivo analisou dados anonimizados de tomografia de coerência óptica de 301 olhos de 162 pacientes diagnosticados com glaucoma primário de ângulo aberto. Os dados foram adquiridos utilizando o Nidek RS-330 e analisados com o Statistical Package for the Social Sciences, versão 21. Avaliamos a espessura da camada de fibras nervosas da retina peripapilar (global, quadrantes e setores de hora do relógio) e os parâmetros do disco óptico (razões escavação-disco).
Resultados: A espessura média global da fibra nervosa da retina peripapilar foi de 72,97 ± 16,48 μm (intervalo 34 a 116 μm). Os quadrantes da fibra nervosa da retina peripapilar mais afetados, em ordem decrescente de deterioração, foram superior, inferior, nasal e temporal. As alterações patológicas foram mais prevalentes nos setores de hora do relógio 1, 5, 7, 11 e 12. Razões escavação-disco horizontais patológicas foram encontradas em mais de 90% dos pacientes.
Conclusão: Pacientes equatorianos com glaucoma apresentaram espessura da fibra nervosa da retina peripapilar significativamente reduzida e altas taxas de parâmetros de tomografia de coerência óptica patológicas, particularmente nos quadrantes superior/inferior e razões escavação-disco horizontais, sugerindo um padrão de neuropatia distinto nessa população. Estes dados são cruciais para futuros estudos sobre um padrão de neuropatia glaucomatosa distinto na população equatoriana.
Descritores:
Glaucoma; Glaucoma de ângulo aberto; Tomografia de coerência óptica; Disco óptico; Equador
INTRODUCTION
Glaucoma is a neuropathy characterized by progressive degeneration of the optic nerve caused by the loss of ganglion cells in the retina. It is the leading cause of irreversible blindness worldwide.(1,2) Early detection and intervention are crucial for preventing progressive vision loss. Currently, assessment of the retinal nerve fiber layer (RNFL) using optical coherence tomography (OCT) plays a central role in glaucoma diagnosis and management. The main alterations are the thinning of the RNFL and the progressive increase in the cupping of the optic disc.(3) While studies have established typical RNFL thicknesses in glaucoma patients internationally, current data specific to South America, and Ecuador in particular, are lacking. Glaucoma diagnosis and monitoring in Ecuador currently relies on OCT device parameters derived from studies conducted primarily on European and North American populations. This raises concerns about the applicability of these norms to the Ecuadorian population due to potential ethnic variations. Therefore, characterizing the primary RNFL changes in this region is crucial for identifying any variations or patterns that could improve glaucoma diagnosis and management.
Currently, only one national study has investigated RNFL thickness in glaucoma patients. Carrión et al. found the average RNFL thickness to be 87.58 µm in the right eye and 87.51 µm in the left eye.(4)
Despite global advances in glaucoma imaging, there remains a significant gap in region-specific data from Latin America, particularly regarding RNFL thickness in glaucomatous eyes. Very few studies have evaluated RNFL thickness in Latin American populations, and the existing ones are primarily focused on healthy individuals. For example, a cross-sectional study conducted in Brazil by Zangalli et al.(5) assessed peripapillary RNFL thickness in healthy participants of different ethnic backgrounds. They reported a mean global RNFL thickness of 99.59 μm (standard deviation [SD] ± 9.57) in individuals of European descent, 103.53 μm (SD ± 11.59) in African descent, and 103.52 μm (SD ± 9.64) in individuals of mixed ancestry. These findings demonstrate considerable interethnic variability and highlight how structural differences may influence baseline OCT measurements. Furthermore, these values differ from those observed in the United States and European cohorts, emphasizing the potential limitations of extrapolating normative data across diverse populations.
Given Ecuador's multiethnic composition and the scarcity of local research on glaucomatous RNFL changes, there is an urgent need to generate population-specific data. This study aims to characterize structural optic nerve changes in Ecuadorian glaucoma patients using optical coherence tomography data from 2015 to 2022. In doing so, it seeks to enhance diagnostic precision and inform more tailored clinical management strategies within this demographic context.
METHODS
This retrospective, quantitative, descriptive, and observational study analyzed anonymized data from patients diagnosed with glaucoma who underwent OCT at the Ophthalmic Center Exilaser in Cuenca, Ecuador, between January 2, 2015, and July 31, 2022. Exilaser is a leading ophthalmological referral center in Cuenca, one of the few in the city equipped with OCT technology. Due to the limited availability of OCT in public Ecuadorian medical facilities and the surrounding region, this center serves a broad population from southern Ecuador.
The study population comprised patients aged 18 years or older who had a pre-existing diagnosis of primary open-angle glaucoma (POAG) meticulously documented in their medical records by the center's ophthalmology specialists. These diagnoses were established based on a comprehensive clinical evaluation, considering the presence of at least two of the following cardinal signs:
-
Elevated intraocular pressure (IOP), defined as IOP readings exceeding 21 mmHg on applanation tonometry.
-
Characteristic glaucomatous optic neuropathy, identified during dilated fundus examination, indicated by one or more of the following features:
-
Vertical cup-to-disc ratio greater than 0.3.
-
Asymmetry in cup-to-disc ratio (CDR) of more than 0.2 between the two eyes.
-
Nasalization of blood vessels.
-
Deep cupping of the optic disc.
-
Localized or diffuse thinning of the neuroretinal rim.
-
Presence of RNFL defects with a glaucomatous pattern (e.g., arcuate, wedge, or diffuse loss).
-
-
Corresponding visual field defects: detected by perimetry study, demonstrating characteristic glaucomatous patterns such as arcuate scotomas, nasal steps, paracentral scotomas, or generalized constriction.
A gonioscopic study was routinely performed to classify the iridocorneal angle and definitively rule out angle-closure mechanisms, ensuring an accurate diagnosis of POAG. Records were excluded if they presented: insufficient data; an average nerve fiber count of fewer than 10 in any quadrant (indicating recording error); a signal strength ≤ 5; retinal diseases other than glaucoma; ametropia ≥ 4 D; or if the patient was not from South America.
The following variables were analyzed:
-
Sociodemographic: age, sex, and place of origin.
-
Comorbidities: presence of any of the following chronic non-ocular diseases associated with increased glaucoma frequency: hypertension, diabetes mellitus, migraine, hypercholesterolemia, hypotension, and Raynaud's syndrome. These comorbidities were investigated to provide a comprehensive characterization of the study population and to acknowledge the established systemic associations of these conditions with glaucoma prevalence and progression, although a detailed analysis of their impact was beyond the scope of this descriptive study.
-
IOP: measured IOP values.
-
OCT parameters: signal strength, peripapillary RNFL parameters (global RNFL thickness, quadrant thicknesses, and clock-hour sector thicknesses), and optic disc parameters (horizontal and vertical cup-to-disc ratios).
Statistical analysis
Descriptive statistics were used. Categorical variables are presented as absolute frequencies and percentages. Continuous variables are presented as means, SD, and ranges. Data were analyzed using IBM Statistical Package for the Social Sciences, version 21.
The variables were treated as follows:
-
Age: age was analyzed as a continuous variable (mean, SD, range) and categorized into nominal groups: young adult (≤ 35 years), adult (36-64 years), and older adult (≥ 65 years).
-
Comorbidities: the presence of any of the specified comorbidities was coded as a dichotomous variable (yes/no).
-
Origin: based on institutional data regarding patient influx, the most frequent provinces of origin were identified. Patients from other Latin American countries were grouped as "Latin American", and those from less frequent Ecuadorian provinces were grouped as "Other Ecuadorian Provinces". Frequencies were calculated for this nominal variable.
-
IOP: was analyzed as a continuous variable (mean, SD, range) and categorized into nominal groups: low teens (≤ 12 mmHg), mid-teens (13 to 15 mmHg), high-teens (16 to 18 mmHg), 19 to 21 mHg and > 21 mmHg.
-
RNFL parameters: RNFL thickness (global, quadrants, and clock-hour sectors) was analyzed as a continuous variable (mean, SD, range) and categorized as normal or pathological based on the software's normative database.
-
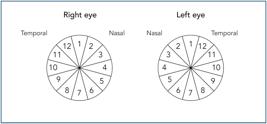
RNFL clock-hour sector definition: peripapillary RNFL thickness was analyzed in 12 clock-hour sectors, as automatically segmented by the Nidek RS 330 Retina Scan Duo software. Orientation was standardized across eyes, where sector 12 corresponds to the same anatomical region in both eyes (i.e. superotemporal). Their anatomical mapping is represented in figure 1, which illustrates the 12 clock-hour sectors for the right and left eyes. Note that a consistent topographic orientation was used, where sector 12 uniformly represents the superior-temporal region in both eyes.
-
Cup-to-disc ratio: horizontal and vertical cup-to-disc ratios were analyzed as continuous variables (mean, SD, range) and categorized as normal (< 0.3), suspicious (0.3 to 0.6), or pathological (> 0.6).
Ethical considerations
This study was approved by the Human Research Ethics Committee of the University of Cuenca (code: CEISH-UC-2023-013EO-M). The study adhered to the principles outlined in the Declaration of Helsinki, the Belmont Report, the Council for International Organizations of Medical Sciences (CIOMS) guidelines, and Ecuadorian health legislation. An anonymized database, lacking personally identifiable information (names, ID numbers, telephone numbers, addresses, and attending physician information), was obtained from Exilaser Ophthalmological Center. The study protocol, including all amendments and findings, was reviewed by the University of Cuenca's Ethics Committee. Data confidentiality was ensured through anonymization. The authors declare no conflicts of interest with Exilaser Ophthalmic Center or Nidek. The data were used exclusively for this research.
RESULTS
A total of 446 eyes were initially identified. After applying the exclusion criteria (figure 2), 301 eyes from 162 patients with POAG were included in the analysis.

Patient demographics and clinical characteristics
The study population (Table 1) consisted primarily of older adults, with a mean age of 64 ± 14.76 years (range 25 to 93). The majority of participants were female and originated from the province of Azuay. Comorbidities associated with glaucoma were infrequent. The mean IOP was 17.43 ± 6.72 mmHg.
Retinal nerve fiber layer and cup-to-disc ratio analysis
As shown in Table 2, the mean global RNFL thickness was 72.97 µm (SD: 16.48 µm), with 77.07% (232 eyes) classified as pathological. This indicates that over 75% of the glaucoma population exhibited a marked reduction in global peripapillary RNFL thickness.
Retinal nerve fiber layer thickness and cup-to-disc ratio measurements in 301 eyes with glaucoma
Regarding the RNFL quadrants, the superior and inferior quadrants revealed the highest mean RNFL thicknesses, at 88.12 µm and 89.57 µm, respectively. Pathological findings were also most prevalent in these quadrants, with 70.09% of superior and 62.12% of inferior quadrants being classified as abnormal. The nasal and temporal quadrants showed lower mean RNFL thicknesses, with 54.32 µm and 60.57 µm, respectively, and lower percentages of pathological cases. Thus, in descending order of deterioration, the following pattern emerged: superior, inferior, nasal, and temporal.
Analysis of the 12 clock-hour sectors revealed a wide range of mean RNFL thicknesses. Sector 6 (CS 6) showed the highest mean thickness (101.58 µm), while sector 9 showed the lowest (49.77 µm). The percentage of pathological cases varied across sectors, with the highest in CS 1 (57.47%) and the lowest in CS 9 (16.94%).
The mean horizontal and vertical cup-to-disc ratios demonstrated a high percentage of pathological ratios (over 90% for the horizontal measurements). The mean horizontal cup-to-disc ratio (0.79 ± 0.14) was slightly elevated compared to the mean vertical cup-to-disc ratio (0.75 ± 0.13), suggesting a potential pattern of glaucomatous damage.
Relationship between retinal nerve fiber layer thickness and clinical variables
Associations between RNFL thickness and sociodemographic and clinical variables are presented in table 3. Lower global RNFL thickness was observed in male patients; patients with comorbidities associated with glaucoma (hypertension, diabetes mellitus, migraine, hypercholesterolemia, hypotension, and/or Raynaud's syndrome); older patients; patients with elevated IOP; patients originating from provinces other than Azuay and Loja (patients from Azuay and Loja presented greater RNFL thickness).
Mean Global retinal nerve fiber layer thickness across sociodemographic and clinical variables
DISCUSSION
This retrospective study examined peripapillary RNFL and optic disc changes in glaucoma patients, aiming to identify the most vulnerable areas and establish local reference ranges for glaucoma-related OCT parameters using the Nidek 330, thus informing future research. Our key findings include: a mean global peripapillary RNFL thickness of 72.97 µm ± 16.48 (range 34-116), with the superior, inferior, nasal, and temporal sectors affected in descending order; and clock-hour sectors 1, 5, 7, 11, and 12 as the most frequently altered. These results are significant as they highlight potential initial areas of glaucomatous damage in Ecuadorian patients, even prior to symptom onset.
The study population had a mean age of 64 ± 14.76 years, was predominantly female, and presented with a mean IOP of 17.43 ± 6.72 mmHg. These demographics align with previous research. Daneshvar et al. reported a mean age of 68 years and a female majority (53:42) in their glaucoma progression study.(6) Similarly, Trenkić-Božinović et al.(7) and Wong et al.(8) reported mean ages of 65.49 ± 9.36 and 65.6 ± 12.2 years, respectively, in their studies of POAG. Wong et al. also reported a mean IOP of 14.38 ± 2.75 mmHg. The similarity in age and the controlled IOP in our study likely reflects the use of ocular antihypertensive medications. The higher proportion of women in our study is consistent with other research indicating a greater female prevalence of glaucoma.(6,8,9) Our finding of the highest prevalence in the ≥ 65 age group (50.83%) echoes Kreft et al.(9) German study, which identified the 70 to 74 age range (21.1%) as most affected, further supporting the link between advanced age and glaucoma.
Forty percent of our open-angle glaucoma patients presented with comorbidities. This aligns with Torabi et al.(10) findings on glaucoma risk factors, in which 31% of hypertensive patients and 4.4% of diabetic patients also had glaucoma. Kreft et al.(9) identified hypertension (28.83%), diabetes mellitus (23.69%), and other conditions as risk factors for glaucoma. Similarly, Sun et al.(11) found significant associations between glaucoma and hypertension (OR 1.36), diabetes (OR 2.5), and dyslipidemia (OR 1.75).
The mean global RNFL thickness in our study (72.97 µm) was derived from 301 eyes using spectral-domain OCT (Nidek 330) with strict image quality criteria and refractive error limits. A previous local study reported a mean global RNFL thickness of 87.54 µm in suspected glaucoma patients in 2016.(4) No other similar studies from Cuenca, Ecuador, were found.
It is well-established that OCT studies worldwide consistently demonstrate a reduced RNFL thickness in individuals with glaucoma compared to those without the disease.(12,13) Research has further indicated that the earliest and most sensitive indicators of glaucomatous damage are typically observed in the global average, inferior, and temporal sectors of the RNFL.(14) A systematic review supports the high diagnostic accuracy of OCT, reporting ≥90% sensitivity and specificity in identifying glaucoma.(15)
While international studies have evaluated global RNFL thickness (Table 4), our mean RNFL thickness differs notably from some reported values. Indeed, studies worldwide have explored normal RNFL thickness, revealing variations potentially linked to ethnicity, location, and measurement methods. For instance, Jammal et al. found a mean RNFL thickness of 82.4 ± 17.0 µm in a US population, suggesting potentially thicker RNFLs compared to other groups.(16) This difference could be due to genetics, environment, or how the measurements were taken. Conversely, studies in China (Hou et al.)(17) and Germany (Heindl et al.)(13) reported lower average RNFL thicknesses, 70.5 ± 11.8 µm and 70.03 ± 18.2 µm respectively, possibly attributable to anatomical differences between ethnic groups or variations in imaging techniques. These findings underscore the critical need for population-specific RNFL data for accurate diagnoses, which our study aims to address for the Ecuadorian context. These variations could also be attributed to differences in technology, equipment, and population characteristics. RNFL thickness is recognized as a highly sensitive parameter, with Arnould et al.(18) reporting 80.9% sensitivity and 87.14% specificity.
Worldwide studies of global retinal nerve fiber layer thickness in glaucoma using optical coherence tomography
Regarding RNFL quadrants and clock-hour sectors, our findings partially align with previous research. Kim et al.(19), using Cirrus OCT, found the thinnest nasal and temporal quadrants in glaucoma, similar to our results. However, we found the inferior and superior sectors to be most frequently classified as pathological, despite having higher average thicknesses. This highlights the importance of considering both thickness and regional vulnerability in glaucoma, as different areas may have varying susceptibility to damage.(23) Our study confirmed the ISNT rule (inferior, superior, nasal, temporal) in healthy eyes(18), but observed a deviation in the nasal and temporal sectors in our glaucoma patients, likely due to glaucomatous damage.
Our clock-hour sector analysis revealed sectors 1, 5, 7, 11, and 12 as most frequently pathological, while sectors 3, 4, 8, and 9 showed the lowest thicknesses. This partially aligns with Kim et al.,(19) who also identified these sectors as thinned, although the specific sectors varied slightly. Trenkić-Božinović et al.(7) also reported reduced thickness in similar clock-hour sectors. These variations likely reflect methodological differences and disease severity. Our findings are consistent with Hood (24) description of vulnerable areas in the optic disc, corresponding to similar clock-hour sectors.
Our optic disc findings included horizontal cup-to-disc ratio of 0.79 ± 0.14, and vertical cup/disc ratio of 0.75 ± 0.13. These are similar to those reported by Wong et al.(8) and Anton et al.,(25) who found increased cup-to-disc ratios in glaucoma. These findings emphasize the importance of optic disc parameters in glaucoma assessment.(26)
Limitations
This study, while being the first to describe optic nerve alterations using spectral-domain OCT in Cuenca, has several limitations that warrant consideration. The predominantly advanced stage of glaucoma in our patients may reflect delayed presentation in this population, limiting insights into early disease stages. Furthermore, IOP measurements likely reflect treated rather than true baseline pressures. A significant limitation is the inherent difficulty in directly comparing RNFL thickness measurements across different OCT platforms, as variations exist in acquisition modules, segmentation algorithms, instrument errors, and software. Consequently, our findings are specific to the Nidek 330 used in this study. Additionally, the absence of a healthy control group from the Ecuadorian population within this study limits direct comparison of our findings to a non-diseased local cohort and underscores the need for future normative data studies in this population. Finally, the small and selective sample size may not be fully representative of the broader Cuenca population.
CONCLUSION
This study characterized optic nerve parameters with optical coherence tomography in glaucoma patients from Cuenca, Ecuador, revealing a mean global retinal nerve fiber layer thickness of 72.97 µm, with over 75% classified as pathological. Clock-hour sectors 1, 5, 7, 11, and 12 were most frequently affected. The horizontal cup-to-disc ratio represented a higher percentage of damage. These findings provide valuable insights into glaucoma characteristics in this Ecuadorian - Latin American population.
-
Financial support:
no financial support for this work.
-
Institution:
Ophthalmic Center, Exilaser, Cuenca, Azuay, Ecuador.
-
Academic Work Associated:
This article is derived from the monograph Structural Alterations of Optic Nerve Determined by OCT at the Exilaser Ophthalmic Clinic (2015-2022), which served as the graduation project for Paula Gabriela Abad Polo and Diego Andrés Córdova Reyes who received their medical degrees from the University of Cuenca in 2023.
Data Availability Statement:
The datasets generated and/or analysed during the current study are included in the manuscript.
REFERENCES
- 1 García López A, Gil Carrasco F. Glaucoma. In: Rojas Juárez S, Saucedo Castillo A, editors. Oftalmología. 2nd ed. Mexico City: Editorial El Manual Moderno; 2020. p. 436.
- 2 Kang JM, Tanna AP. Glaucoma. Med Clin North Am. 2021;105(3):493-510.
- 3 Schuster AK, Erb C, Hoffmann EM, Dietlein T, Pfeiffer N. The diagnosis and treatment of glaucoma. Dtsch Arzteblatt Int. 2020;117(13):225-34.
-
4 Carrión Crespo JC, Vallejo Rau AM. Resultados de la tomografía de coherencia óptica en pacientes con sospecha clínica de glaucoma. Hospital Santa Inés, Cuenca 2014-2015. 2016. Available from: https://dspace.ucuenca.edu.ec/items/974df3f2-4063-4bac-b4a6-5d6f005fd7f7
» https://dspace.ucuenca.edu.ec/items/974df3f2-4063-4bac-b4a6-5d6f005fd7f7 - 5 Zangalli CS, Vianna JR, Reis ASC, Miguel-Neto J, Burgoyne CF, Chauhan BC, et al. Bruch's membrane opening minimum rim width and retinal nerve fiber layer thickness in a Brazilian population of healthy subjects. PLoS ONE. 2018;13(12):e0206887.
- 6 Daneshvar R, Yarmohammadi A, Alizadeh R, Henry S, Law SK, Caprioli J, et al. Prediction of Glaucoma Progression with Structural Parameters: Comparison of optical coherence tomography and clinical disc parameters. Am J Ophthalmol. 2019;208:19-29.
- 7 Trenkić-Božinović M, Zlatanović G, Jovanović P, Veselinović D, Đorđević-Jocić J, Radenković M, et al. Optical coherence tomography in the evaluation of structural changes in primary open-angle glaucoma with and without elevated intraocular pressure. Vojnosanit Pregl. 2016;73(7):618-25.
- 8 Wong D, Chua J, Lin E, Tan B, Yao X, Chong R, et al. Focal structure-function relationships in primary open-angle glaucoma using OCT and OCT-A measurements. Invest Ophthalmol Vis Sci. 2020;61(14):33.
- 9 Kreft D, Doblhammer G, Guthoff RF, Frech S. Prevalence, incidence, and risk factors of primary open-angle glaucoma - a cohort study based on longitudinal data from a German public health insurance. BMC Public Health. 2019;19:851.
- 10 Torabi R, Harris A, Siesky B, Zukerman R, Oddone F, Mathew S, et al. Prevalence rates and risk factors for primary open angle glaucoma in the middle east. J Ophthalmic Vis Res. 2021;16(4):644-56.
- 11 Sun J, Li T, Zhao X, Lu B, Chen J, Liu W, et al. Prevalence and risk factors of glaucoma among chinese people from the china health and retirement longitudinal study. J Glaucoma. 2022;31(10):789-95.
- 12 Park KH, Kim TW, editors. OCT Imaging in Glaucoma: A guide for practitioners. Singapore: Springer; 2021.
- 13 Heindl LM, Adler W, El-Malahi O, Schaub F, Hermann MM, Dietlein TS, et al. The Optimal Diameter for Circumpapillary Retinal Nerve Fiber Layer Thickness Measurement by SD-OCT in Glaucoma. J Glaucoma. 2018;27(12):1086-93.
- 14 Bradley C, Hou K, Herbert P, Unberath M, Boland MV, Ramulu P, et al. Evidence-based guidelines for the number of peripapillary OCT scans needed to detect glaucoma Worsening. Ophthalmology. 2023;130(1):39-47.
- 15 Cavanela CR, López-Alegría F. Retinografía y la tomografía de coherencia óptica para el diagnóstico del glaucoma mediante la evaluación de la sensibilidad y especificidad: revisión sistemática. Rev Mex Oftalmol. 2024;97(3S):82-9.
- 16 Jammal AA, Berchuck SI, Thompson AC, Costa VP, Medeiros FA. The effect of age on increasing susceptibility to retinal nerve fiber layer loss in glaucoma. Invest Ophthalmol Vis Sci. 2020;61(13):8.
- 17 Hou HW, Lin C, Leung CKS. Integrating macular ganglion cell inner plexiform layer and parapapillary retinal nerve fiber layer measurements to detect glaucoma progression. Ophthalmology. 2018;125(6):822-31.
- 18 Arnould L, De Lazzer A, Seydou A, Binquet C, Bron AM, Creuzot-Garcher C. Diagnostic ability of spectral-domain optical coherence tomography peripapillary retinal nerve fiber layer thickness to discriminate glaucoma patients from controls in an elderly population (The MONTRACHET study). Acta Ophthalmol (Copenh). 2020;98(8):e1009-16.
- 19 Kim HJ, Jeoung JW, Yoo BW, Kim HC, Park KH. Patterns of glaucoma progression in retinal nerve fiber and macular ganglion cell-inner plexiform layer in spectral-domain optical coherence tomography. Jpn J Ophthalmol. 2017;61(4):324-33.
- 20 Colombo L, Bertuzzi F, Rulli E, Miglior S. Correlations between the individual risk for glaucoma and rnfl and optic disc morphometrical evaluations in ocular hypertensive patients. J Glaucoma. 2016;25(5):e455-462.
- 21 Maupin E, Baudin F, Arnould L, Seydou A, Binquet C, Bron AM, et al. Accuracy of the ISNT rule and its variants for differentiating glaucomatous from normal eyes in a population-based study. Br J Ophthalmol. 2020;104(10):1412-7.
- 22 Safwat H, Nassar E, Rashwan A. Early Glaucoma Discrimination Index. J Curr Glaucoma Pract. 2020;14(1):16-24.
- 23 Zheng YJ, Pan YZ, Li XY, Fang Y, Li M, Qiao RH, et al. A new diagnostic model of primary open angle glaucoma based on FD-OCT parameters. Int J Ophthalmol. 2018;11(6):951-7.
- 24 Hood DC. Improving our understanding, and detection, of glaucomatous damage: An approach based upon optical coherence tomography (OCT). Prog Retin Eye Res. 2017;57:46-75.
- 25 Anton A, Moreno-Montañes J, Blázquez F, Alvarez A, Martín B, Molina B. Usefulness of optical coherence tomography parameters of the optic disc and the retinal nerve fiber layer to differentiate glaucomatous, ocular hypertensive, and normal eyes. J Glaucoma. 2007;16(1):1-8.
- 26 Liu MM, Cho C, Jefferys JL, Quigley HA, Scott AW. Use of optical coherence tomography by non-expert personnel as a screening approach for glaucoma. J Glaucoma. 2018;27(1):64-70.
Edited by
-
Associate editor:
Alberto Diniz Filho Universidade Federal de Minas Gerais, Belo Horizonte, MG, Brazil. https://orcid.org/0000-0002-0371-2359


