Tumbling-hand optotype: a novel gesture-based tool for visual acuity assessment in neurodivergent populations
ABSTRACT
Objective: This study aimed to validate the psychometric properties, feasibility, and clinical utility of the Tumbling-Hand test.
Methods: The validation process involved two phases. In neurotypical participants, VA thresholds of the Tumbling-Hand test were compared with the printed Tumbling E test, with repeatability assessed using intraclass correlation coefficients (ICCs) and Bland-Altman analysis. In neurodivergent participants, the feasibility and success rates of the Tumbling-Hand test were evaluated against the Tumbling E and Landolt C tests. Statistical analyses, including McNamar's and chi-square tests, were performed to assess performance differences across age, gender, and disability type.
Results: In neurotypical participants (n = 75), the Tumbling-Hand test demonstrated excellent reproducibility, with ICCs exceeding 0.90 and agreement comparable to the Tumbling E test. Among neurodivergent participants (n = 80), the Tumbling Hand test achieved the highest success rates, particularly as a secondary test (72.73%, p = 0.001). Success rates were significantly higher in individuals aged ≥10 years (p < 0.01), with no significant differences by gender. The Tumbling Hand test demonstrated the highest combined success rate in Autism Spectrum Disorder (72.22%).
Conclusion: The Tumbling-Hand test is a reliable, reproducible, and inclusive tool for VA assessment. Its adaptability makes it particularly valuable for neurodivergent populations, warranting further validation in broader clinical contexts.
Keywords:
Visual acuity; Optotypes; Psychometric tests; Neurodiversity; Persons with disabilities
RESUMO
Objetivo: Validar as propriedades psicométricas, a viabilidade e a utilidade clínica do teste Tumbling-Hand.
Métodos: Foram comparados os limiares de acuidade visual e a reprodutibilidade do Tumbling-Hand com testes gestuais padrão em indivíduos neurotípicos e avaliadas sua viabilidade e desempenho em populações neurodivergentes. O processo de validação foi realizado em duas fases. Em participantes neurotípicos, os limiares de acuidade visual do teste Tumbling-Hand foram comparados ao teste Tumbling E impresso, com a reprodutibilidade avaliada por coeficientes de correlação intraclasse e análise de Bland-Altman. Em participantes neurodivergentes, foram avaliadas a viabilidade e as taxas de sucesso do Tumbling-Hand em comparação aos testes Tumbling E e Landolt C. Foram realizadas análises estatísticas, incluindo os testes de McNemar e qui-quadrado, para avaliar diferenças de desempenho em relação à idade, ao gênero e ao tipo de deficiência.
Resultados: Em participantes neurotípicos (n = 75), o teste Tumbling-Hand demonstrou excelente reprodutibilidade, com coeficientes de correlação intraclasse superiores a 0,90 e concordância comparável ao teste Tumbling E. Entre os participantes neurodivergentes (n = 80), o Tumbling-Hand alcançou as maiores taxas de sucesso, especialmente como teste secundário (72,73%; p = 0,001). As taxas de sucesso foram significativamente maiores em indivíduos com idade ≥10 anos (p < 0,01), sem diferenças significativas entre os gêneros. O teste Tumbling-Hand apresentou a maior taxa combinada de sucesso em indivíduos com Transtorno do Espectro Autista (72,22%).
Conclusão: O teste Tumbling Hand é uma ferramenta confiável, reprodutível e inclusiva para avaliação de acuidade visual. Sua adaptabilidade o torna particularmente valioso para populações neurodivergentes, justificando validações adicionais em contextos clínicos mais amplos.
Descritores:
Acuidade visual; Optótipos; Testes psicométricos; Neurodiversidade; Pessoas com deficiência
INTRODUCTION
Oriented optotypes, like Tumbling-E and Landolt C figures, prove valuable not only for preschoolers(1–4) but also for adults facing cognitive and neurological challenges such as cerebral palsy, muscular dystrophy, and traumatic brain injury.(5)
Tests utilizing hand-shaped pictograms have been previously proposed and validated for use with children;(6,7) however, these lack rigorous evaluation in terms of psychophysical methodology, analytical robustness, and image signal processing. Therefore, we decided to develop and validate the Tumbling Hand test, a novel nonverbal tool integrated into a digital platform. Featuring hand-shaped optotypes that replicate the directional orientations of the Tumbling E, the test was designed for intuitive use with minimal pre-test instruction. The study included detailed analyses involving computational modeling, psychophysical testing, and Fourier transformations.
This validation study aimed to evaluate the visual acuity (VA) threshold performance of the Tumbling Hand test compared to standardized optotypes on a digital chart, as well as its feasibility and effectiveness among neurodivergent individuals in comparison to other gesture-based tests.
METHODS
After developing the Tumbling-hand pictograms and conducting a pilot test, validation testing was performed. The procedures were first validated in neurotypical verbal individuals by comparing VA thresholds of the digital Tumbling-hand test with standard gesture-based tests. Additionally, the test's performance was evaluated among neurodivergent individuals in comparison to other gesture-based tests.
Development of optotypes
Tumbling-hand optotypes were generated with thinner strokes than Tumbling-E (stroke-to-bounding box ratio of 1:10 rather than 1:5) to allow us to generate identifiable figures. The hand-shaped optotypes were designed to minimize asymmetries, ensuring that identification is not biased by visual or cognitive distinctiveness. This enhances the reliability of VA assessments across all orientations. The development process occurs in four phases:
-
A set of 30 pictograms with unique features was developed for their distinctive appearance.
-
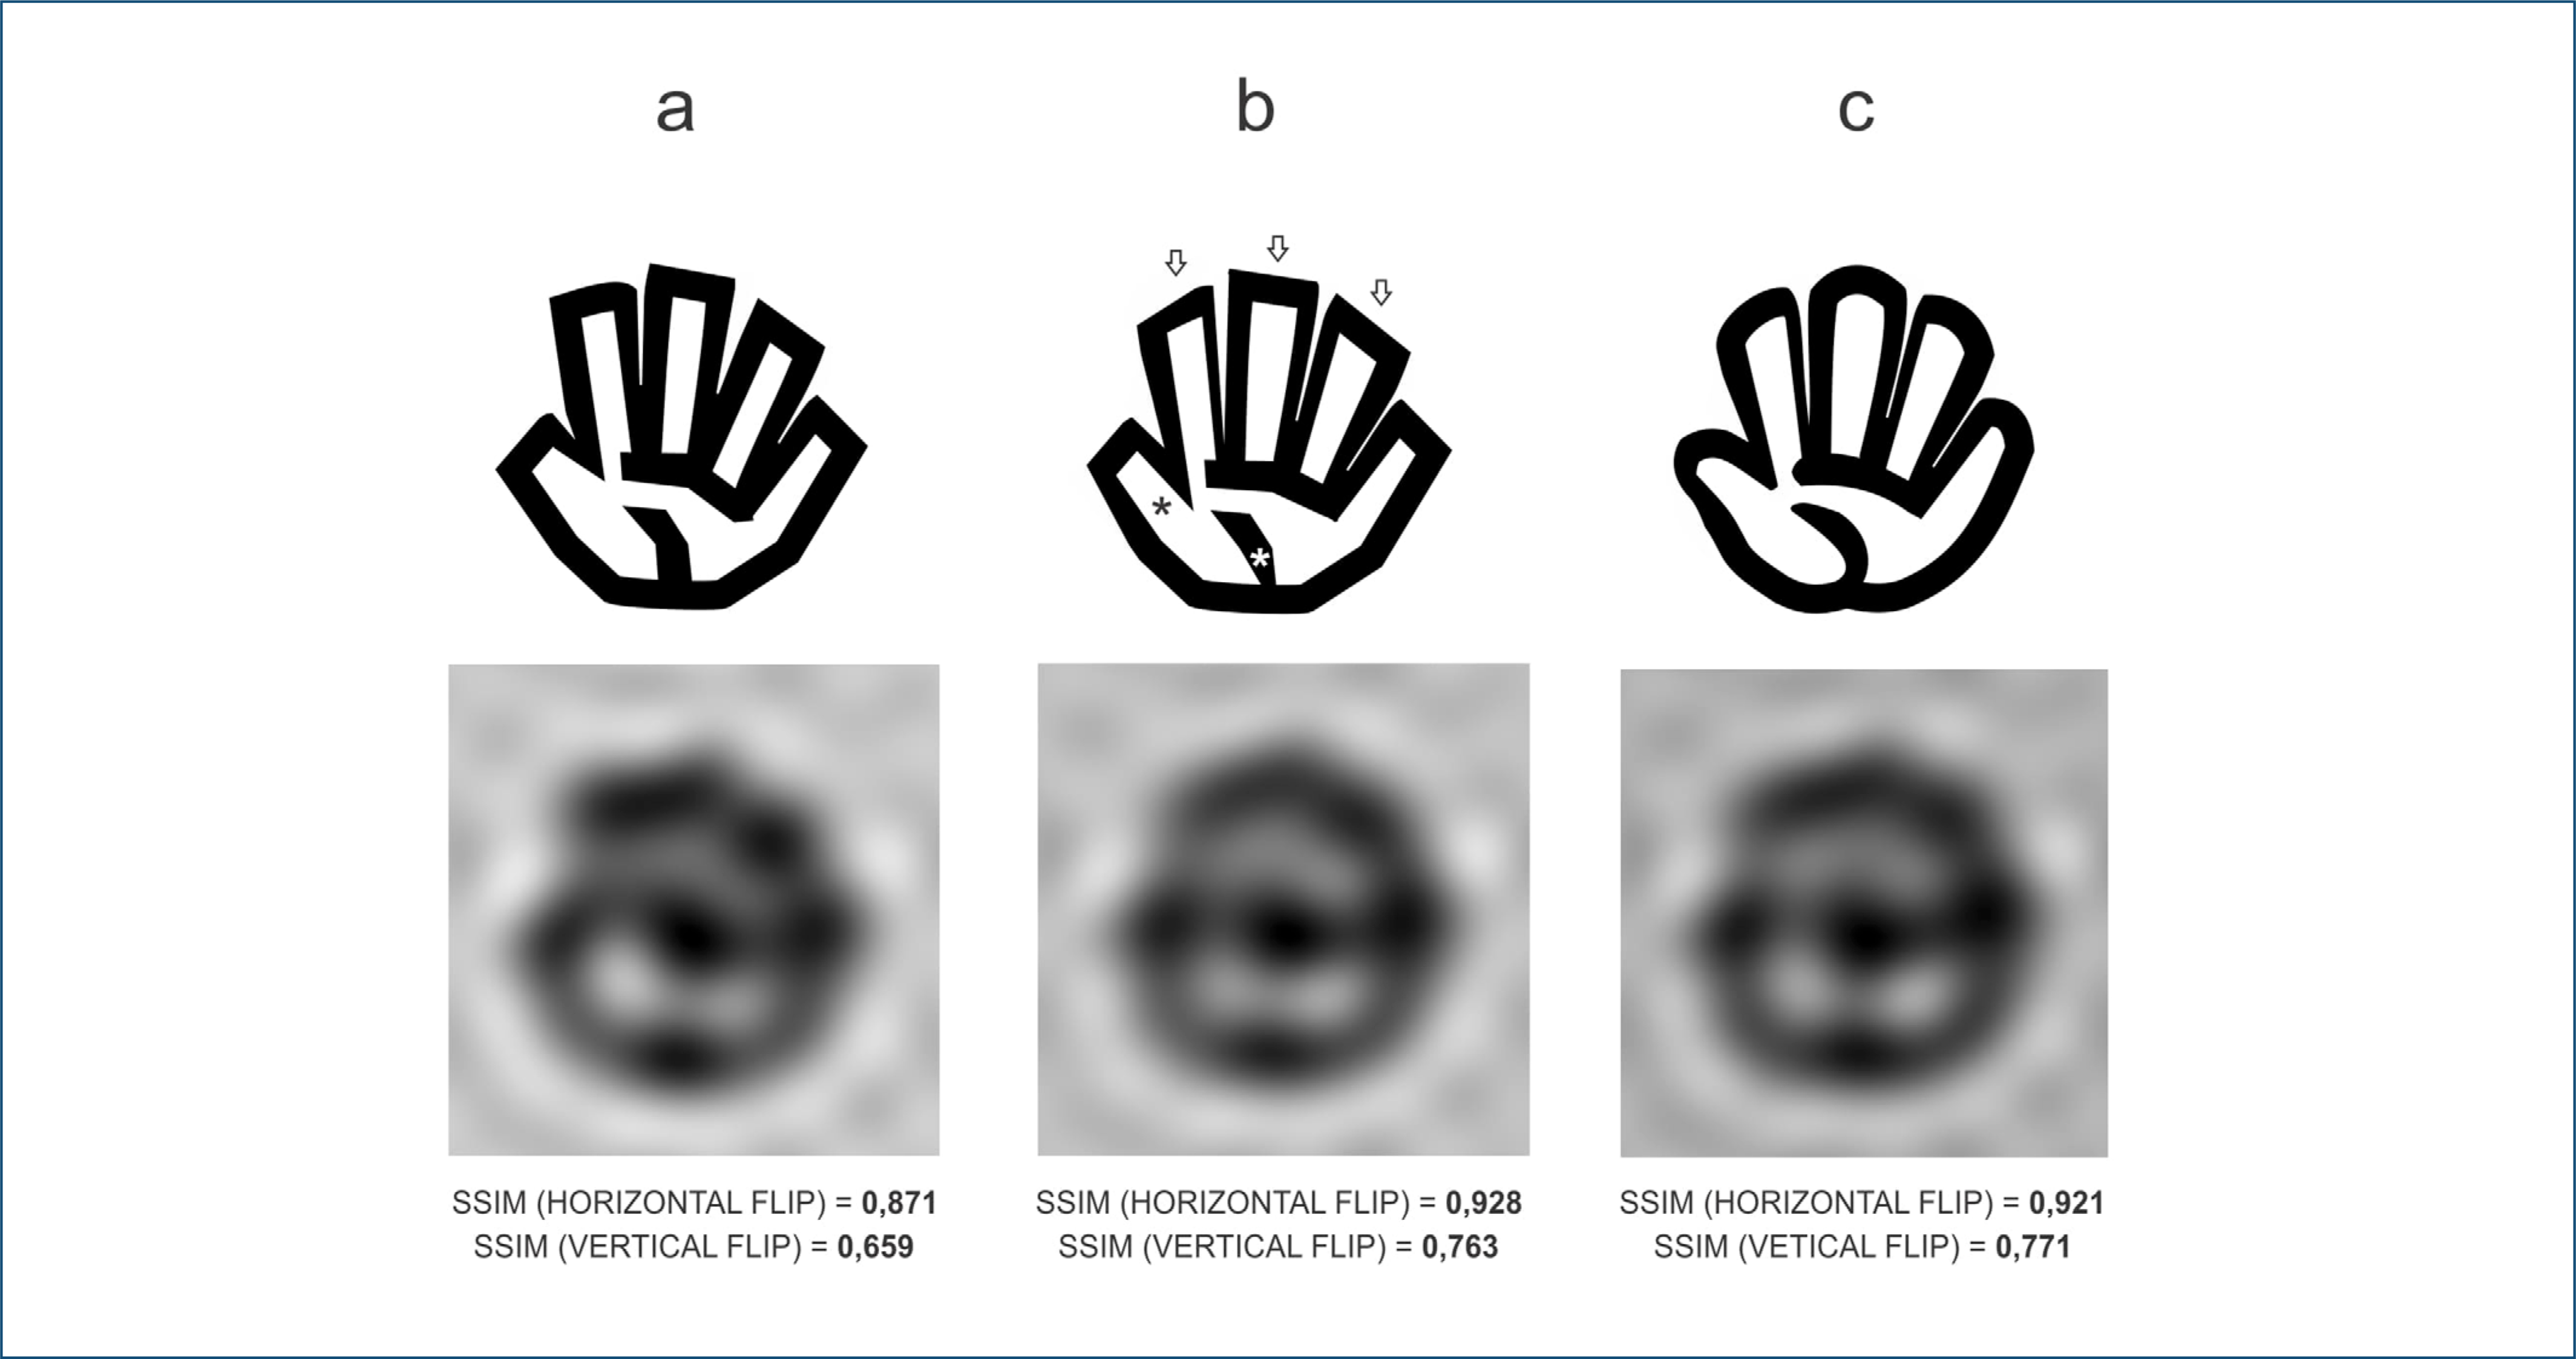
In the second phase, pictogram similarity was measured through rotation and comparison using the Structural Similarity Index (SSIM) measure using MATLAB (version R2023b, MathWorks, Natick, MA, USA). Simulated blur was applied, and the discrimination threshold was determined based on achieving a 90% similarity level (Figure 1A and B). This process identified five potentially optimized candidates.
-
Fine adjustments in the third step used the Fourier Transform Lab System v.1.0.1.0 (JcrystalSoft, 2023) to evaluate optotype symmetry. Simulated blur and low-pass filters were applied, refining curvature for optimal horizontal and vertical symmetry. To illustrate, an apex/base ratio exceeding 1.14 for the second to fourth finger widths (Figure 2) improved SSIM values, guiding the final optotype design (Figure 2C).
-
The fourth phase involved a psychometric pilot study with three healthy adults to estimate sensory threshold values for deciphering the optotypes. Psychometric functions were obtained using MATLAB (version R2023b, MathWorks, Natick, MA, USA) and elements of Psignifit.(8)
Graph (A) compares Structural Similarity Index values of blur across different pictograms, highlighting that higher-SSIM optotypes require less blur to achieve 90% similarity. Three optotypes are identified for their low blur thresholds leading to potential confusion. Diagram (B) illustrates Structural Similarity Index values at specific blur thresholds, comparing 180° and 90° rotations, with a critical similarity threshold set at Structural Similarity Index > 0.9.

The method for achieving the optimal structure of the hand optotype involved making changes in regions marked by black and white asterisks and arrows, as shown in columns A and B. These changes resulted in symmetry improvement in both the resolution threshold image and Structural Similarity Index values. Column C displays the final optotype, its blurred image, and corresponding Structural Similarity Index values.
Statistical signal processing
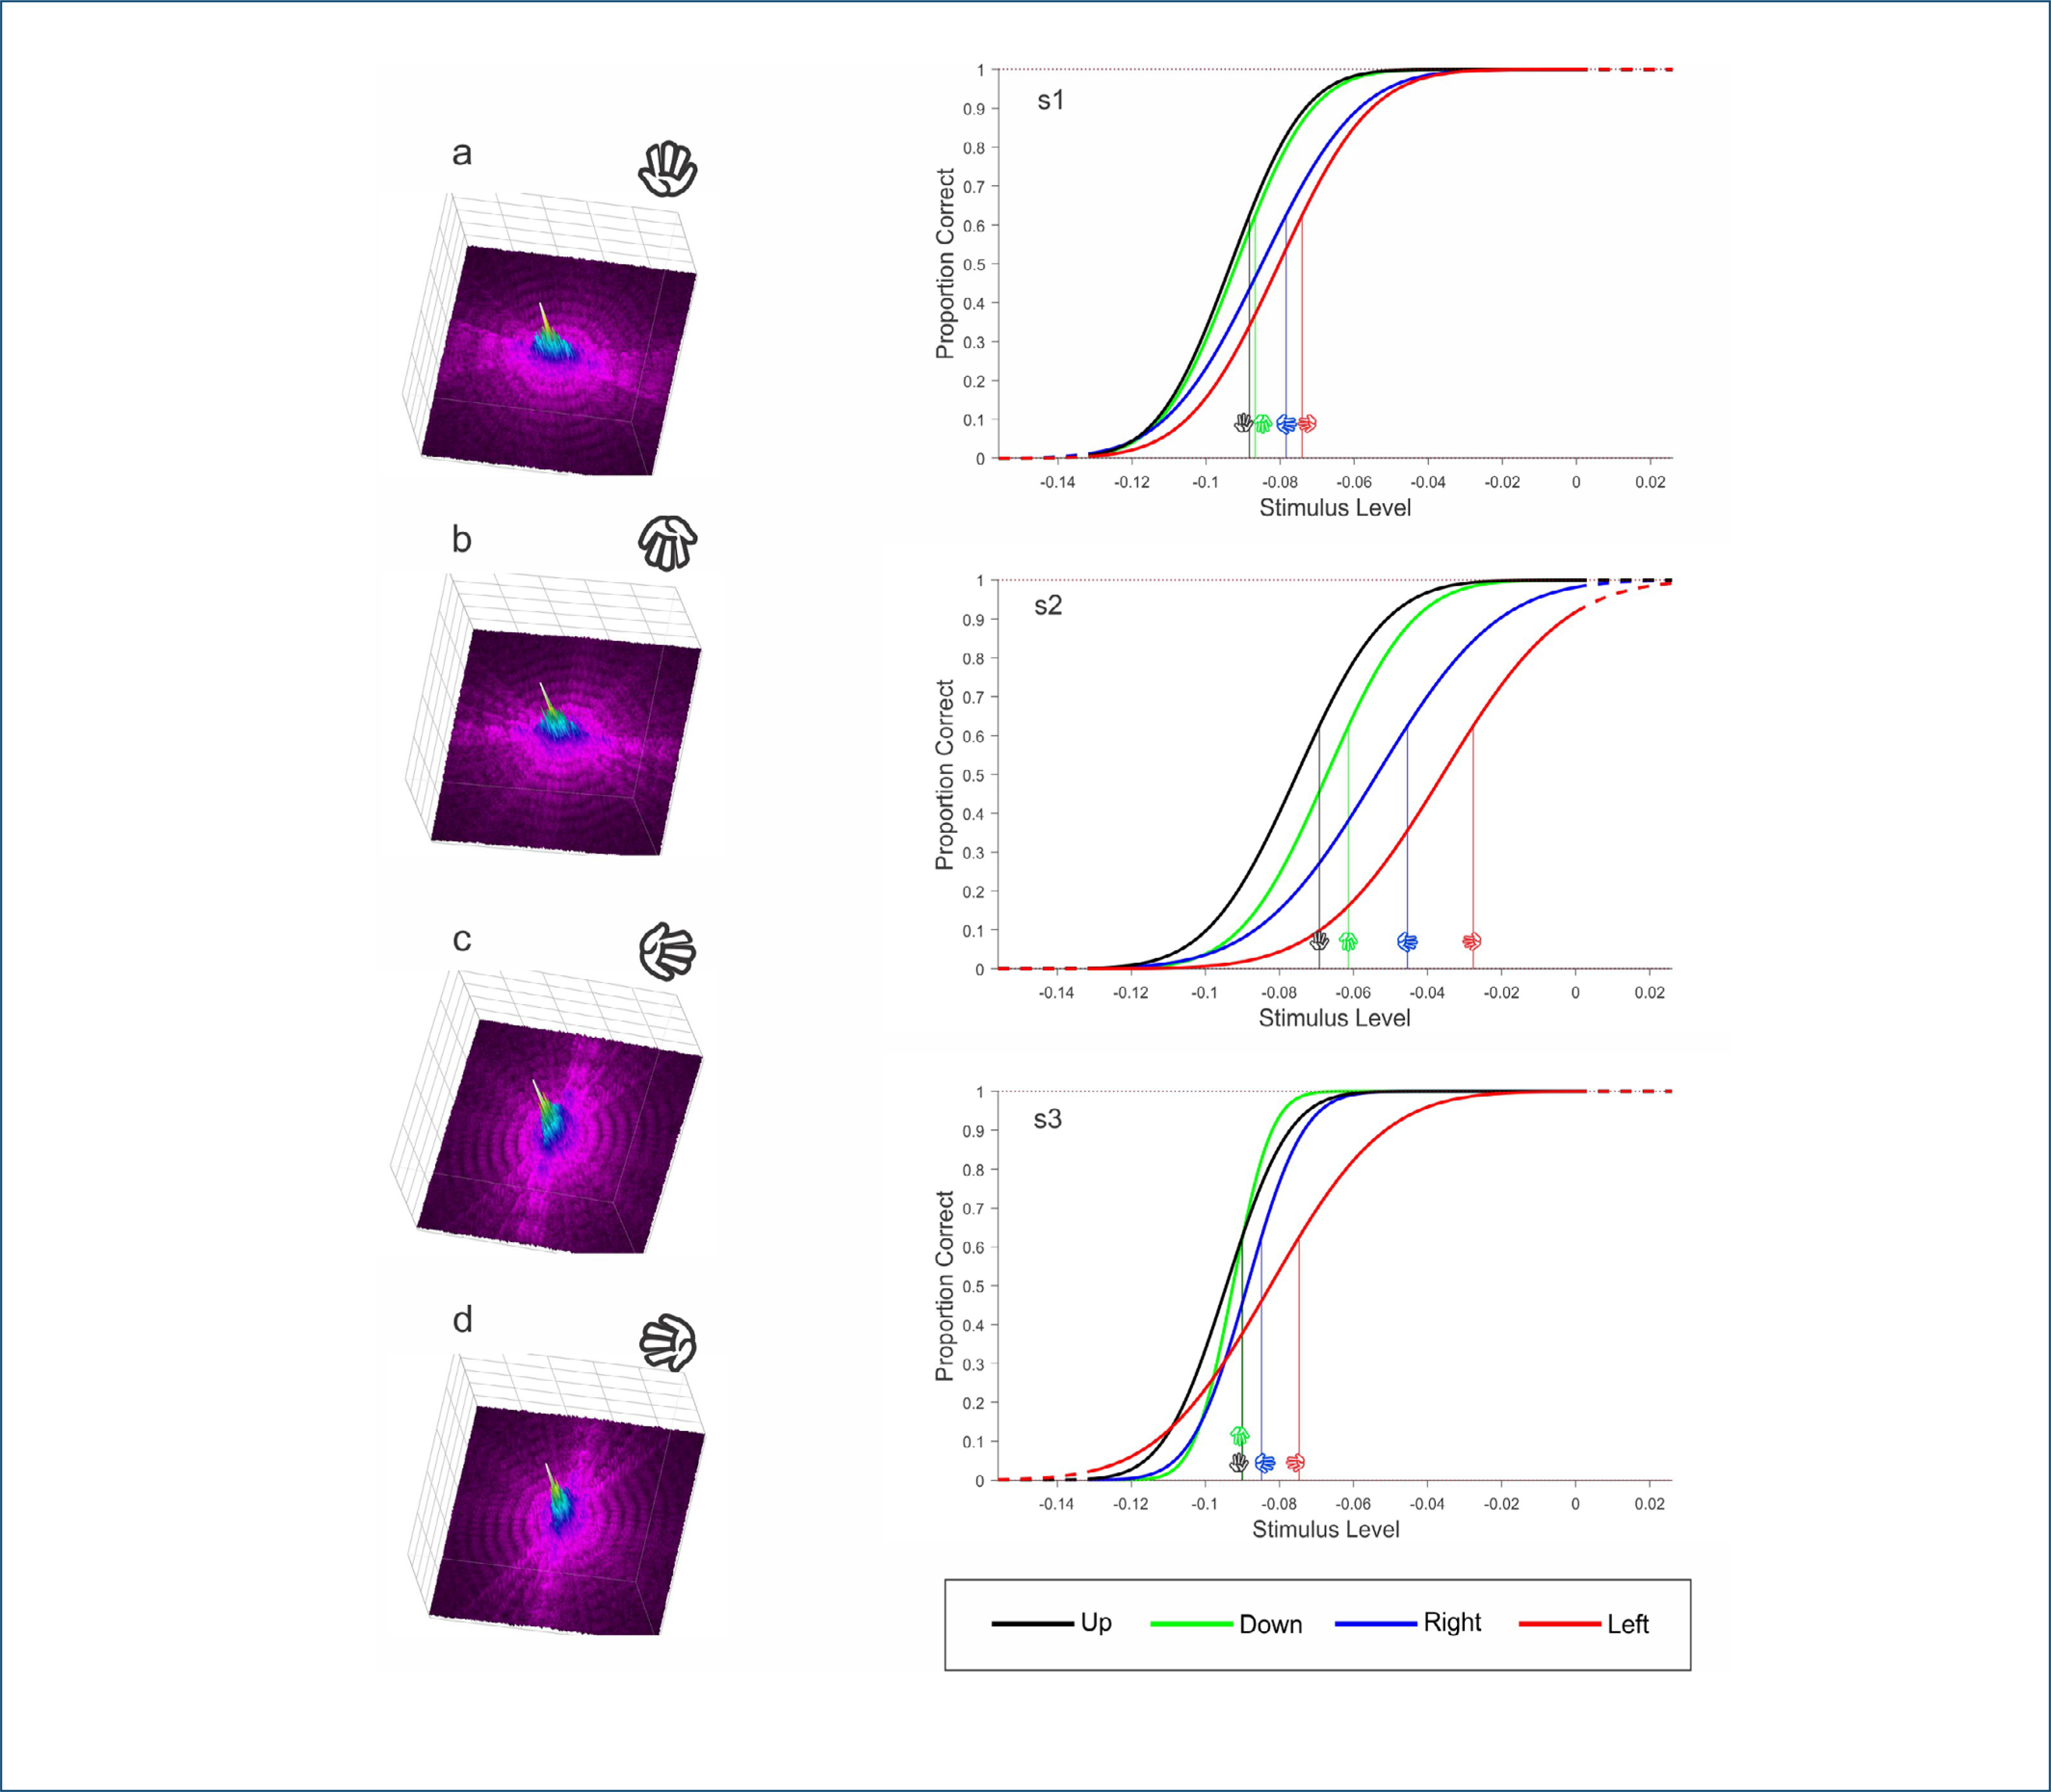
The Fourier transform of the hand pictogram set was then executed, which revealed slightly distinct directional stimuli (vertical versus horizontal) in Fourier signals across low and high frequency areas (Figure 3A to 3D). The authors find this information significant as directional signals can influence detection preferences. Differences in logMAR (Logarithm of the Minimum Angle of Resolution) thresholds across various directions will be further analyzed and discussed in the discussion section of this paper.
Figures A to D represent the tumbling-hand optotypes on a white background as presented to participants, and their two-dimensional frequency spectrum of the stimulus after Fourier transform is shown in a 3D plot perspective. Note that the amplitude, or magnitude, of the Fourier transform is distributed at low and high frequencies, and the frequency patterns vary depending on the direction of the hand pictogram. The right column shows the psychometric functions used to analyse hand optotype directions based on measurements from subjects S1, S2, and S3. The data show the percentage of correct responses versus logMAR for different sizes of options. The solid curves represent optimal fits obtained through least-squares analysis using Weibull functions. Hands in the vertical orientation (up, down) were slightly easier to identify.
Pilot study methods
Subjects
The study included three participants with normal vision. The study subjects were unfamiliar with the optotypes. Two individuals were male (s1 and s2) and 27 and 34 years old, respectively. The third individual (s3) was female and was 34 years old. VA values, in logMAR, for S1, S2, and S3 were −0.12, 0.10, and −0.14, respectively, and their corresponding refractive errors were −1.00 sph., +0.25 sph. −1,25 cyl. × 180° and +0.25 esf., respectively.
Stimuli
The test stimuli consisted of the pictograms previously developed: two vertical and two horizontal hands. The test conditions used were threshold values less than or equal to 0 logMAR (Snellen equivalent 6/6), presented at a test distance of 5 m, were considered normal; differences in threshold values of up to 0.04 logMAR (2 letters in the ETDRS method) between different tests were not considered relevant.
Each optotype was presented separately in the centre of a 27-inch monitor placed 5m from the subjects. Screen resolution was 1,920 x 1,080 pixels. Optotypes were presented in black on a white background with luminance values of 3 and 120 cd m-2, respectively. The contrast was set to a maximum of 500:1. The stimulus display was viewed monocularly with the participants wearing their own corrective glasses.
Procedure
Participants underwent a brief practice session to identify optotype positions by copying them with their hands. Threshold estimations were obtained using a two-down, one-up rule, targeting 71% accuracy.(8) Subsequently, 80 randomized trials (20 per direction) were presented at a logMAR value near the estimated threshold. Participants replicated the images or guessed if unsure, with a 2 to 3 second interstimulus interval, during which the examiner recorded responses and generated the next stimulus.
Validation study A (verbal neurotypical patients)
The tests were performed during an ophthalmological consultation at a reference service. The collected data on VA were compared to the printed Tumbling-E test. The study population consisted of healthy neurotypical patients at a reference ophthalmology service (Instituto Visão para Todos) in João Pessoa (PB, Brazil), in the year 2023, as detailed below.
Participants
The project adhered to the core ethical principles of the Declaration of Helsinki and was approved by the following ethics committee: Faculdade de Ciências Médicas, Paraíba, Brazil. All participants provided informed consent prior to screening for eligibility.
Patients evaluated for an ophthalmological consultation were selected in December 2023. Patients with a history of any ocular disease, under 10 years old, VA worse than +0.5 logMAR (20/63) in both eyes and record of any cognitive deficit or need for interpretation were excluded.
Research design
All individuals were submitted to a noncycloplegic subjective refraction before the acuity test. Standard clinical practices were used to examine subjective refraction on a standard logMAR chart.(1,9) If the subject wore contact lenses or if habitual refraction was out of date, proper spectacle correction was offered in a phoropter. The right eye was examined in each case.
Tests
Visual acuity was measured at a 5-m distance using the EyeCharts digital system (JCL Medical, Brazil) featuring rotated hand optotypes. Participants were presented with optotypes in either single rows of five symbols with 100% spacing or blocks of gradually increasing size, following Bailey and Lovie's logarithmic scale methodology.(10,11) To assess repeatability, tests were repeated one week later in the same presentation order.
The digital charts were displayed on a 32-inch Android TV with 1080p resolution, and contrast and luminance were adjusted based on values established in the pilot test. MAR consistency was ensured across devices. For comparison, Tumbling-E optotypes were tested using a printed LogMAR chart at the same 5-meter distance under uniform lighting conditions of approximately 500 lx. The Tumbling-E printed format, widely recognized as a standard for VA assessment,(3) was used as a reference for evaluating the performance of the Tumbling Hand test.
Procedure
To avoid co-dependency, visual acuities were only measured in the right eye. Two ophthalmologists evaluated the VA parameters. The retest was carried out by the same operator as in the first evaluation, and all data were registered in a digital form.
The letter-by-letter method was used to score VA.(9) The participant had to properly interpret at least three out of the five targets for the value associated with that row to be recorded. The number of symbols recognized and orally stated, that is, 3/5, 4/5, or 5/5, were then recorded. In this method, LogMAR is computed by adding the value corresponding to the row at which the observer identified at least one character (0.02) for each uncorrected response. For example, if the subject recognizes four letters out of five in row 0.1 LogMAR, the test will score 0.1+0.02 = 0.12.
Statistical analysis
The agreement between measurements was assessed using Bland-Altman plots, focusing on mean bias and 95% limits of agreement (LoA). Test-retest (TRT) agreement was performed using a two-way mixed-effects model and intraclass correlation coefficient (ICC). One-way ANOVA was performed to compare all VA values.
Data were analyzed using Bland & Altman software for Microsoft Excel (Version 6.15.4 for Windows 10) and IBM SPSS Statistics for Windows, version 20 (IBM Corp., Armonk, N.Y., USA).
Validation Study B (neurodivergent participants)
The study population consisted of patients with some degree of intellectual disability and language impairment. The study was conducted at the same reference ophthalmology service mentioned in Validation Study A.
Participants
The study included individuals from APAE (Associação de Pais e Amigos dos Excepcionais - APAE), a non-governmental organization in João Pessoa, dedicated to supporting individuals with intellectual and multiple disabilities. Participants’ history was collected and classified by disability level into mild, moderate, and severe, according to the Diagnostic and Statistical Manual of Mental Illnesses (DSM-5) intellectual disability criteria(12) and further grouped by pathology into Autism Spectrum Disorder (ASD), Down syndrome, and other disabilities.
Only individuals aged 5 years or older were included, as directional orientation and motor coordination skills typically develop around this age.(13) Exclusion criteria included uncorrected vision impairments, uncontrolled epileptic seizures, severe intellectual and motor disabilities interfering with visual tests.
The study complied with the Declaration of Helsinki and received approval from the Faculdade de Ciências Médicas ethics committee in Paraíba (CAAE: 74878123.2.0000.5178). Informed consent was obtained from all participants or their legal representatives before eligibility screening.
Research design
All participants underwent non-cycloplegic automatic refraction before the acuity test. They were randomized to perform the Tumbling-hand optotype and other gesture-based tests, including Tumbling E and Landolt C. Tests were considered complete when participants correctly identified the optotypes and achieved a VA better than 0.3 logMAR. This threshold was selected based on established standards in VA assessment, ensuring that only those who demonstrated adequate visual recognition and acuity were included in the final analysis. All participants also performed a second test, regardless of their performance on the first.
Tests
Distance, contrast, luminance and device resolution were adjusted to match the same values in the first validation test.
Procedure
To ease visualization and minimize the crowding effect, the test displayed a single optotype at the center of the screen, varying in size and orientation. Data collected from these tests were subsequently analyzed to compare the effectiveness of the gesture tests.
Statistical analysis
Descriptive statistics were used to summarize the demographic and clinical characteristics of the participants. Categorical variables were presented as frequencies and percentages. McNemar's test was employed to compare paired categorical data, particularly the performance between different VA tests (Tumbling Hand, Tumbling E and Landolt C). The level of statistical significance was set at p < 0.05.
For intergroup comparisons, chi-square tests were used to analyze the success rates of the VA tests among individuals with different disabilities (ASD, Down syndrome, and other disabilities). Randomization ensured unbiased distribution across the test sequences.
All analyses were performed using IBM SPSS Statistics for Windows, version 20 (IBM Corp., Armonk, N.Y., USA).
RESULTS
Pilot study results
In psychometric evaluations, the average logMAR threshold across all hand directions was −0.071. VA was better for hands in vertical orientations (up = −0.081 logMAR; down = −0.078 logMAR) compared to horizontal orientations (right = −0.068 logMAR; left = −0.058 logMAR), with a maximum difference of 0.023 logMAR, equivalent to approximately one letter. Figure 3 presents the psychometric functions for subjects s1, s2, and s3, with mean slopes of 31.22, 17.81, and 22.36, respectively.
The threshold size of the hand optotype was calculated as 1.93 times the Tumbling E optotype at a MAR of 1 minute of arc (1’), guiding its resizing and calibration. Validation tests began after the calibration on the digital screen system.
Validation study results
In Validation Experiment A, conducted with neurotypical individuals, 90 participants were selected, of whom 75 completed the test and retest phases (Table 1). The mean age was 33.5 ± 17.5 years, ranging from 12 to 60 years, with 35 males and 40 females. Repeatability results were assessed using the ICC, showing good (ICC > 0.75) to excellent reliability (ICC > 0.90) for the Tumbling Hand test on digital screens, in both single-line and block modalities. The printed Tumbling E test also demonstrated strong reliability (ICC > 0.878). Bland-Altman plots compared digital Tumbling Hand optotypes with the standard printed Tumbling E chart across different presentation (Figure 4). The plots indicated a mean bias close to 0.00 logMAR, with limits of agreement ranging ±0.205 (single line presentation) and ±0.155 (logMAR chart). ANOVA analysis revealed no significant differences between presentation formats] F(1.586) = 0.011; p = 0.918].
Mean ± standard deviation values of the visual acuities obtained by different testing procedures and sessions

Bland-Altman plots compare digital Tumbling Hand optotypes with the printed Tumbling E chart across different presentation modalities (single-row and logMAR chart). Bias and 95% limits of agreement are shown with dashed lines, and confidence intervals are shaded. Values are on a logMAR scale, with the x-axis representing the average of measurements from the first session, and the y-axis indicating the difference between tests.
In Validation Experiment B, conducted with neurodivergent individuals, 80 participants were included, with a mean age of 19.45 ± 11.61 years, ranging from 5 to 47 years. The group consisted of 48 males (60%) and 32 females (40%), and participants were classified as ASD (n = 28, 35%), Down syndrome (n = 26, 32.5%), and other disabilities (n = 26, 32.5%), which included cerebral palsy (n = 17) and intellectual disability without specific etiology (n = 9). In terms of disability levels, 58 participants (72.5%) were classified as mild and 22 (27.5%) as moderate.
The Tumbling Hand test demonstrated the highest overall success rates. As a primary test, it achieved a success rate of 54.55%, outperforming the Landolt C (40%) and Tumbling E (28.57%) tests, although these differences were not statistically significant (p = 0.443). As a secondary test, the Tumbling Hand's success rate increased to 72.73%, significantly surpassing the Landolt C (50%) and Tumbling E (38.46%) tests (p = 0.001). Success rates were significantly higher in participants aged 10 years and older compared to those under 10 (p < 0.01), while no significant associations with gender were observed (p > 0.05).
Considering combined results from primary and secondary tests, the Tumbling Hand test achieved success rates of 72.22% in individuals with ASD, 28.57% in Down Syndrome, and 55.56% in participants with other disabilities. The Tumbling E test had success rates of 38.89% in ASD, 22.22% in Down Syndrome, and 38.46% in other disabilities. The Landolt C test achieved success rates of 50% in ASD, 25% in Down Syndrome, and 42.86% in other disabilities. Statistical analysis (Chi-squared test; p = 0.087) indicated that the higher success rate of the Tumbling Hand test in ASD was not statistically significant when compared to other tests. However, success rates in Down Syndrome were significantly lower across all tests (p < 0.05).
Deficiency levels significantly influenced test performance (p < 0.001), with mild deficiencies consistently achieving higher success rates than moderate deficiencies. The Tumbling Hand test showed the highest success rate in mild deficiencies (58.33%), followed by the Landolt C (50%) and Tumbling E (36.36%), although these differences were not statistically significant (p = 0.427).
DISCUSSION
Although pictograms for assessing VA of non-verbal individuals have been previously developed,(1,6,14) the Tumbling Hand optotype was specifically designed to improve accessibility for individuals with language or cognitive impairments. Unlike the Landolt C and Tumbling E, which require symbolic interpretation, such as viewing a ‘C’ as a semi-closed hand, adding a cognitive step that can make the task more difficult for individuals with such impairments, the Tumbling Hand test relies on direct gesture replication. This eliminates the need for complex analogies, making it easier to recognize and replicate. The simplicity and intuitiveness of the design reduce the need for extensive pre-test instruction, enhancing comprehension and inclusivity during VA examinations.
When assessing Tumbling-hand thresholds, our psychometric pilot test unveiled an average of −0.071 logMAR. A parallel study examining Tumbling-E through psychophysical methods reported a comparable monocular threshold value of −0.045 logMAR,(15) indicating a marginal difference of 0.026 logMAR, equivalent to only one letter. In addition, our validation study showed a high correlation in TRT (0.871-0.955), and a small bias in the Bland-Altman analysis between digital Tumbling-hand and standard Tumbling-E tests (0.00 to 0.02 logMAR), indicating that the two methods have a tendency to produce similar measurements. The LoA in this study (± 0.155 to ± 0.205 logMAR) aligns with previous research (± 0.10 to ± 0.40 logMAR),(16,17) supporting the validity and reliability of the VA measurements.
Since the 1970s, few hand-based optotypes have been developed to replace Tumbling E. The Sjögren hand test, introduced in West Africa for illiterate populations, significantly reduced untestability,(7) but lacked rigorous psychophysical testing and computerized image analysis.
Figure 5 shows that the Sjögren hand optotypes exhibit low confusability (SSIM = 0.704), indicating strong discriminatory capability, which may suggest that filled and asymmetric characteristics, as shown in Figure 5B, reduce efficiency on most of the digital screen resolution (68.88 ppi), as smaller optotypes are needed to reach the figure-ground perception threshold.(18–20) In addition to the asymmetry of the images, the visual system could detect low-frequency patterns in high asymmetric images near the acuity threshold, which could theoretically result in lower reproducibility of the examination.

Structural Similarity Index and maps for two distinct pictograms – rotated Tumbling-hand (A) and rotated Sjögren hand optotypes (B). Both optotypes underwent the same level of blur. Notably, in figure B, hand directions are identifiable in the similarity map, marked by the triangle on the vertical hand and the asterisk on the horizontally positioned hand. Moreover, the similarity index in figure B is markedly lower than that in figure A for the same blur level.
The efficiency of complex optotype development can also be influenced by directional distinguishability, as demonstrated by Fourier transform signals and pilot tests in pattern recognition. Previous studies have shown that anisotropic normalization affects the detection and perception of differently oriented stimuli,(21–24) with a "horizontal effect" favoring oblique images, followed by vertical and horizontal orientations. This anisotropy, observed in contrast thresholds and recognition of oriented structures, aligns with our pilot study results, which showed slightly better VA for hands in the vertical compared to the horizontal direction (approximately one letter).
The second validation study examined the success rates and practicality of the Tumbling Hand test in neurodivergent populations. The results showed its effectiveness for VA assessment, with higher success rates emphasizing the need to adapt testing methods for individuals with cognitive and communicative challenges.(25) The higher performance observed in participants who were 10 years and older highlights the importance of cognitive and motor development in the feasibility of the test.(26)
The Tumbling Hand test's strong performance in ASD reflects the utility of gesture-based designs in populations with focused visual attention.(27) However, lower success rates in participants with Down Syndrome highlight the need for further adaptations to address specific cognitive and motor limitations. Less cooperative children should be assessed using grating acuity or spatial frequency–based visual acuity tests, which rely on preferential looking rather than optotype recognition.(28) Additionally, the higher success rates in the mild deficiency group compared to the moderate group emphasize the importance of simplified optotypes in enhancing accessibility.(29)
This study has some limitations that must be considered. The sample size, particularly for neurodivergent participants, may restrict the generalization of findings to broader populations with varying cognitive and motor abilities. Individuals with severe intellectual or motor impairments were not included, which may limit the applicability of the test in these cases. Additionally, the lower resolution of digital screens (68.88 ppi) compared to printed charts (300 ppi)(18) could have influenced the results, particularly for smaller optotypes. Further studies with larger samples and multi-center validation are needed to confirm the reliability and applicability of the Tumbling Hand test across diverse clinical settings.
A key limitation of this study is the absence of comparison with the ETDRS chart, which is considered the gold standard for VA assessment in clinical research. However, ETDRS requires verbal responses or literacy, making it less suitable for populations with communication challenges, such as autistic individuals and those with intellectual disabilities. Instead, we focused on gestural-based optotypes (Tumbling E, Landolt C) to ensure a more appropriate and comparable evaluation within our target population.
Tumbling-hand optotype fonts are freely available for non-commercial use at https://github.com/eyecharts/TumblingHand. Researchers are encouraged to explore their suitability for diverse applications, with the aim of supporting broader use through open and collaborative development.
CONCLUSION
This study presents the Tumbling Hand pictograms as a reliable alternative to existing gesture-based tests for visual acuity assessment. The test showed excellent reproducibility in neurotypical individuals and achieved promising success rates in neurodivergent populations. These results reinforce the importance of gesture-based designs in improving accessibility for individuals with cognitive and communicative challenges. Further research in larger and more diverse populations is needed to confirm its clinical applicability and support inclusive vision care.
Data availability statement:
The datasets generated and/or analyzed during the current study are included in the manuscript.
REFERENCES
- 1 Aleci C, Rosa C. Psychophysics in the ophthalmological practice – I. visual acuity. Ann Eye Sci. 2022;7(1):37.
-
2 American Optometric Association (AOA). Optometric Clinical Practice Guidelines. [cited 2025 Nov 7]. Available from: https://www.aoa.org/optometrists/tools-and-resources/clinical-care-publications/clinical-practice-guidelines
» https://www.aoa.org/optometrists/tools-and-resources/clinical-care-publications/clinical-practice-guidelines - 3 Guimaraes S, Fernandes T, Costa P, Silva E. Should tumbling E go out of date in amblyopia screening? Evidence from a population-based sample normative in children aged 3-4 years. Br J Ophthalmol. 2018;102(6):761–6.
- 4 Alexander KR, McAnany JJ. Determinants of contrast sensitivity for the tumbling E and Landolt C. Optom Vis Sci. 2010;87(1):28–36.
- 5 Sumalini R, Satgunam P. Grating acuity tests for infants, young children and individuals with disabilities: A review of recent advances. Semin Ophthalmol. 2023;38(1):76–84.
- 6 Cromelin CH, Candy TR, Lynn MJ, Harrington CL, Hutchinson AK. The handy eye chart: a new visual acuity test for use in children. Ophthalmology. 2012;119(10):2009–13.
- 7 Thylefors B. Vision screening of illiterate populations. Bull World Health Organ. 1977;55(1):115–9.
- 8 Schütt HH, Harmeling S, Macke JH, Wichmann FA. Painfree and accurate Bayesian estimation of psychometric functions for (potentially) overdispersed data. Vision Res. 2016;122:105–23.
- 9 Facchin A, Maffioletti S, Martelli M, Daini R. Different trajectories in the development of visual acuity with different levels of crowding: The Milan Eye Chart (MEC). Vision Res. 2019;156:10–6.
- 10 Bailey IL. Visual acuity. Elsevier Health Sciences; 2006.
- 11 Bailey IL, Lovie-Kitchin JE. Visual acuity testing. From the laboratory to the clinic. Vision Res. 2013;90:2–9.
-
12 Special Strong. DSM-5 intellectual disability: a guide to criteria and types. 2023 [cited 2025 Nov 7]; Available from: https://www.specialstrong.com/dsm-5-intellectual-disability-a-guide-to-criteria-and-types/
» https://www.specialstrong.com/dsm-5-intellectual-disability-a-guide-to-criteria-and-types/ - 13 Bayley N. Bayley Scales of Infant and Toddler Development: Third Edition (Bayley-III). San Antonio, TX: Pearson Assessments; 2006.
- 14 Good WV. Vision assessment of nonverbal patients. Am Orthopt J. 2007;57(1):13–8.
- 15 Campo Dall'Orto G, Facchin A, Bellatorre A, Maffioletti S, Serio M. Measurement of visual acuity with a digital eye chart: optotypes, presentation modalities and repeatability. J Optom. 2021;14(2):133–41.
- 16 Jan-Bond C, Wee-Min T, Hong-Kee N, Zu-Quan I, Khairy-Shamel ST, Zunaina E, et al. REST – An Innovative Rapid Eye Screening Test. J Mob Technol Med. 2015;4(3):20–5.
- 17 Yulianti NF, Munawir A, Adji NK. Validity of electronic device-based application for visual acuity examination: a systematic review. Indonesian J Electronic Electromed Med Inf. 2022;4(1):41–7.
- 18 Marran L, Liu L, Lau G. Desktop publishing and validation of custom near visual acuity charts. Optom Vis Sci. 2008;85(11):1082–90.
- 19 Larimer JO, Gille J, Powers MK, Liu HC. Hyperacuity on high-resolution and very high resolution displays. In: Human Vision and Electronic Imaging IX. SPIE; 2004. Vol 5292. p. 211–7.
- 20 Boggess B, Wiechel J, Morr D, Anderson J, Pipo J. Anatomical limitations of the visual field of view: An example of driving perspective. SAE Technical Paper No. 2008-01-1876. 2008.
-
21 DeFord JK, Hansen BC, Sinai MJ, Essock EA. Oblique stimuli are seen best (not worst!) in naturalistic broad-band stimuli: a horizontal effect. Vision Res. 2003;43(12):1329-1335. doi:10.1016/S0042-6989(03)00142-1
» https://doi.org/10.1016/S0042-6989(03)00142-1 - 22 Maloney RT, Clifford CW. Orientation anisotropies in human primary visual cortex depend on contrast. Neuroimage. 2015;119:129-45.
- 23 Hansen BC, Essock EA, Zheng Y, DeFord JK. Perceptual anisotropies in visual processing and their relation to natural image statistics. Network. 2003;14(3):501–26.
- 24 Hansen BC, Essock EA. A horizontal bias in human visual processing of orientation and its correspondence to the structural components of natural scenes. J Vis. 2004;4(12):1044–60.
- 25 Claessens JL, Geuvers JR, Imhof SM, Wisse RP. Digital tools for the self-assessment of visual acuity: a systematic review. Ophthalmol Ther. 2021;10(4):715–30. [Erratum in: Ophthalmol Ther. 2021;10(4):731-4].
- 26 Myklebust AK, Riddell PM. Development of visual acuity in children: assessing the contributions of cognition and age in Lea Chart acuity readings. Optom Vis Sci. 2021;99(1):24-30.
- 27 Chung S, Son JW. Visual perception in autism spectrum disorder: a review of neuroimaging studies. J Korean Acad Child Adolesc Psychiatry. 2020;31(3):105–20.
- 28 Jenkins PL, Simon JW, Kandel GL, Forster T. A simple grating visual acuity test for impaired children. Am J Ophthalmol. 1985;99(6):652-8.
- 29 Liu Q, Lai H, Le J, Lan C, Zhang X, Huang L, et al. Identifying brain functional subtypes and corresponding task performance profiles in autism spectrum disorder. Mol Psychiatry. 2025;30(11):5034–44.
Edited by
-
Associate editor:
Marta Halfeld Ferrari Alves Lacordia Universidade Federal de Juiz de Fora, Juiz de Fora, MG, Brazil https://orcid.org/0000-0003-4296-4871