
 Modelling a battery with an accessible and inclusive Arduino-based experimental setup
Abstract
This study presents an accessible experimental setup using an Arduino to model a real battery. It addresses the challenge of limited resources in physics education by providing an analogous representational model for investigating the relationship between a battery’s terminal voltage and current. Our methodology uses the Arduino as a voltage source, with a resistor simulating the battery’s internal resistance and a potentiometer acting as the variable load. The setup also includes a buzzer to provide auditory feedback, making the activity inclusive for visually impaired students. The results confirm the setup’s accuracy, with linear regression yielding minimal errors when compared to multimeter readings and attest that maximum electrical power transfer occurs when the load resistance matches the battery’s internal resistance. This approach not only provides a solution for schools with limited equipment but also promotes hands-on learning and essential skills in experimental design and data analysis.
Keywords:
Physics education; Inclusive experiment; Visually impaired students; Educational technology; Accessible experiment; STEM education.
1.Introduction
Real batteries are studied in physics courses, from secondary school through introductory university levels [1, 2, 3] and involve concepts like electromotive force () and internal resistance (). The potential difference across a real battery, often termed the “terminal voltage”, is typically discussed mathematically, but the graphical representations of how this potential difference varies with circuit current ,
are usually presented in a minimalistic way on the side of the pages [2, 3].
The terminal voltage versus , , for a real battery can be determined experimentally with relatively simple materials, namely a rheostat () usually known as load resistor, two multimeters (for measuring current and voltage), a resistor () representing the internal resistance of the battery, a power supply, and connecting wires (Figure 1).
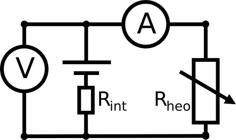
Scheme of an electrical circuit to study the characteristic curve of a real battery. V represents the voltmeter and A represents the Ammeter.
In Portuguese secondary education [4], as in many other countries [5, 6, 7, 8, 9], students investigate the relationship of a real battery. The experiment requires switching the circuit on and off for each measurement and capturing voltage () and current () data rapidly, before readings stabilize, since the battery’s internal resistance () and the external resistance () must be comparable to clearly identify the point of maximum power transfer. This leads to relatively high currents, accelerating battery depletion and increasing , thus compromising the validity of the linear model. To mitigate this, students are taught to model the battery as an ideal voltage source in series with , enabling a more controlled and stable exploration.
Although this is a mandatory experiment in Portuguese schools, it is sometimes conducted only as a teacher demonstration. Based on the authors’ experience through Erasmus programs and international collaborations, students in other countries such as Brazil, Romania, Latvia, Greece, and Türkiye also encounter similar situations, often due to limited laboratory space or a lack of functional or affordable equipment.
This experimental activity is not limited to secondary education. It can also be implemented in university settings, both in introductory physics courses on electromagnetism and in instrumentation courses for teacher training programs. However, based on the authors’ experience, many schools across different countries face challenges in providing all the necessary materials for their students, whether at the secondary or higher education level. Countries where such difficulties are particularly evident include East Timor, Mozambique, Angola, and Cape Verde.
To address those difficulties, a compact, accessible (around $30) experimental setup using Arduino is proposed to enable students to investigate the relationship between the potential difference across the terminals of a battery model and the electric current in the circuit, and how the electrical power of the battery changes with . To make this activity inclusive for visually impaired students, a piezoelectric buzzer is included in the setup to provide qualitative feedback through sound.
The choice of Arduino is motivated not only by its affordability, but also by its versatility for a wide range of practical activities that require inexpensive sensors. This means that, once the Arduino board has been acquired, the additional investment in other components is relatively modest. This provides enough material for students to engage actively in hands-on work, rather than remaining passive observers of teacher-led demonstrations. Several works describe the integration of Arduino into experiments and instructional activities [10, 11, 12, 13, 14, 15, 16, 17], and the full setup proposed in this work is detailed in a further section.
2. Theoretical framework: representations and models
Models are constantly used in physics and physics education [18, 19]. To transition from an experimental activity with a real battery to one using an Arduino, it is essential to first adopt a theoretical framework. This framework should clarify both the meaning of the modeling process and the limitations of the specific model being used. According to Redhead [20] and Redish [21], models are often employed by physicists as approximations of phenomena, serving different purposes in research and education. For Achinstein [22], there is a distinction between three broad categories of models: representational, theoretical, and imaginary.
Representational models are physical three-dimensional constructions of objects that allow the investigation of reality through direct examination. Examples include molecular structures, solar system replicas, or engineering prototypes such as dams and aircraft. Their value lies in simplifying analysis and enabling safer, cheaper, and more accessible exploration of systems that would otherwise be too complex, costly, or dangerous to study directly.
Theoretical models provide simplified frameworks for understanding complex systems. They consist of sets of assumptions that are often limited or even inaccurate if taken literally, but they are nonetheless pragmatically useful. For instance, the billiard-ball model of gases allows for tractable calculations and explanations, while the Rutherford and later Bohr models of the atom employ an analogy with planetary systems. Such models, although embedded in broader theories, stand out for their heuristic utility rather than their literal accuracy.
Imaginary models, in turn, do not require their assumptions to be true or even plausible. Instead, they explore how a system would behave under specific, sometimes artificial, conditions. Functioning as thought experiments, they test the logical consistency of assumptions, inspire further inquiry, and offer concrete ways to grasp abstract principles, regardless of whether they accurately represent reality.
Within representational models, Achinstein [22] identifies four subtypes classified by their fidelity to the prototype: true models replicate essential features on a uniform scale, enabling direct measurement, such as a scaled-down model of a building’s facade, used to measure wind resistance. Adequate models reproduce only the characteristics necessary for a given investigation. Distorted models intentionally alter scaling factors, for example, height versus width, to facilitate construction or analysis, though requiring conversion factors. Finally, analogue models reproduce the behavior of the prototype through a different physical system governed by similar principles, for example, using an electrical circuit to represent an acoustic system.
In this study, we employ an analogue representational model to simulate a real battery. Specifically, a purely electrical system (Arduino and resistors) is used to represent a complex electrochemical process with inherent energy losses, reproducing the observable behavior of the real system. Later, the limitations of the employed model will also be discussed.
3. Method
A real battery can be modelled as an ideal voltage source in series with an internal resistance. In this setup, the Arduino board serves as the ideal voltage source, supplying an electromotive force (emf) of approximately 5.0 V and measuring the potential difference across circuit elements. A resistor simulates the (Figure 2). By measuring the voltage drop across , we can calculate the current in the circuit using the relation . For simplicity, we will refer to as the “current” resistor, as its only purpose is to enable us to determine indirectly the electric current in the circuit.

Experimental setup representation using Tinkercad platform [25]. Available at https://shorturl.at/OhU5D.
A potentiometer simulates the rheostat () of Figure 1, allowing for changes to the voltage and current across the circuit. The method of determining both the potential difference across circuit elements and the current has already been tested and validated [23]. So, the use of a internal resistance () serves only the purpose of modelling a real battery and its behavior while using a potentiometer () that is cheap and readily available for purchase.
To enhance functionality, a buzzer, two buttons and resistances ( and ) were added: the buzzer provides auditory feedback, and the buttons are used to capture and record relevant data for the activity. It is worth noting that it is possible to achieve similar results for the buttons without the use of and if, in the source code, we specify the input pullup option [24].
Therefore, the complete experimental setup of Figure 2 requires four resistors (, , ), a potentiometer (), two push buttons (btn1 and btn2), one piezo buzzer (buzz), breadboard, an Arduino board and wires. Figure 3 shows a simplified schematic of Figure 2. The analog pins A0, A1 and A2 are used to obtain the potential difference between resistors. Figure 4 is a photograph of the real setup.


When button btn1 is pressed, the buzzer emits a sound with a frequency proportional to the circuit’s current. Pressing the other button (btn2), a sound is produced with a frequency proportional to the potential difference across the power source and the “internal” resistor, . The frequency range of sounds was arbitrarily chosen according to the authors’ perception of which range would best allow distinguishing how the respective physical quantity varied. Each time either button is pressed, current and potential difference values for the source and are displayed on the computer screen through Arduino’s serial monitor, providing real-time data monitoring. The voltage of the “battery” is measured in pin A1 and the current in the circuit is given by .
4. Results
Using the experimental setup shown in Figure 2, data for I and U were collected for several values of resistance of the potentiometer. A linear regression was performed using Excel®’s LINEST function (Figure 4) along with a residuals analysis (Figure 5) to assess the fit to the data. The slope, representing the internal resistance, was determined as: , the y-intercept, representing the emf (electromotive force), was V, with . All following graphs were made in MS Excel®.

Characteristic curve of a “real” battery: data points and the corresponding linear fit. Because of the internal resistance, the voltage of the battery decreases as the circuit current increases, in accordance with equation (1).
Independent measurements of emf and of the internal resistance () were taken using a BK TEST BENCH 388A multimeter. The emf was measured as () V and as . Assuming these multimeter measurements to be the “true” values, the results show an experimental error of 0.47% for the emf and 0.50% for the internal resistance. The residuals analysis (Figure 6) showed randomly distributed points, suggesting that the linear function is appropriate for the fit.

Residuals analysis of the line fit showing randomly distributed points that validate the linear fit.
To further validate the experimental setup, new data were collected for different combinations of and/or . Table 1 shows the tested values where represents the square of the Pearson Correlation Coefficient of the corresponding linear fits. From these data, values for (fitted internal resistance) and (fitted emf) were obtained. The uncertainties of these quantities were calculated by linear data regression in Excel (LINEST) as before. The experimental values were then compared with , the internal resistance measured with the ohmmeter, which is considered the reference value. Similarly, was compared to , the emf measured with the voltmeter. The “current” resistor, , was also measured independently with a voltmeter. Comparing the measured values to the reference ones, error values were calculated as displayed in Table 1, showing a strong agreement between them all.
Results for the several combinations of and . Data are available in the supplementary material 1.
The battery power was also measured and its value was plotted against the load resistance . It can be shown that the electrical power delivered is given by the expression , where is the emf, is the internal resistance and is the load resistance. The power reaches its maximum when , which occurs when the load resistance equals the internal resistance [1, 2, 3].
Figure 7 shows a maximum electrical power for and , when the load resistance R = () was approximately . Because of , the minimum resistance value in the graph will be itself. In this case, .

Electrical power of the source as a function of the load resistance of the electric circuit, for a set of resistances and .
It is important to note that achieving maximum power transfer, which occurs when the load resistance matches the internal resistance (), does not coincide with achieving maximum efficiency. In fact, at , the efficiency is only 50%. This is because efficiency () is defined as the ratio of the power delivered to the load () to the total power supplied by the source ():
When , it follows directly that . Thus, maximum efficiency is reached as becomes much larger than , minimizing internal losses. In other words, the condition for maximum power and the condition for maximum efficiency are inherently different. The point at which the system delivers the most power is not the same point at which it operates most efficiently.
One limitation of this setup for modelling a battery is related to the relative values of the resistors. First, high values for the resistors were used when compared to the typical value of the internal resistor of a battery. Nonetheless, this is still in accordance with the analogue representational model adopted. Also, if one resistor’s value is significantly lower or higher than the others, the results may be compromised due to insufficient resolution in measuring the potential difference, or a current variation too small to yield reliable results. Additionally, since the Arduino’s output pins exhibit an effective output impedance, it is better to use high resistance values in the experiment to minimize the influence of this impedance and ensure more accurate measurements.
To ensure the inclusiveness of this activity to blind or low vision students, the buzzer sounds were acquired by the following process: 1) the potentiometer was set to its minimum value; 2) the button to produce the voltage sound (btn1) was pressed while the potentiometer was being rotated from minimum to its maximum resistance value; 3) after reaching the maximum value the voltage sound button was released; 4) the potentiometer was restored to its initial position with minimum resistance value; 5) then, the current sound button (btn2) was pressed and the potentiometer turned again to its maximum value. It was possible to relate the behaviour of the sounds: as one gets higher, the other gets lower, indicating that while the voltage increases, the current decreases, and vice-versa. The sound recordings and the source code are available in the supplementary material 2–4.
5. Conclusion
This work was based on the analogue representational model for studying the characteristics of a real battery. We propose a simple and accessible Arduino setup to investigate the relationship between potential difference () and current () in a circuit to model a real battery. The setup enabled both quantitative and qualitative measurements, including audio accessibility for visually impaired students. Linear regression of the collected data showed a valid fit, with the slope representing internal resistance and the y-intercept indicating the battery’s electromotive force (emf). Comparison with multimeter measurements revealed minimal errors (0.41% for emf and 0.019% for internal resistance), verifying the setup’s accuracy. The experiment confirmed that maximum electrical power transfer occurs when the load resistance matches the internal resistance, with resonance peak clearly observed in power versus resistance graphs. Limitations of the setup included low resolution in potential difference measurements and insufficient current variation with large resistor differences, affecting result reliability. Despite this, the setup offers a valuable, accessible tool for exploring internal resistance and emf, demonstrating that simple materials can support meaningful experiments even with limited resources. Future improvements should enhance measurement precision and broaden the range of resistor values. In addition to supporting conceptual understanding, this approach offers students valuable hands-on experience in experimental design, data analysis, and modelling, which are key competencies in physics education.
Acknowledgments
The authors are indebted to Fundação para a Ciência e a Tecnologia, Projects UID/4968/2025 (IFIMUP), LA/P/0095/2020 (LaPMET) and to Federal Rural University of Rio de Janeiro, project PIIM5590-2025, for supporting this work. The work was also co-funded by the European Union, Project 2023-1PT01-KA220-SCH-000166387. Views and opinions expressed are those of the authors only and do not necessarily reflect those of the European Union or the National Portuguese Agency. Neither the European Union nor the National Portuguese Agency can be held responsible for them. The authors wish also to express their sincere appreciation to the anonymous reviewers for their insightful suggestions, critical remarks, and thoughtful recommendations. Their contributions have been instrumental in strengthening the presentation and overall quality of this manuscript.
Supplementary Material
The following online material is available for this article:
Supplementary Material 1 – Data
Supplementary Material 2 – Arduino code
Supplementary Material 3 – Current sound
Supplementary Material 4 – Voltage sound
Data Availability
The entire dataset supporting the results of this study is published in the article.
References
- [1] P.A. Tipler and G. Mosca, Physics for Scientists and Engineers (W. H. Freeman, New York, 2007), 6 ed.s
- [2] D. Halliday, R. Resnick and J. Walker, Fundamentals of Physics (Wiley, Hoboken, 2013), 10 ed.
- [3] R.A. Serway and J.W. Jewett, Physics for Scientists and Engineers with Modern Physics (Cengage Learning, Boston, 2013), 9 ed.
-
[4] DIREÇÃO-GERAL DA EDUCAÇÃO, Aprendizagens essenciais de física e química A (10.º ano), available in: https://www.dge.mec.pt/sites/default/files/Curriculo/Aprendizagens_Essenciais/10_fq_a.pdf
» https://www.dge.mec.pt/sites/default/files/Curriculo/Aprendizagens_Essenciais/10_fq_a.pdf -
[5] AQA, AS and A-level Physics Specification (7407, 7408), available in: https://filestore.aqa.org.uk/resources/physics/specifications/AQA-7407-7408-SP-2015.PDF
» https://filestore.aqa.org.uk/resources/physics/specifications/AQA-7407-7408-SP-2015.PDF -
[6] NATIONAL DEPARTMENT OF BASIC EDUCATION, Curriculum and Assessment Policy Statement (CAPS): Physical Sciences FET Phase Grades 10–12, available in: https://www.education.gov.za/LinkClick.aspx?fileticket=uVcOcx728Y8\%3D&tabid=570&portalid=0∣=1558
» https://www.education.gov.za/LinkClick.aspx?fileticket=uVcOcx728Y8\%3D&tabid=570&portalid=0∣=1558 -
[7] COLLEGE BOARD, AP Physics 2 Course and Exam Description, available in: https://apcentral.collegeboard.org/media/pdf/ap-physics-2-course-and-exam-description.pdf
» https://apcentral.collegeboard.org/media/pdf/ap-physics-2-course-and-exam-description.pdf -
[8] ONTARIO MINISTRY OF EDUCATION, The Ontario Curriculum, Grades 11 and 12: Science, available in: http://www.edu.gov.on.ca/eng/curriculum/secondary/science910_2008.pdf
» http://www.edu.gov.on.ca/eng/curriculum/secondary/science910_2008.pdf -
[9] NATIONAL OPEN UNIVERSITY OF NIGERIA, PHY 192: Physics Laboratory I, available in: https://nou.edu.ng/coursewarecontent/PHY192.pdf
» https://nou.edu.ng/coursewarecontent/PHY192.pdf - [10] J.A. Leyva-Cruz, T.J. Lemaire, L.P. Santos, J.S. Carvalho and A.V. Andrade-Neto, Revista Brasileira de Ensino de Física 47, e20250312 (2025).
- [11] W.R.F. Silva, L.V. Freitas, R.O.R.R. Cunha and J.B.S. Mendes, Revista Brasileira de Ensino de Física 45, e20230105 (2023).
- [12] E.B. Santos, M.A. Cezário Júnior, D.S. Araújo, T.M. Abreu and R.A. Dias, Revista Brasileira de Ensino de Física 44, e20210323 (2022).
- [13] A.A. Soares, J. Pereira Junior, A.P.F. Moreira and L. Chiavini, Revista Brasileira de Ensino de Física 43, e20210185 (2021).
- [14] D.A. Smith, The Physics Teacher 61, 591 (2023).
- [15] C. Galeriu, C. Letson and G. Esper, The Physics Teacher 53, 285 (2015).
- [16] F. Önder, E.B. Önder and M. Oğur, The Physics Teacher 57, 244 (2019).
- [17] Q. Zhang, G. Ding, G. Huang and X. Wu, The Physics Teacher 63, 260 (2025).
- [18] O.L.S. Filho and M. Ferreira, Revista Brasileira de Ensino de Física 43, e20200508 (2021).
- [19] O.L.S. Filho, M. Ferreira and R.G.G. de Amorim, Revista Brasileira de Ensino de Física 44, e20190029 (2022).
- [20] M. Redhead, Brit. J. Phil. Set. 31, 145 (1980).
- [21] E.F. Redish, Teaching Physics with the Physics Suite (Wiley, New York, 2003).
- [22] P. Achinstein, Concepts of Science: A Philosophical Analysis (The Johns Hopkins Press, Baltimore, 1968).
- [23] M. Hahn, F. Cruz, P.S. Carvalho, V. Ferreira, F. Marques and C. Macieira, Phys. Educ. 56, 035023 (2021).
-
[24] ARDUINO, Digital input pullup tutorial, available in: https://docs.arduino.cc/tutorials/generic/digital-input-pullup/
» https://docs.arduino.cc/tutorials/generic/digital-input-pullup/ -
[25] TINKERCAD, available in: https://www.tinkercad.com
» https://www.tinkercad.com
Edited by
-
Editor-in-Chief:
Marcello Ferreira https://orcid.org/0000-0003-4945-3169


