
 Assessing the WE-Streck model for predicting leaf emergence in spring wheat
ABSTRACT
Wheat (Triticum aestivum) plays a vital role in global food security. Historical average yields in Brazil are below potential, and increasing wheat yield in Brazil will demand a thorough understanding of basic plant development processes, which can be achieved using process-based crop simulation models. The objective of this study was to calibrate and evaluate the performance of the WE-Streck model for simulating leaf emergence of spring wheat cultivars in the subtropics and tropics of Brazil. Field experiments during four years (2021, 2022, 2023, and 2024) were conducted with 13 wheat cultivars in four locations, three in the state of Rio Grande do Sul and one in the state of São Paulo, in the southern and southwestern regions of Brazil, respectively. The leaf number on the main culm was determined weekly using the Haun Scale until the flag leaf. The non-linear WE-Streck model for leaf appearance originally developed for winter wheat was used. The model was calibrated using a cross-validation approach using three sowing dates in April, May, and June 2021 in Santa Maria city, and model evaluation was with independent data from all other locations and sowing dates. The WE-Streck leaf emergence model had excellent performance in simulating the Haun Stage in spring wheat cultivars with different developmental cycles (from ultra early to late cycles), grown in different environments (subtropical and tropical), and with different N dressing management (timing and sources), with a root mean square error ranging from 0.10 to 0.71 leaves on the main culm.
Key words:
Triticum aestivum; crop modeling; model performance; plant development
HIGHLIGHTS:
Models of leaf development are powerful tools for decision-making in management practices.
The WE-Streck leaf appearance model, developed for winter wheat, was calibrated and evaluated for spring wheat genotypes.
The model performed excellently in different locations, sowing dates, and nitrogen management.
RESUMO
O trigo (Triticum aestivum) desempenha papel central na segurança alimentar global. As produtividades de trigo históricas no Brasil são abaixo do potencial e aumentar a produtividade exigirá compreensão dos processos básicos de desenvolvimento da planta, o que pode ser alcançado com modelos de simulação de culturas baseados em processos. O objetivo neste estudo foi calibrar e avaliar o desempenho do modelo WE-Streck para simular a emissão de folhas em cultivares de trigo de primavera nos subtrópicos e trópicos do Brasil. Experimentos de campo foram conduzidos durante quatro anos (2021, 2022, 2023 e 2024) com 13 cultivares de trigo em quatro locais, três no Estado do Rio Grande do Sul e um no Estado de São Paulo, regiões sul e sudeste do Brasil, respectivamente. O número de folhas no colmo principal foi determinado semanalmente pela Escala de Haun até a folha bandeira. Foi utilizado o modelo não linear WE-Streck para emissão de folhas, originalmente para trigo de inverno. O modelo foi calibrado por validação cruzada usando três datas de semeadura em abril, maio e junho de 2021 em Santa Maria e a avaliação foi com dados independentes dos locais e datas de semeadura. O modelo WE-Streck apresentou excelente desempenho na simulação do Estágio de Haun nas cultivares de trigo de primavera com diferentes ciclos de desenvolvimento (de ultra precoce a tardio), em diferentes ambientes (subtropical e tropical) e manejos de adubação nitrogenada em cobertura (época e fontes), com quadrado médio do erro variando de 0,10 a 0,71 folhas no colmo principal.
Palavras-chave:
Triticum aestivum; modelos de culturas; desempenho do modelo; desenvolvimento de plantas
Introduction
Wheat (Triticum aestivum L.), native to ancient Mesopotamia, holds a central position in global food security, as recognized by the Food and Agriculture Organization of the United Nations (FAO). Together with rice and maize, wheat is a staple food worldwide, accounting for approximately 40% of the calorie intake of humans (FAO, 2020). With projections indicating an increase of two billion people in the global population by 2050, food demand is expected to escalate by 21% (Van Dijk et al., 2021), and wheat will have an even more key role in food security.
The southern region has the largest area under wheat cultivation in Brazil, with Paraná and Rio Grande do Sul being the states with the highest production (approximately 90%). On the other hand, the yield potential for rainfed wheat in South America is 6.7 Mg ha-1 (Stella et al., 2023). In both states, however, the historical average yields of wheat are far below the yield potential of 3.9 Mg ha-1 (IBGE, 2023). Increasing wheat yields in Brazil requires a thorough understanding of basic plant development processes and the ecophysiology of wheat, including the interaction among environment, cultivar, and management.
Process-based crop simulation models are reliable tools for describing complex ecophysiology interactions. When properly calibrated and assessed, these models can assist farmers and consultants in making appropriate management decisions and thus increasing crop yield (Choruma et al., 2019; Zeist et al., 2020; Duarte Junior et al., 2021; Silva et al., 2022). In Brazil, the use of models for various crops of economic importance, such as rice and soybeans, has increased over the last decade (Richter et al., 2019; Meus et al., 2022; Porta et al., 2024).
The number of leaves accumulated on the main culm (NL) is an excellent measure of plant development during the vegetative phase in several crops (Porta et al., 2024). In wheat, the V-Stages of the phenological scale of Zadoks (Zadoks et al., 1974) are based on the expanded NL on the main culm. Furthermore, the phase of leaf appearance from the first to the flag leaf on the main culm overlaps with the reproductive phase. Consequently, the NL in wheat is related to important developmental stages such as a double ridge, onset of tillering, terminal spikelet, and onset of culm elongation, at which major yield components such as the potential number of spikelets and kernels and number of spikes m-2 are defined. Therefore, a model of leaf appearance has practical applications for defining strategies and fine-tuning management practices to achieve high yields in wheat.
The non-linear leaf appearance model of Wang & Engel (1998), hereafter named the WE leaf appearance model, is a very robust and reliable model to simulate the appearance of leaves in wheat (Xue et al., 2004). It is a multiplicative model that considers the effects of environmental factors like air temperature and photoperiod in a non-linear fashion. The WE leaf appearance model was modified by Streck et al. (2003), hereafter named the WE-Streck leaf appearance model, by introducing a chronology response function that considers the effect of seed reserves to account for the faster appearance rate of the first two leaves, and the reduction of leaf appearance rate from the third leaf to the flag leaf due to an increasing distance from the meristem to the whorl for later appearing leaves. Compared to the original WE model, the WE-Streck leaf appearance model improved the simulation of NL, represented by the Haun Stage (Haun, 1973), of winter wheat cultivars in the United States.
In Brazil, however, most wheat cultivars are spring wheat, and their cultivation is expanding to the Brazilian tropics. It is hypothesized that the WE-Streck leaf appearance model can effectively simulate leaf appearance in Brazilian spring wheat cultivars grown both in the subtropics and the tropics of Brazil, despite its initial development for winter wheat in the United States. Therefore, the objective of this study was to calibrate and evaluate the performance of the WE-Streck model for simulating the leaf appearance of spring wheat cultivars in the subtropics and the tropics of Brazil.
Material and Methods
Field experiments for four years (2021, 2022, 2023, and 2024) were conducted with 13 wheat cultivars (Table 1) currently used in commercial fields in Brazil. The experiments were performed at four locations: three in the state of Rio Grande do Sul (RS) and one in the state of São Paulo (SP), in the southern and southwestern regions of Brazil, respectively (Table 1, Figure 1). The cultivars are all spring wheat and exhibit a wide range of developmental cycles, including ultra-early, super-early, early to medium, and late cycles. According to the Köppen classification, the climate of the locations in Rio Grande do Sul is Cfa-type, subtropical humid without a defined dry season and with hot summers. The climate in the location in São Paulo state is Aw-type, tropical with a rainy season in summer and a dry season in winter (Alvares et al., 2013).
Locations, their geographic coordinates (Latitude, Longitude, and Altitude), average minimum and maximum air temperature, wheat cultivars, sowing dates, and Institutions or Farms where experiments with wheat were conducted in the states of Rio Grande do Sul and São Paulo and used in the study
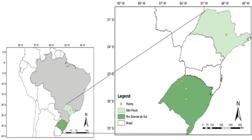
Geographical location of the experiments with wheat conducted in 2021, 2022, 2023, and 2024 in Cerro Largo, Cruz Alta, Santa Maria, and Três de Maio in the Rio Grande do Sul state, and in Piracicaba in the São Paulo state, Brazil, used in the study
Soil management at the sites was conducted using no-tillage practices, and NPK fertilization was applied to achieve a kernel yield of 9 Mg ha-1. The experimental design at Santa Maria/RS, Cerro Largo/RS, Cruz Alta/RS, and Piracicaba/SP was a complete randomized blocks with four replicates. Each plot measured 7.65 m2 (1.53 m × 5 m), with a row spacing of 0.17 m and a sowing density of 150 kg ha-1 of seeds.
Different sowing dates were chosen to expose wheat plants to extreme air temperatures during the developmental cycle. Some dates are within the recommended period for sowing in southern Brazil (from early May to late July), and others are outside the recommended period (Table 1). In Santa Maria/RS, Cerro Largo/RS, Cruz Alta/RS, and Três de Maio/RS, the trials were also conducted on farms (Table 1), with strips placed within the farmers’ wheat fields and following each farmer’s management practices. In the on-farm trials, the row spacing was 0.17 m, and the sowing density ranged from 150 to 180 kg ha⁻¹. For the sowings conducted in January, February, and March 2021 in Santa Maria/RS and the experiment in Piracicaba/SP, irrigation was applied using a sprinkler system to prevent water deficits. All other sowing dates at Santa Maria/RS and the on-farm trials in other locations were rainfed. Irrigation management was monitored by a model considering various criteria such as available water capacity (AWC), temperature, and rainfall. The recommendation was made each time the application indicated that the AWC was less than 80%, with a depth of 10 mm.
The on-farm trial in Santa Maria/RS aimed to evaluate different nitrogen (N) topdressing management strategies (50% of N at the onset of tillering + 50% at culm elongation, 100% of N at the onset of tillering, 100% at culm elongation, and a control with no N application) across five wheat cultivars: ORS Sena, TBIO Calibre, TBIO Trunfo, ORS 1403, and TBIO Ponteiro. The N source was urea (46% N). The trial in the farm at Três de Maio/RS in 2024 was conducted to test different nitrogen (N) sources (0 kg of N, 36 kg of N as urea at the onset of tillering and 36 kg of N as urea at culm elongation, 160 L of UAN 32 + enzyme protectors in sowing, 80 L UAN 32 + enzyme protectors in sowing + 36 kg of N as urea at culm elongation. These two on-farm experiments aimed to provide field data with different N management because this is the main nutritional management practice in wheat and, therefore, will help evaluate the proposed leaf emergency model under important crop management.
Crop emergence was assessed by daily counting of visible plants at the soil surface in one meter of two rows of each plot at the Federal University of Santa Maria (UFSM) and Luiz de Queiroz College of Agriculture (ESALQ/USP) until the final stand was achieved. In these experiments, the date of crop emergence was considered when 50% of the final stand of plants had emerged. In the on-farm trials, the emergence date was determined from photos taken daily by the farmers from the first day plants began to emerge until complete emergence. Then, the date of 50% emergence was determined from these photos. This approach facilitated using technology and the internet to connect research efforts with farmers. One week after emergence, six plants in each plot in the experiments at UFSM and ESALQ/USP and ten plants in the on-farm trials were randomly tagged with colored wires. In the tagged plants, NL on the main culm was determined once or twice a week using the Haun Scale, HS (Haun, 1973) until the flag leaf was visible. The Haun Stage was calculated as Eq. 1:
where:
LN - is the number of expanded leaves on the main culm;
Lult - is the length of the last (ultimate) leaf without the collar on the main culm; and,
Lpnult - is the length of the penultimate (uppermost with collar) leaf on the main culm.
The non-linear WE-Streck model (Streck et al., 2003) for leaf appearance was used in this study. In the WE-Streck leaf appearance model, the number of leaves (NL, leaves per main culm), represented by the Haun Stage (HS) on the main culm, is calculated daily by Eq. 2:
where:
LAR - is the rate of emergence of leaves of a plant in one day (leaves per day);
LARmax1.2 - is a genetic-dependent coefficient that represents the maximum rate of emergence of the first and second leaves (leaves per day);
f(T) - is the LAR response function to air temperature; and,
f(C) - is the chronology response function that causes the LAR to decrease from the third leaf onwards.
The f(T) is calculated using the following version of the beta function (Streck et al., 2003) by Eqs. 3, 4, 5, 6, 7, and 8:
where:
Tmin, Topt, and Tmax - are the cardinal temperatures for leaf appearance and
T - is the air temperature.
For leaf appearance in wheat, the cardinal temperatures for f(T) were Tb = 0 oC, Topt = 22 oC, and TB = 35 oC (Streck et al., 2003).
The chronology response function f(C) is calculated by Eq. 9:
where:
HS - is Haun Stage; and,
b - is the sensitivity coefficient with a value of -0.3 (Streck et al., 2003).
The daily value of the HS is calculated by the accumulation of LAR by Eq. 10:
A cross-validation approach was used to estimate the genetic-dependent coefficient LARmax1.2 of the cultivars TBIO Astro, TBIO Calibre, TBIO Trunfo, TBIO Audaz, TBIO Duque, TBIO Aton, TBIO Toruk and TBIO Ponteiro, using the sowing dates of April, May, and June 2021 in Santa Maria. For the cultivars ORS Senna, ORS Agile, ORS Feroz, ORS Premium, and ORS 1403, the sowing date of June 2022 in Santa Maria/RS was used to calibrate the genetic-dependent coefficient LARmax1.2.
The WE-Streck leaf appearance model was evaluated with independent data from all other locations and sowing dates (Table 1). The statistics used to evaluate the performance of the models were the root mean square error (RMSE), the normalized RMSE (RMSEn), systematic error (MSES) by Eq. 13, and systematic unsystematic (MSEu), the BIAS index by Eq. 15, the agreement index (dw) by Eq. 16, and the Pearson correlation coefficient (r) by Eq. 17.
The RMSE was calculated as follows (Janssen et al., 1995) by Eq. 11:
where:
S - is the simulated HS value;
O - is the observed HS value; and,
n - is the number of observations.
The RMSE ranges from 0 to +∞ with the unit of HS (leaves per plant). The lower the RMSE, the better the model.
The RMSEn is calculated by the following equation (Janssen et al., 1995) by Eq. 12:
where:
Ō - is the mean observed HS.
The lower the MSEn, the better the model.
The systematic (MSES) and unsystematic (MSEu) errors of the model were calculated according to Janssen et al. (1995) by Equations 13 and 14:
where:
The greater the MSEu the better the model. If MSEs is greater than MSEu, this means that the processes represented in the model are still inadequately represented and there are opportunities to improve the model on the basis of knowledge.
The BIAS index was calculated by the following equation (Leite & Andrade, 2002) by Eq.16:
The BIAS index ranges from -∞ to +∞. The closer to 0, the better the model. Negative values mean an underestimation, and positive values mean an overestimation of the model.
The “dw” index is calculated by Borges et al. (2007) by Eq.17:
The dw index ranges from 0 to 1 and evaluates how well the model estimates deviations from the observed means. A value closer to 1 indicates a better model fit.
The Pearson coefficient (r) was calculated according to Borges et al. (2007) by Eq. 18:
where:
Si - are the simulated HS values;
S - is the average of the simulated HS values;
Oi - are the observed HS values; and,
Ō - is the average of the observed HS values.
The r varies from -1 to +1, and the closer to +1, the better the model.
Results and Discussion
A wide range of meteorological conditions as a result of different sowing dates, locations, and nitrogen topdressing managements in the subtropics and tropics of Brazil (Table 1) provided a rich dataset on HS for calibrating and evaluating the WE-Streck leaf appearance model for Brazilian spring wheat cultivars. The results of the calibration of the genetic coefficient LARmax1.2 of the WE-Streck leaf appearance model for the thirteen spring wheat cultivars are presented in Table 2. LARmax1.2 varied from 0.255 leaves per day for cultivar ORS Senna (Ultra early) to 0.292 leaves per day for cultivar ORS Premium (mid/late), indicating some degree of association of LARmax1.2 and developmental cycle for some cultivars.
The performance of the WE-Streck leaf appearance model in simulating the HS of the thirteen cultivars with independent HS data collected in sowing dates for the 2021, 2022, and 2023 growing seasons both in the experiments at UFSM and in the on-farm trials was very good. The RMSE varied from 0.26 to 0.71 leaves on the main culm (Figure 2). The RMSEn ranged from 5.4 to 14.9%, and the MSEu was above 56.6%, indicating excellent model performance. On the June sowing date, the BIAS index ranged from -0.153 for the ORS Premium cultivar to 0.003 for the TBIO Toruk cultivar, indicating high model accuracy. The dw index and the correlation coefficient were close to 1 for all cultivars, indicating very good performance. The graphical analysis of the evaluation of the WE-Streck leaf model with independent data shows points scattered around the 1:1 line for all thirteen spring wheat cultivars (Figure 2). In 2021, the results showed a greater dispersion due to seasonal data outside of the Brazilian Wheat Climate Risk Agricultural Zoning (ZARC), and the model showed excellent performance, which is good for model performance.

Evaluation of the performance of the WE - Streck leaf appearance model in simulating the main culm Haun Stage (HS) of thirteen Brazilian spring wheat cultivars over several growing seasons and locations in Rio Grande do Sul state, Brazil, during the 2001, 2022, and 2023 growing seasons
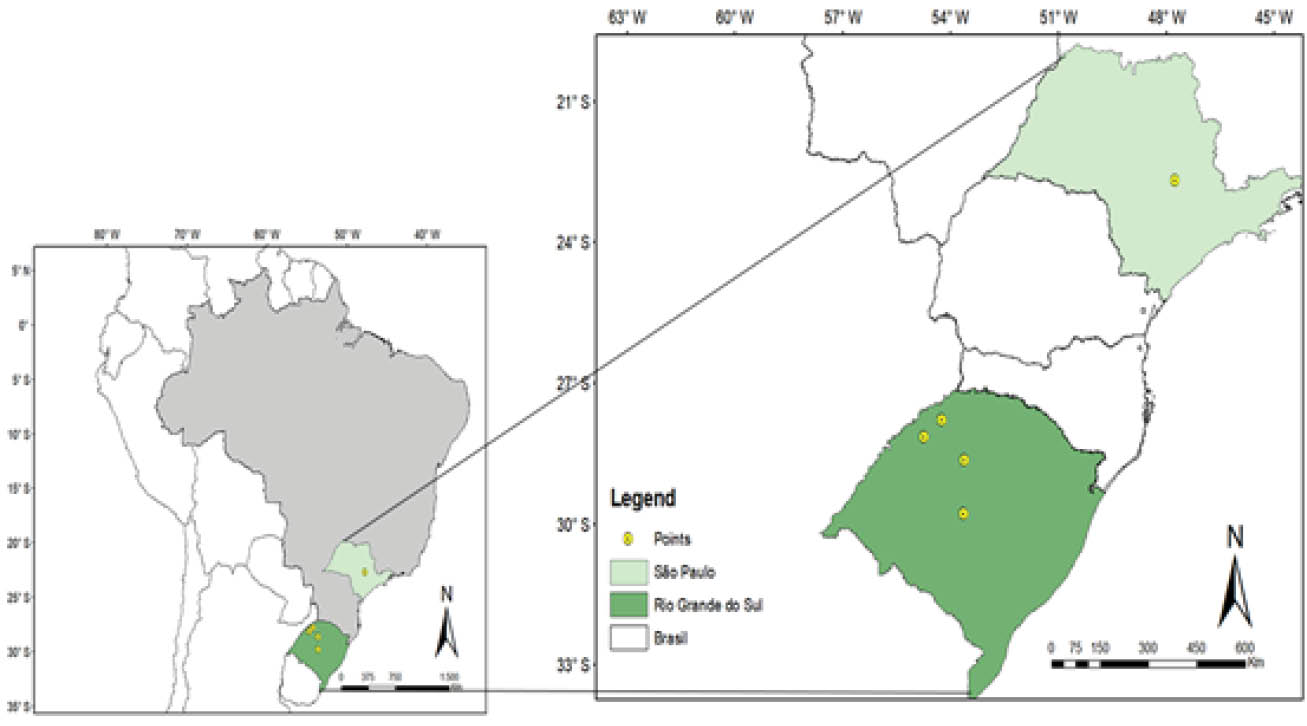
An important aspect of model evaluation is how a model performs under field conditions considering on-farm management practices such as Nitrogen (N) side-dressing. The WE-Streck leaf appearance was run for the on-farm trials with N managements in Santa Maria/RS during the 2023 growing season and in Três de Maio/RS during the 2024 growing season, considering that the calibration of the genetic coefficient LARmax1.2 is not dependent on N management. The model accurately simulated the dynamics of leaf development, represented by the HS on the main culm of five spring wheat cultivars under different Nitrogen side-dressing managements in a farm in Santa Maria/RS in 2023 (Figures 3A to E). When data was pooled, the RMSE was only 0.34 leaves, and other statistical metrics also confirmed the model’s excellent performance (Figure 3F).

The performance of the WE - Streck model in simulating the Haun Stage on the main culm of five wheat cultivars (panels A to E) with different nitrogen (N) topdressing management (50% of N at the onset of tillering + 50% of N at culm elongation, 100% of N at the onset of tillering, 100% of N at culm elongation, control - no N dressing) in a farm during the 2023 growing season in Santa Maria, Rio Grande do Sul state, Brazil
The performance of the WE-Streck leaf appearance model in simulating the HS of the wheat cultivar TBIO Calibre with different N sources as topdressing in a farm in Três de Maio/RS in 2024 was also quite good, with a RMSE varying from 0.23 leaves to 0.31 leaves (Figure 4). Other statistics also indicated satisfactory performance of the model for this on-farm trial. Results from Figures 3 and 4 indicate that a genetic coefficient LARmax1.2 independent of timing and sources of N side-dressing nitrogen can be assumed. This assumption agrees with previous findings that N is a minor factor affecting leaf appearance rate in wheat, i.e., there is only affects leaf appearance rate when N is at extremely low levels (Wilhelm & McMaster, 1995).
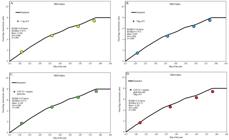
The performance of the WE-Streck leaf appearance model in simulating the Haun Stage on the main culm of wheat cultivar TBIO Calibre with different N sources of N as dressing in a farm in 2024 in Três de Maio, Rio Grande do Sul state, Brazil
Wheat cultivation in Brazil is expanding to the tropics. The WE-Streck leaf appearance model accurately simulated the HS of three spring wheat cultivars (TBIO Calibre, TBIO Duque, and TBIO Atos) in the tropics of Brazil, in Piracicaba, SP (Figure 5). The RMSE was 0.37 leaves for TBIO Calibre, 0.23 leaves for the TBIO Duque, and 0.21 leaves for TBIO Aton. When pooling all data together, the RMSE was only 0.32 leaves and other statistics, confirming the excellent performance of the WE-Streck leaf appearance model in the tropics of Brazil.
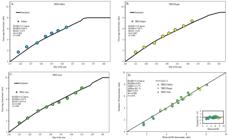
The performance of the WE-Streck leaf appearance model in simulating the Haun Stage on the main culm of three wheat cultivars (panels A to D) in the 2023 growing season in Piracicaba, São Paulo state, Brazil
The performance of the WE-Streck leaf appearance model for winter wheat in the USA showed a RMSE ranging from 0.1 to 0.6 leaves (Streck et al., 2003). In this study, the RMSE ranged from 0.10 to 0.71 for spring wheat (Figures 2, 3, 4, 5), indicating excellent performance among various cultivars (ultra early to late cycles), environments (subtropical and tropical), and N dressing managements (timing and sources). Other models have predicted HS in wheat with a RMSE of about 1.0 leaves (Jamieson et al., 1995, 1998). In rice, a Poaceae similar to wheat in plant morphology, the WE-Streck leaf appearance model predicted the main culm HS with a RMSE ranging from 0.6 to 0.9 (Streck et al., 2008), from 0.6 to 1.9 leaves (Ribas et al., 2017), and more recently from 0.4 to 0.8 leaves (Poersch et al., 2024). These results confirm the robustness of the WE-Streck leaf appearance model in simulating the number of leaves represented by HS in both wheat and rice.
A model that accurately simulates the dynamics of leaf appearance in different environments (Figures 2 and 5) and on-farm conditions (Figures 3 and 4) is a powerful tool for helping farmers and consultants identify major factors causing yield gaps and fine-tune management to close these gaps. In wheat, the V-Stage of the phenological scale of Zadoks (Zadoks et al., 1974) is based on the expanded LN, which can easily be derived from the Haun Scale. Furthermore, in wheat, the phase of leaf appearance from the first to the flag leaf on the main culm overlaps partially with the productive phase (from double ridge to anthesis). Therefore, the HS in wheat is related to important developmental stages such as a double ridge, terminal spikelet, and the onset of culm elongation, where yield components such as the potential number of spikelets and kernels are defined (Zadoks et al., 1974). In addition, a reliable leaf appearance model is also important to define the timing of the flag leaf appearance. An example is the SimulArroz model, where the WE-Streck leaf appearance model simulates the HS on the main culm and runs in parallel with the developmental model responsible for the “rice clock” (Poersch et al., 2024). On the day of the R1 stage (panicle differentiation), the rice clock submodel informs the WE-Streck model that three leaves are yet to emerge before the flag leaf. This unique approach is novel for intrinsically resolving the flag leaf’s appearance.
Using intrinsic approaches to resolve plant processes and the fact that the WE-Streck leaf appearance model here, calibrated and evaluated, worked very well for 13 spring wheat cultivars is the first step for developing a Brazilian process-based model for simulating wheat development, growth, and yield. This model will be very important as a tool in different studies and also for practical applications for farmers.
Conclusions
-
The WE-Streck leaf appearance model has excellent performance in simulating the main culm Haun Stage of spring wheat cultivars of different developmental cycles (ultra early to late cycles), grown in different environments (subtropical and tropical), and with different Nitrogen topdressing management (timing and sources), with a root mean square error ranging from 0.10 to 0.71 leaves on the main culm.
-
The WE-Streck leaf appearance model here, calibrated and evaluated for spring wheat cultivars, is a powerful tool for helping farmers and consultants identify major factors causing yield gaps and for fine-tuning management practices to close these gaps.
Acknowledgments
To the farmers for allowing us to set up the experiments and collect the data on their farms; to the CNPq and CAPES for grants, the Colégio Politécnico (UFSM) for providing the experimental area; to Dr. Giovani Facco for providing the seeds and technical support for management; to João Victor Ferro at ESALQ/USP and the FieldCrops Team at UFSM for helping in collecting field data, and to the Crops Team Knowledge on-farm for assisting in field trips.
Literature Cited
-
Alvares, C. A.; Stape, J. L; Sentelhas, P. C.; Gonçalvez, J. L. M. Köppen’s climate classification map for Brazil. Meteorologische Zeitschrift, v.22, p.711-728, 2013. https://doi.org/ 0941-2948/2013/0507
» https://doi.org/ 0941-2948/2013/0507 -
Borges, A. C.; Mendiondo, E. M. Comparação entre equações empíricas para estimativa da evapotranspiração de referência na Bacia do Rio Jacupiranga. Revista Brasileira de Engenharia Agrícola Ambiental, v.11, p.293-300, 2007. https://doi.org/10.1590/S1415- 43662007000300008
» https://doi.org/10.1590/S1415- 43662007000300008 -
Choruma, D. J.; Balkovic, J.; Odume, O. N. Calibration and validation of the EPCIC model for maize production in the Eastern Cape, South Africa. Agronomy, v.9, e494, 2019. https://doi.org/10.3390/agronomy9090494
» https://doi.org/10.3390/agronomy9090494 -
Duarte Junior, A.; Streck, N.; Zanon, A.; Ribas, G. G.; Silva, M.; Cera, J.; Nascimento, M.; Pilecco, I.; Puntel, S. Rice yield potential as a function of sowing date in Southern. Agronomy Journal, v.113, p.1-12, 2021. https://doi.org/10.1002/agj220610.20610
» https://doi.org/10.1002/agj220610.20610 -
FAO - Food and Agriculture Organization of the United Nations Trade and markets. 2020. Available at http://www.fao.org/economic/est/publications/rice-publications/en/
» http://www.fao.org/economic/est/publications/rice-publications/en/ - Haun, J. R. Visual quantification of wheat development. Agronomy Journal, v.65, p.116-119, 1973.
-
IBGE - Instituto Brasileiro de Geografia e Estatística: municipal Agricultural Production 2022. on: < on: https://www.ibge.gov.br/en/statistics/economic/agriculture-forestry-and-fishing/16773-municipal-agricultural-production-temporary-and-permanent-crops.html?edicao=31814 >. Acessed on: dez 2023
» https://www.ibge.gov.br/en/statistics/economic/agriculture-forestry-and-fishing/16773-municipal-agricultural-production-temporary-and-permanent-crops.html?edicao=31814 - Jamieson, P. D.; Brooking, I. R.; Semenov, M. A.; Porter, J. R. Making sense of wheat development: a critique of methodology. Field Crops Research, v.55, p.117-127, 1998.
-
Janssen, P. H. M.; Heuberger, P. S. C. Calibration of process-oriented models. Ecological Modelling, v.83, p.55-56, 1995. https://doi. org/10.1016/0304-3800(95)00084-9
» https://doi. org/10.1016/0304-3800(95)00084-9 - Leite, H. G.; Andrade, V. C. L. Um método para condução de inventários florestais sem o uso de equações volumétricas. Revista Árvore, v.26, p.321-328, 2002.
-
Meus, L. D.; Quintero, C. E.; Ribas, G. G.; Silva, M. R. da; Streck, N. A.; Alberto, C. M.; Zamero, M. de L. Á. A.; Zanon, A. J. Evaluating crop models to assess rice yield potential in Argentina. Crop and Environment, v.1, p.182-188, 2022. https://doi.org/10.1016/j.crope.2022.08.002
» https://doi.org/10.1016/j.crope.2022.08.002 -
Poersch, H. A.; Streck, N. A.; Heinemann, A. B.; Steinmetz, S.; Zanon, A. J.; Silva, M. R.; Rossato, I. G. Calibration and evaluation of new irrigated rice cultivars in the SimulArroz model. Revista Brasileira de Engenharia Agrícola e Ambiental, v.28, e272761, 2024. http://dx.doi.org/10.1590/1807-1929/agriambi.v28n5e272761
» http://dx.doi.org/10.1590/1807-1929/agriambi.v28n5e272761 -
Porta, D. S. F.; Streck, N. A.; Alberto, C. M.; Silva, M. R.; Tura, E. F.; Uliana, G. F.; Tagliapietra, E. L.; Alves, A. F.; Winck, J. E. M.; Soares, M. F.; Zanon, A. J. Improving understanding of the plastochron of determinate and indeterminate soybean cultivars. Revista Brasileira de Engenharia Agrícola e Ambiental , v.28, e278299, 2024. http://dx.doi.org/10.1590/1807-1929/agriambi.v28n10e278299
» http://dx.doi.org/10.1590/1807-1929/agriambi.v28n10e278299 -
Ribas, G. G.; Streck, N. A.; Duarte Junior, A. J.; Nascimento, M. F.; Zanon, A. J.; Silva, M. R. Number of leaves and phenology of rice hybrids simulated by the SimulArroz model. Revista Brasileira Engenharia Agrícola e Ambiental, v.21, p.221-226, 2017. https://doi.org/10.1590/ 1807-1929/agriambi.v21n4p221-226
» https://doi.org/10.1590/ 1807-1929/agriambi.v21n4p221-226 -
Richter, G. L.; Streck, N. A.; Zanon, A. J.; Ulguim, A. da R.; Kruse, N. D.; Santos, G. A. de A. dos; Cera, J. C.; Ribas, G. G.; Duarte Junior, A. J.; Pilecco, I. B. Introducing rice yield loss caused by weed competition into the SimulArroz model. Pesquisa Agropecuária Brasileira, v.54, e01418, 2019. https://doi.org/10.1590/S1678-3921.pab2019.v54.01418
» https://doi.org/10.1590/S1678-3921.pab2019.v54.01418 -
Silva, M. R.; Streck, N. A.; Cera, J. C.; Duarte Junior, A. J.; Ribas, G. G.; Rossato, I. G.; Meus, L. D.; Pereira, V. F.; Pilecco, I. B.; Benedetti, R. P.; Tonetto, F.; Zanon, A. J. Forecasting the rice yield in Rio Grande do Sul using the SimulArroz model. Pesquisa Agropecuária Brasileira , v.57, e02069, 2022. https://doi.org/10.1590/S1678-3921.pab2022.v57.02069
» https://doi.org/10.1590/S1678-3921.pab2022.v57.02069 -
Stella, T.; Webber, H.; Rezaei, E. E.; Asseng, S.; Martre, P.; Dueri, S.; Guarin, J. R.; Pequeno, D.; Calderini, D. F.; Reynolds, M. Wheat crop traits conferring high yield potential may also improve yield stability under climate change. In Silico Plants, v.5, p.1-16, 2023. https://doi.org/10.1093/insilicoplants/diad013
» https://doi.org/10.1093/insilicoplants/diad013 - Streck, N. A.; Weiss, A.; Baenziger, P. S.; Xue, Q. Incorporating a chronology response function into the prediction of leaf appearance rate in winter wheat. Annals of Botany, v.92, p.181-190, 2003.
-
Streck, N. A.; Lago, I.; Gabriel, L. F.; Samboranha, F. K. Simulating maize phenology as a function of air temperature with a linear and a nonlinear model. Pesquisa Agropecuária Brasileira , v.43, p.449-455, 2008. https://doi.org/10.1590/S0100-204X2008000400002
» https://doi.org/10.1590/S0100-204X2008000400002 - Streck, N. A.; Weissb, A.; Xue, P.; Baenzigner, S. P. Improving predictions of developmental stages in winter wheat: a modified Wang and Engel model. Agricultural and Forest Metereology, v.115, p.139-150, 2003.
-
Van Dijk, M.; Morley, T.; Rau, M. L.; Saghai, Y. A meta-analysis of projected global food demand and population at risk of hunger for the period 2010-2050. Nature Food, v.2, p.494-501, 2021. https://doi.org/10.1038/s43016-021-00322-9
» https://doi.org/10.1038/s43016-021-00322-9 - Wilhelm, W. W.; McMaster, G. S. Importance of the phyllochron in studying development and growth in grasses. Crop Science, v.35, p.1-3, 1995.
- Wang, E.; Engel, T. Simulation of phenological development of wheat crops. Agricultural Systems, v.58, p.1-24, 1998.
-
Xue, Q.; Weiss, A.; Baenziger, P. S. Predicting leaf appearance in field-grown winter wheat: Evaluating linear and non-linear models. Ecological Modelling , v.175, p.261-270, 2004. https://doi.org/10.1016/j.ecolmodel.2003.10.018
» https://doi.org/10.1016/j.ecolmodel.2003.10.018 - Zadoks, J. C.; Chang, T. T.; Konzak, C. F. A decimal code for the growth stages of cereals. Weed research, v.14, p.415-421, 1974.
-
Zeist, A. R.; Resende, J. T. V.; Zanin, D. S.; Silva, I. R. L.; Silva, D. F.; Alberto, C. M. Gabriel, A.; Garcia Neto, J. Plastochron and yield of Physalis peruviana L. grown in different environments and transplanting dates. Semina: Ciências Agrárias, v.41, p.1151-1164, 2020. https://doi.org/10.5433/1679-0359.2020v41n4p1151
» https://doi.org/10.5433/1679-0359.2020v41n4p1151
Financing statement
There are no supplementary sources.

 RMSE - Root mean square error; RMSEn - Normalized root mean square error; MSEs - Systematic error; MSEu - Systematic unsystematic; Bias - BIAS index; dw - Agreement index; r - Pearson correlation coefficient. Each panel represents one cultivar and displays the statistics RMSE, RMSEn, MSEs, MSEu, Bias, dw, and r to evaluate the model’s performance with independent Haun Stage data
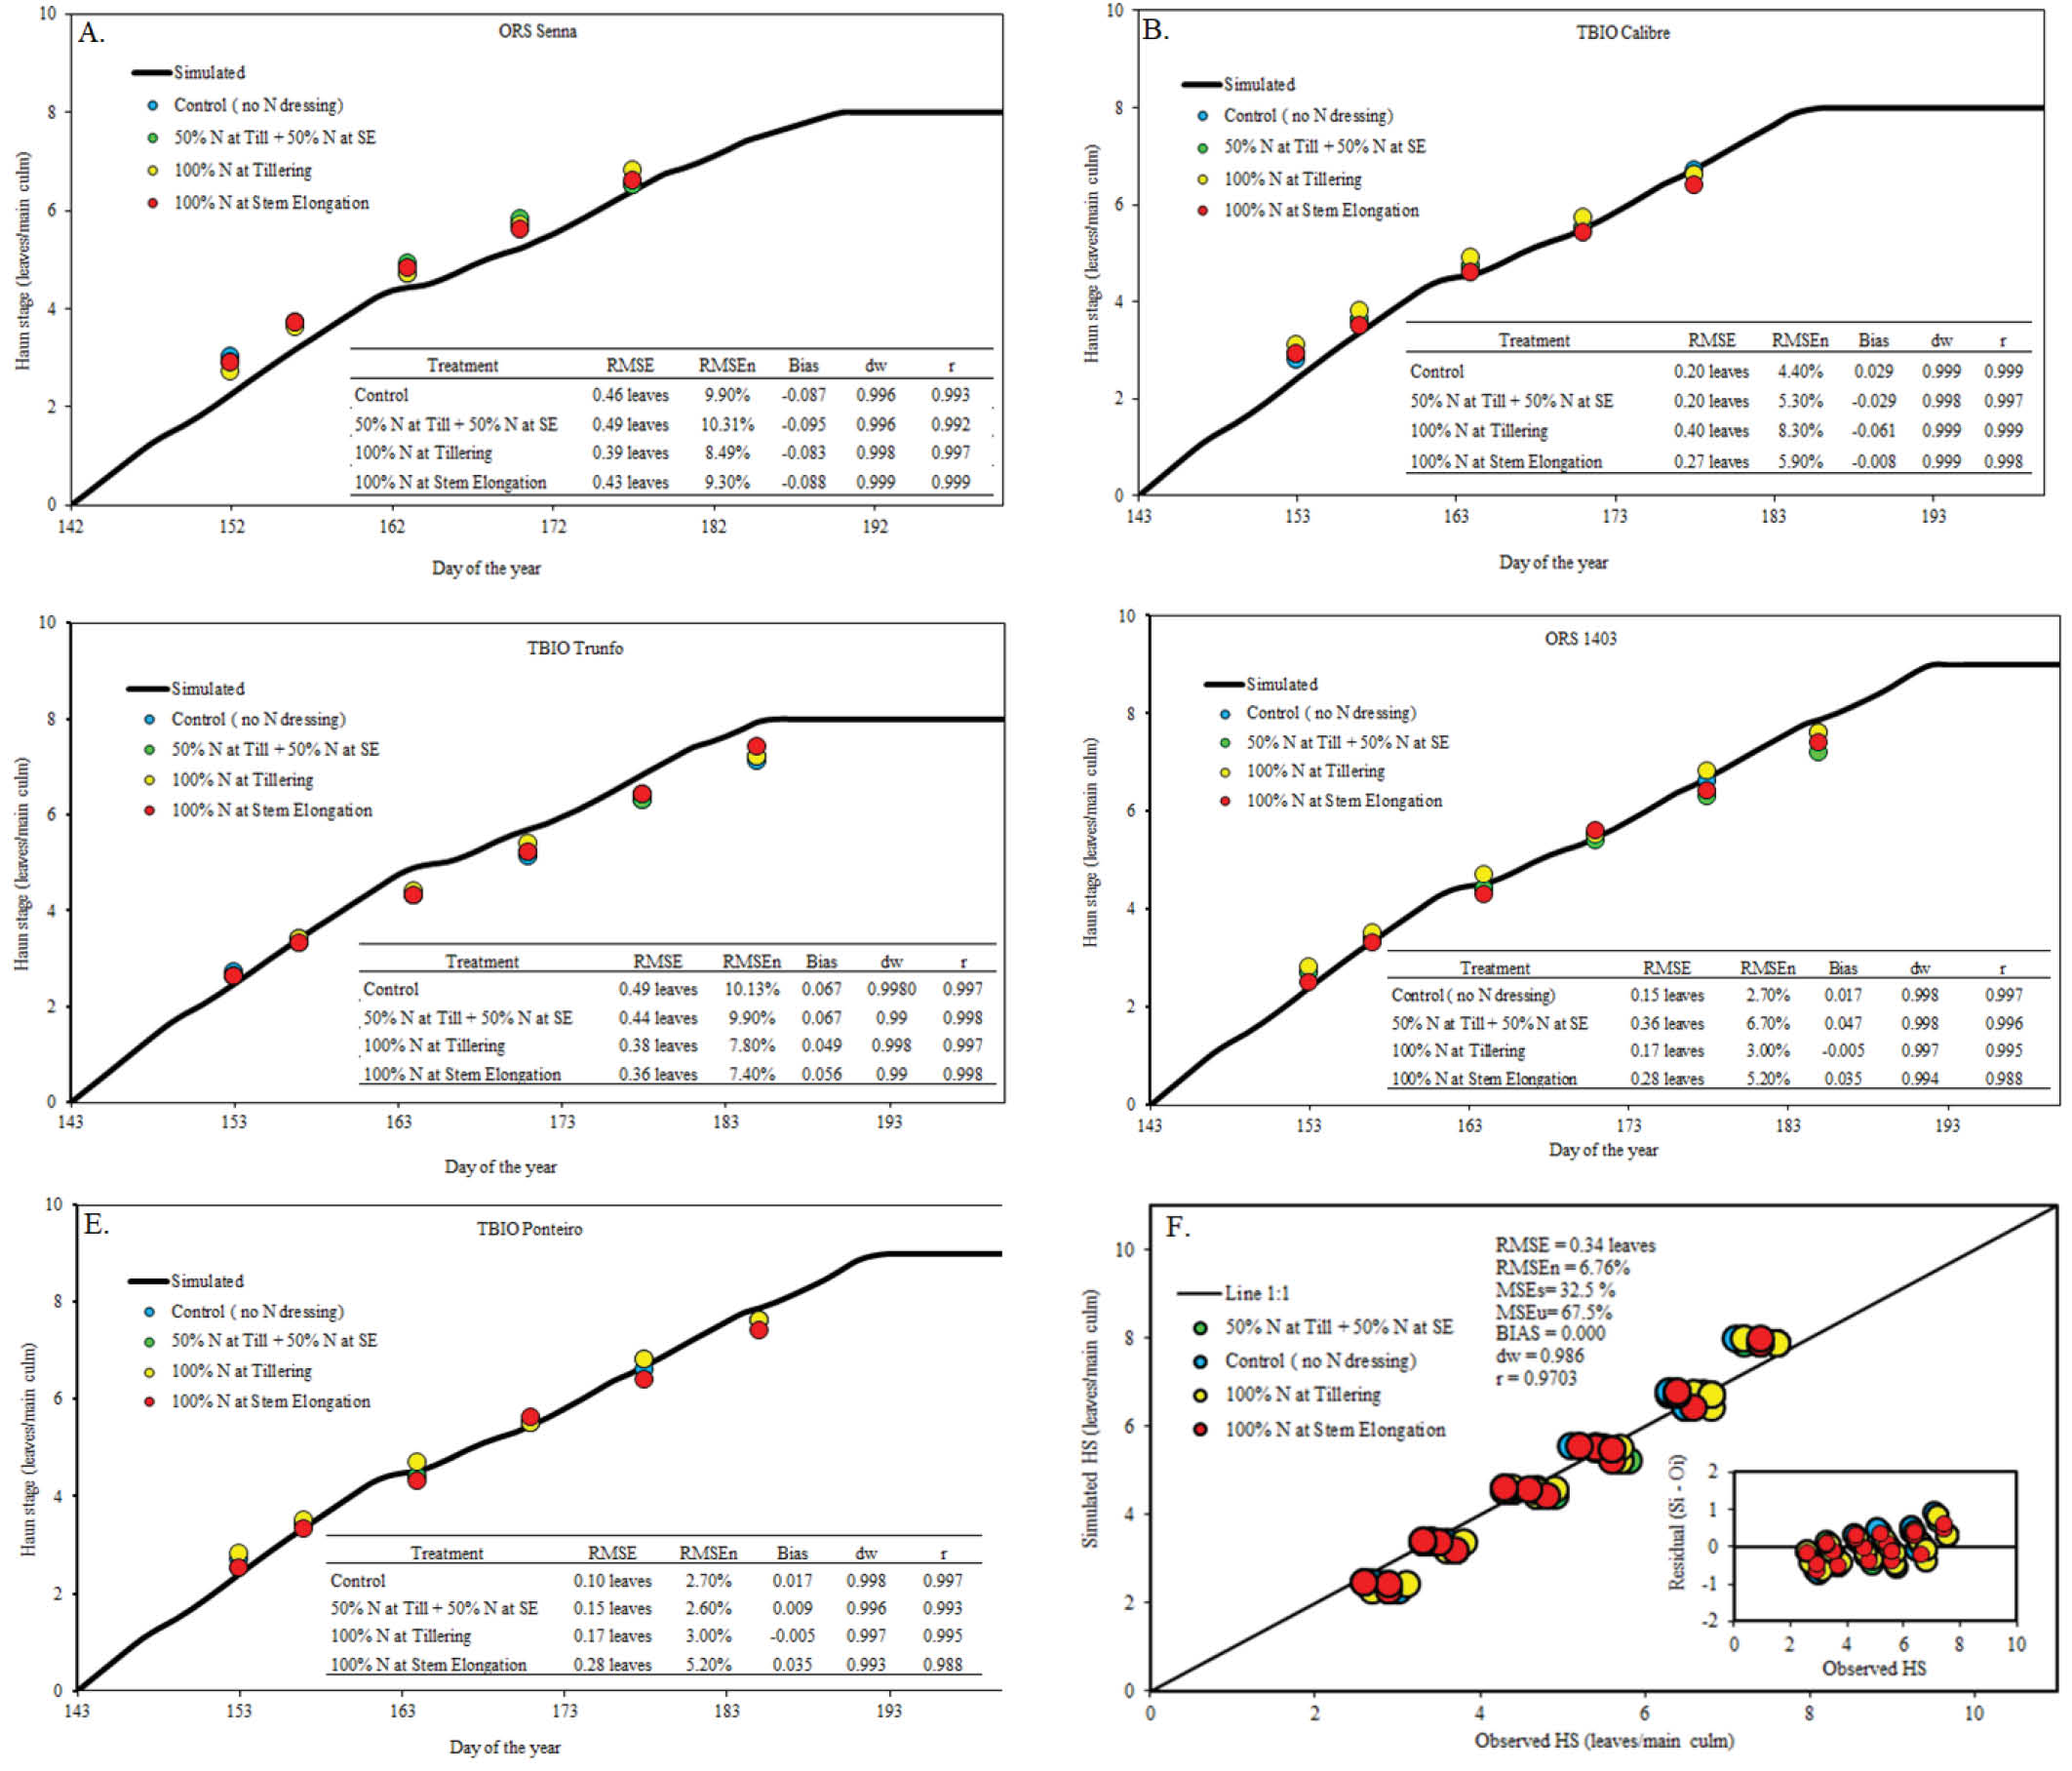 RMSE - Root mean square error; RMSEn - Normalized root mean square error; MSEs - Systematic error; MSEu - Systematic unsystematic; Bias - BIAS index; dw - Agreement index; r - Pearson correlation coefficient. Each panel represents a cultivar and displays the statistics RMSE, RMSEn, MSEs, MSEu, Bias, dw, and r to evaluate the model’s performance with independent Haun Stage data. Data of cultivars and N managements are pooled in panel F
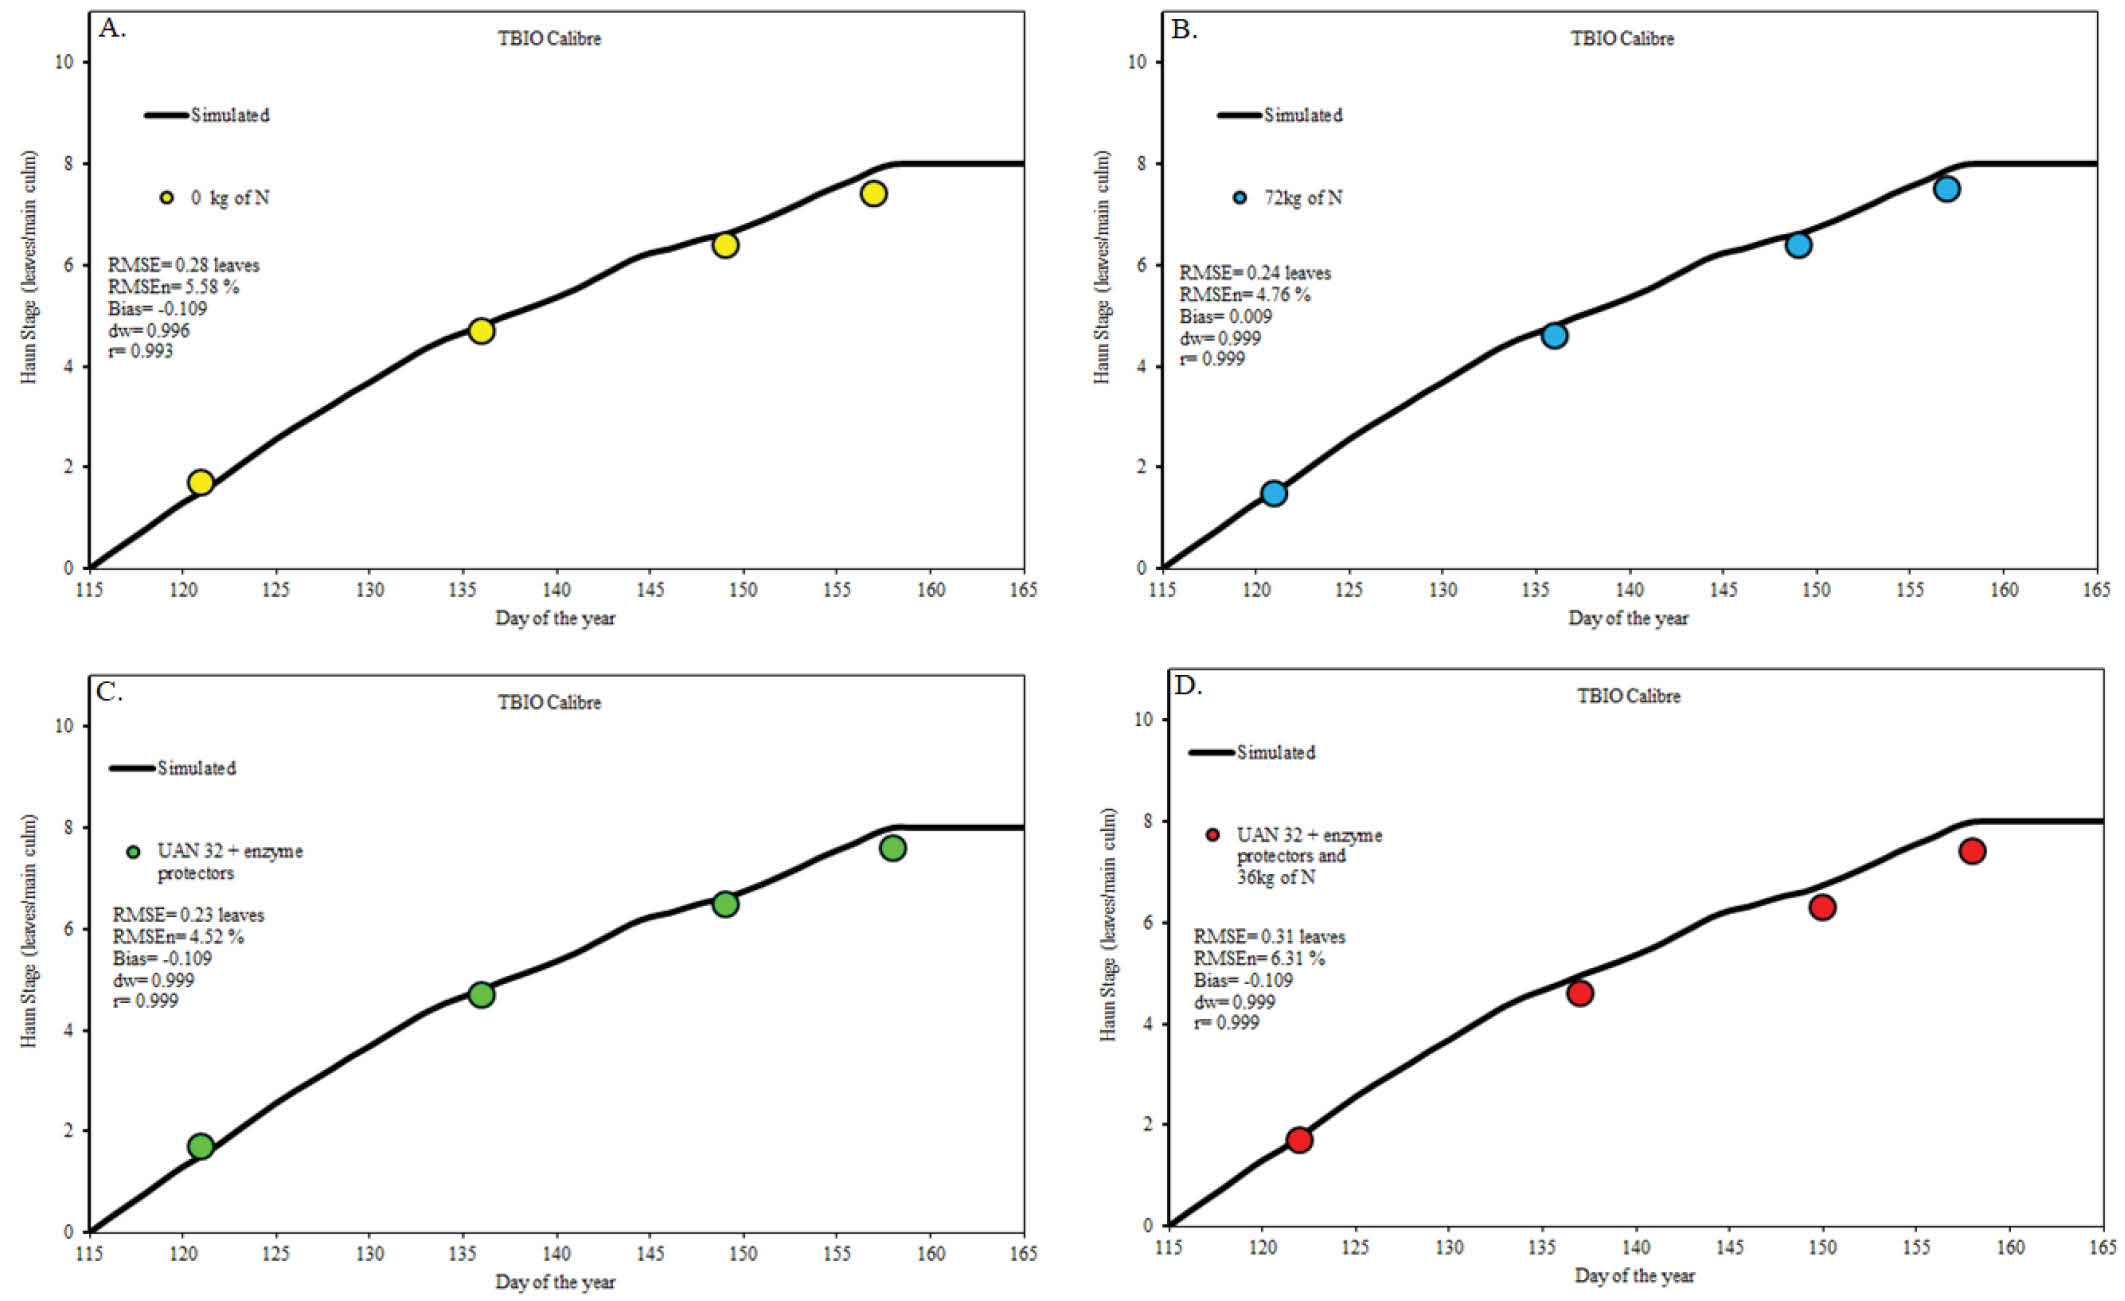 RMSE - Root mean square error; RMSEn - Normalized root mean square error; Bias - BIAS index; dw - Agreement index; r - Pearson correlation coefficient. Each panel represents a different nitrogen source as dressing and displays the statistics RMSE, RMSEn, Bias, dw, and r to evaluate the model’s performance with independent Haun Stage data
 RMSE - Root mean square error; RMSEn - Normalized root mean square error; MSEs - Systematic error; MSEu - Systematic unsystematic; Bias - BIAS index; dw - Agreement index; r - Pearson correlation coefficient. Each panel represents a cultivar and displays the statistics RMSE, RMSEn, MSEs, MSEu, Bias, dw, and r to evaluate the model’s performance with independent Haun Stage data