
 Plastic coverings on the environment of agricultural greenhouses
ABSTRACT
Adequate thermal comfort for plant growth in protected environments is associated with properties of translucent coverings. This study investigated the influence of three types of plastic films (diffuser, transparent, and milky) at three agricultural greenhouses in Fortaleza city, CE, Brazil. The objective of this study was to analyze air temperature and relative air humidity conditions, seeking recommendations to optimize plant growth performance in greenhouses. Ten monitoring stations were distributed, three for each plastic covering and one external; readings were taken 2 m above the ground level, using temperature and relative air humidity sensors (SHT31). Data were collected from July 11 to July 27, 2023, with readings every 5 min (totaling 12 readings per hour) and subsequently processed through linear regression. The tested coverings resulted in different temperature and relative air humidity during early morning hours (1 and 5%). The comparison between diffuser and transparent, and diffuser and milky films showed differences at 5 and 1%, respectively, while transparent and milky films did not show differences. The diffuser film exhibited lower temperature variations throughout a 12-hour period. The diffuser covering provided the lowest temperatures and smaller variations throughout the day, which was significantly different from milky and transparent films during warmer hours. These results provide valuable information for optimizing conditions in agricultural greenhouses, contributing to sustainable and efficient practices in protected cultivation.
Key words:
IoT; real-time monitoring; protected cultivation; agricultural meteorology
HIGHLIGHTS:
Transparent and milky films resulted in higher temperatures (45 °C).
The diffuser film resulted in lower temperature and relative air humidity.
Transparent and milky coverings promote in higher temperature and lower relative air humidity during the hottest times of the day.
RESUMO
O conforto térmico adequado para o cultivo de plantas em ambientes protegidos está intrinsecamente ligado às propriedades das coberturas translúcidas. Este estudo investigou a influência de três tipos de filmes plásticos (difusor, transparente e leitoso) em três estufas agrícolas em Fortaleza, CE. O objetivo foi analisar as condições de temperatura e umidade relativa do ar, buscando recomendações para otimizar o desempenho das estufas. Dez estações de monitoramento foram distribuídas, três para cada cobertura plástica e uma externa; as leituras foram coletadas a 2 m de altura sendo equipadas com sensores de temperatura e umidade relativa do ar (SHT31). A coleta de dados ocorreu de 11 a 27 de julho de 2023, com leituras a cada 5 min (totalizando 12 leituras por hora), tratadas posteriormente por regressão linear. Diferenças significativas nas madrugadas (1 e 5%) entre as coberturas para temperatura e umidade relativa do ar foram observadas. Comparando os filmes, difusor × transparente e difusor × leitoso mostraram diferenças a 5 e 1%, respectivamente, enquanto transparente x leitoso não apresentaram diferenças. Durante o período das 12 horas, o filme difusor exibiu menores variações de temperatura. Conclui-se que a cobertura difusora proporcionou as menores temperaturas e menores variações ao longo do dia, sendo estatisticamente diferente dos filmes leitoso e transparente nos horários mais quentes. Esses resultados oferecem percepções cruciais para otimizar as condições em estufas agrícolas, contribuindo para práticas eficientes de cultivo protegido.
Palavras-chave:
IoT; monitoramento em tempo real; cultivo protegido; meteorologia agrícola
Introduction
Brazil has large territorial area and significant climate diversity. Thus, the use of protected environments is an important technique to enhance agricultural production in the country. These environments allow for the control of essential climatic factors, such as temperature, relative air humidity, solar radiation, and wind, although they require substantial investment in energy and infrastructure (Rebouças et al., 2015; Mishra et al., 2023). Controlling these variables is essential for increasing the volume and quality of cultivated products.
Additionally, the materials and technologies used in greenhouses allow for the passive manipulation of incident sunlight, promoting the transmission of an ideal light spectrum for crop growth (Feng et al., 2024; Shi et al., 2024). Such a practice not only increases crop yields but also facilitates the management of the internal microclimate of agricultural greenhouses, resulting in reduced energy consumption (Mishra et al., 2023).
According to Jamil et al. (2022), technology advancements allow for safe monitoring and surveying of agricultural practices based on informed decisions, ensuring greater efficiency and positive outcomes in the field. For example, Subahi & Bouazza (2020) developed an Internet of Things (IoT)-based system to control and monitor temperature in agricultural greenhouses, demonstrating the potential of these technologies to improve agricultural practices.
Constant monitoring of growing conditions is essential to assess and choose the best practices, such as the material used and height to grow the plants, since air temperatures in plastic greenhouses can vary significantly vertically (Li et al., 2022; Chen & Yin, 2024; Li et al., 2024). These thermal fluctuations can cause severe production losses and compromise product quality (Oliveira et al., 2023).
Thermal fluctuations are more intense during the hottest hours of the day. Li et al. (2024) observed that the difference between the air temperature near the plastic surface and inside the greenhouse peaked at 13.3 °C at 12:00h., whereas the difference was only 2 °C at 9:00h.
Climate variations throughout the day affect crop development in different ways. Several factors, including wind and high temperature fluctuations, can result in significant production losses and compromise product quality (Oliveira et al., 2023; Kim et al., 2024).
In this context, the objective of this study was to investigate and correlate microclimatic effects of different plastic films in protected environments for understanding their implications in agricultural production.
Material and Methods
The study was conducted at the experimental area of the Hydraulics and Irrigation Laboratory of the Department of Agricultural Engineering of the Federal University of Ceará (UFC), Pici campus, Fortaleza city, CE, Brazil (3° 45’ S, 38° 33’ W, and altitude of 19 m) (Figure 1). The region’s climate was classified as Aw, according to the classification of Köppen (1918).

The data collection stations were developed at the Laboratory of Electronic and Agricultural Mechanics (LEMA). Ten stations were build using 32 mm diameter PVC pipes for sensor installation (Figure 2). These stations were placed inside and outside the greenhouse to record climate variations throughout the days.

Outdoor data collection station with four sensors installed at heights of 1, 2, 3, and 4 m above the ground level
The data collection stations (Figure 3) were strategically distributed with the following configuration: each station was equipped with four temperature and relative air humidity sensors (SHT 31), positioned at heights of 1, 2, 3, and 4 m in the central station, and at heights of 1, 2, and 3 m in the side stations.

Distribution of data collection stations for greenhouses covered with diffuser, transparent, and milky films
Three collection stations were installed at each greenhouse, totaling nine stations across the three greenhouses. All stations had sensors positioned at heights of 4 and 3 m.
The location of the side stations had a lower ceiling height; thus, the sensors were positioned at heights of 1, 2, and 3 m, totaling three sensors per station. Data were obtained from an ESP32 board connected to sensors via wires inside tubes and written to a Google Sheet spreadsheet in the cloud and in a Secure Digital Card (SD card).
The use of sensors to measure temperature and relative air humidity, as recommended by the World Meteorological Organization (WMO, 2008), requires a protective shield for these sensors from direct exposure to solar radiation. Thus, protective shields with dimensions of 32 mm at the top and 74 mm at the bottom were built to prevent direct sunlight incidence on external and internal sensors (Figure 4).

Temperature and relative air humidity were monitored using a SHT31 sensor (Sensirion). This sensor features a I2C communication, a technology that utilizes dual-sensing condensation (dew point) and digital communication configurations; thus, temperature and relative air humidity values are processed internally (Sensirion, 2023).
I2C (Inter-Integrated Circuit) communication is a type of synchronous communication protocol used for intercommunication between various devices (Oliveira, 2017; Sparkfun, 2023). This type of communication is bidirectional, allowing communication between microcontrollers or between “master” and “slave” devices using only two communication lines: one is the Serial Data Line (SDA) and the other is the Serial Clock Line (SCL). This communication between multiple devices is a significant advantage over other protocols such as UART and SPI (Oliveira, 2017; TOPGADGET, 2023).
The sensor used in the research has an accuracy of approximately 2% for relative air humidity. Its operational range varies from 0 to 100%, and its response time for relative air humidity is 8 s, according to the manufacturer (Sensirion, 2023). Its voltage ranges from 2.15 to 5.5 V, and the average supplied current is 1.7 µA. Its advantages include low power consumption and compact size, making it widely used for academic works (Hernández-Morales et al., 2022).
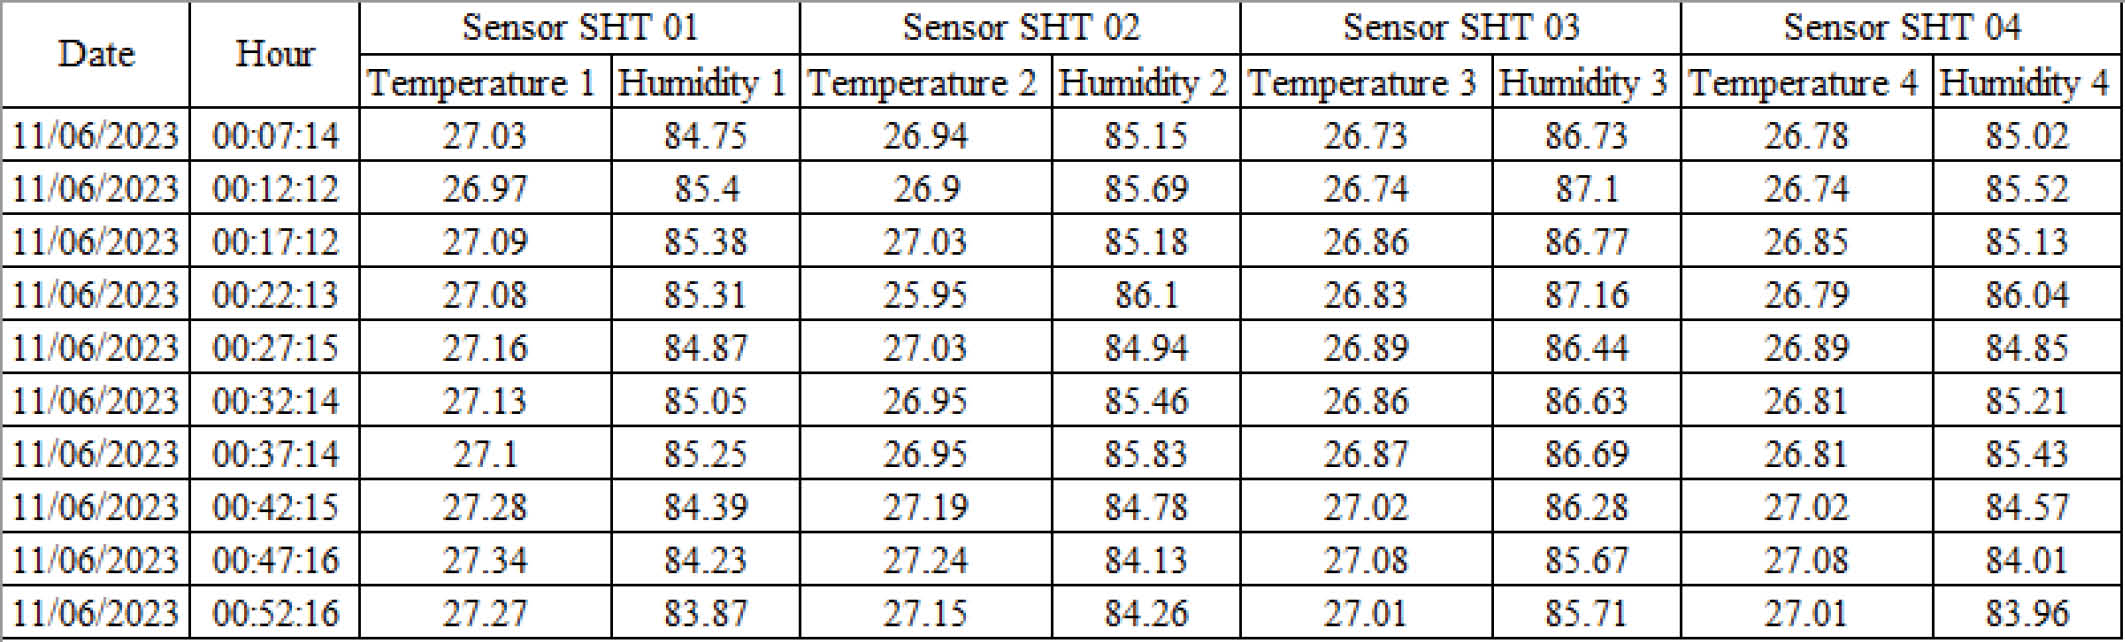
Data collection boards were composed of an ESP32 responsible for data collection, code processing, and data transmission to the cloud, a micro-SD memory card, a SdCard module for data storage, and a multiplexer responsible for connecting to the sensors of the data collection station (PCD) and sending data to the ESP32. The circuit boards were development as shown in Figure 5, which includes an ESP32 board, a multiplexer, a SdCard, and a battery. Subsequently, connections were made to each output and input pin.

After the development and assembly of boards, a programming language in Javascript was created, along with an online Google Sheets spreadsheet (Figure 6).

Spreadsheet used for registration and cloud storage of temperature and relative air humidity data
A plastic box with dimensions of 36.0 × 27.0 cm was used to protect the circuit board that receive the data generated by the sensors (Figure 7).

The box was internally equipped with an ESP32 microcontroller responsible for programming, and wi-fi and Bluetooth connectivity; a RTC module with real-time clock; a SD card module used for data storage; and a T29548A I2C multiplexer with 1 to 8 channels to allow connections of more sensors. The system was powered by a 12 V battery connected to a solar panel responsible for charging the battery. Figure 8 illustrates the components used for the circuit board (PCB).

SDC Module (A), RTC Module (B), SHT 31 Sensor (C), ESP32 Wroom-32 Devkit V1 (D), and T29548A I2C Multiplexer (E)
The three plastic coverings evaluated were made of low-density polyethylene diffuser, milky, and transparent films. According to specialized companies in plastic films for protected environments, such as Tropical Estufas, Paperplast (2023), and Oliveira (2024), the plastic films have the following characteristics:
Diffuser Film M36 Clean: diffuser film that have thermal properties that provide uniform light distribution, a thickness of 150 microns, 70% diffuse light, and 85% transmissivity. Milky film GINEGAR Imported 120 microns: milky film that have a thickness of 120 microns and features UV protection. According to Katsoulas et al. (2020), when a plastic material absorbs ultraviolet radiation, it is referred as anti-UV.
Extra Long Life Transparent Film: Transparent plastic film that have a thickness of 150 microns, allowing 100% UV transmission (without anti-UV protection). Side Screens Used in Greenhouses: the side screen used in the greenhouses was a Lahuman anti-aphid 50-mesh screen.
The experiment involved the construction of three independent greenhouse modules, with a fixed height of 3 m and an arch radius of 1.5 m, totaling a height of 4.5 m. Metal bars of 60 × 40 × 2 mm were used to separate the modules, which were welded and cut to reach 7 m in width and 4 m in length.
Figure 9A illustrates the greenhouse model used as a base for the installation of the coverings. Figure 9B shows the three models with dimensions of 7 × 4 m and a height of 3 m that were used in the experiment.

Greenhouse used as a base for the assembly of independent modules (A) and separation of the three modules with the assembled structure (B)
The central base was used as a reference for the simultaneous statistical analysis of the greenhouses, according to the following distributions: diffuser film (T2 and H2), transparent film (H2 and T2), and milky film (H2 and T2) for the measurement of temperature and relative air humidity at 2 m height.
The data were subjected to Kruskal-Wallis non-parametric analysis of variance (ANOVA). This test is a robust alternative to parametric ANOVA, suitable for non-normal or ordinal data (Marôco, 2018).
All collected data of temperature and relative air humidity were treated for a better understanding. The Shapiro-Wilk statistical test was used to assess the normality of the data. Dependent variables were represented as internal and independent variables were represented as external for generating the equations. The H2, H4, T2, and T4 collected in the greenhouses 1, 2, and 3 were the internal variables and the outdoor data from H2, H4, T2, and T4 were the external variables.
Multiple comparison test, Dwass-Steel-Critchlow-Fligner (DSCF) test, was carried out to identify groups with significant differences. The free statistical program JAMOVI 2.4.11 was used for the analyses. Visual Studio Code and Python 3.12.0 were used as programming language for generating the graphs.
Results and Discussion
The results of the Shapiro-Wilk normality test are shown in Table 1.
A normality test with a p-value less than 0.01 indicates that the data are not normally distributed. The median was the same for the diffuser and transparent films, and showed a variation of 0.4 for the milky covering; the lowest standard deviation was 4.82 for the diffuser film, and the highest were 6 and 6.23 for the transparent and milky films, respectively.
Figure 10 shows an analysis of the median in relation to data distribution. The Boxplot graph shows the first quartile between temperatures of 26 and 28 °C, with means of 30 °C (diffuser film), 31 to 32 °C (transparent film), and 30 to 31.5 °C (milky film).

Boxplot for temperature at 2 m under diffuser (Greenhouse 1), transparent (Greenhouse 2), and milky (Greenhouse 3) coverings
The highest temperature variations were found for Greenhouses 2 (transparent film) and 3 (milky film), with values close to 45 °C, which may be exceptionally high. Both greenhouses showed higher dispersion values for the upper quartile. However, the transparent covering resulted in a higher mean temperature (approximately 33.5 °C). According to Zou et al. (2023), greenhouse covering materials lack spectral selectivity, and the transmittance is usually similar for photosynthetically active radiation and near-infrared radiation. This results in a high environmental temperature in the greenhouse.
The lowest relative air humidity was found for the diffuser film (Table 1), and the largest variations were found for the transparent- and milky-covering greenhouses. Considering the median, the milky covering presented the lowest relative air humidity, from 78 to 80%, whereas the relative air humidity by the diffuser and transparent films ranged from 80 to 81%.
Considering the mean, the lowest relative air humidity was found for the transparent covering, ranging between 74 and 75%, while the diffuser film resulted in a relative air humidity of approximately 70%. The transparent film showed the highest dispersion from the median, with the lowest quartile reaching 45% relative air humidity (Figure 11).

Boxplot for relative air humidity at 2 m under diffuser (Greenhouse 1), transparent (Greenhouse 2), and milky (Greenhouse 3) coverings
The analysis of variance showed the statistical differences of the coverings in temperature and relative air humidity at 2 m (T2 and H2) during the analyzed time intervals (Table 2).
All variables showed significant differences at p ≤ 0.01; however, the ε² (partial eta squared) were closer to 1 during the colder time intervals, highlighting a strong effect of the independent on the dependent variables. Contrastingly, during the warmer time intervals, the ε² were closer to 0, indicating that independent variables had no significant effect on the dependent variables.
The analysis of multiple comparisons, using the Dwass-Steel-Critchlow-Fligner test, revealed that the coverings differed from each other, with a significance level of 1%. The results showed that the diffuser, transparent, and milky films presented statistical differences at the 1% level (Table 3).
The relative air humidity differed significantly between treatments (Table 4), with statistically significant differences at p < 0.001.
The results indicated a high difference between the analyzed collection stations for relative air humidity. During the early morning hours, the coverings were different from each other at a 1% level. Tables 5 and 6 show that the coverings significantly differed in temperature and relative air humidity at a 1% level, throughout the nights.
The comparison at 9:00h (Table 7) showed statistical differences, mainly at a significance level of 1%. The greatest differences were found between the diffuser and transparent films, and between the diffuser and milky films.
These results indicate that the diffuser film results in higher temperature variations compared to the transparent and milky films. The transparent film did differ from the milky film at 5% level. Similar values were observed for relative air humidity (Table 8).
The milky and transparent films did not present microclimatic variation in relative air humidity for the 9:00h interval. The diffuser film was the only one that showed variations in temperature and relative air humidity (Tables 7 and 8).
The analyses at 12:00h showed differences in temperature between the diffuser and milky film at a 1% level, and between the diffuser and transparent film at a 5% level.
However, the comparison between the transparent and milky coverings showed no statistical variations at 5% level, indicating that temperature did not differ between transparent and milky coverings at 12:00h (Tables 9 and 10).
The relative air humidity at 12:00h differed between the diffuser and transparent films and between the diffuser and milky films, at 1% level (Table 10).
The diffuser film of Greenhouse 1 and the transparent film of Greenhouse 2 tended to maintain temperature and relative air humidity fluctuations at the 3:00h interval (Table 11). However, the transparent covering differed from the milky film at a 5% level, indicating that the transparent covering of Greenhouse 2 is different from the milky covering of Greenhouse 3 at this specific time.
The relative air humidity under the transparent and milky coverings was different at a 1% level (Table 12). However, the other greenhouses showed differences at 5% level. This reinforces the idea that the transparent and milky coverings present smaller variations in relative air humidity.
A significant difference (p ≤ 0.01) was observed between the greenhouses regarding temperature at colder times (Table 13).
The diffuser differed from the milky and the transparent differed from the milky film at a significance level of 1%, (Table 14). The cooling peak varied; the diffuser film has a slower cooling capacity, and the transparent and milky films had greater decreases in temperature.
The temperature at 2 m height for the diffuser and transparent films showed minor variations (Figures 12A and B); similar results were found by Paradiso et al. (2023).
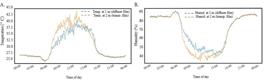
Variations in internal temperature (A) and relative air humidity (B) at 2 m height in greenhouses covered with diffuser and transparent films
The diffuser film exhibited a lower temperature peak between the 09:00h and 15:00h, as shown by the ANOVA. The diffuser film has the capacity to evenly distribute light within the interior (Li & Yang, 2015), as shown by the comparisons. Similarly to temperature, relative air humidity showed lower results for the transparent film, reaching 35% (Figure 12B). The transparent and milky films had higher temperature peaks than the diffuser film, as shown by the ANOVA (Table 2).
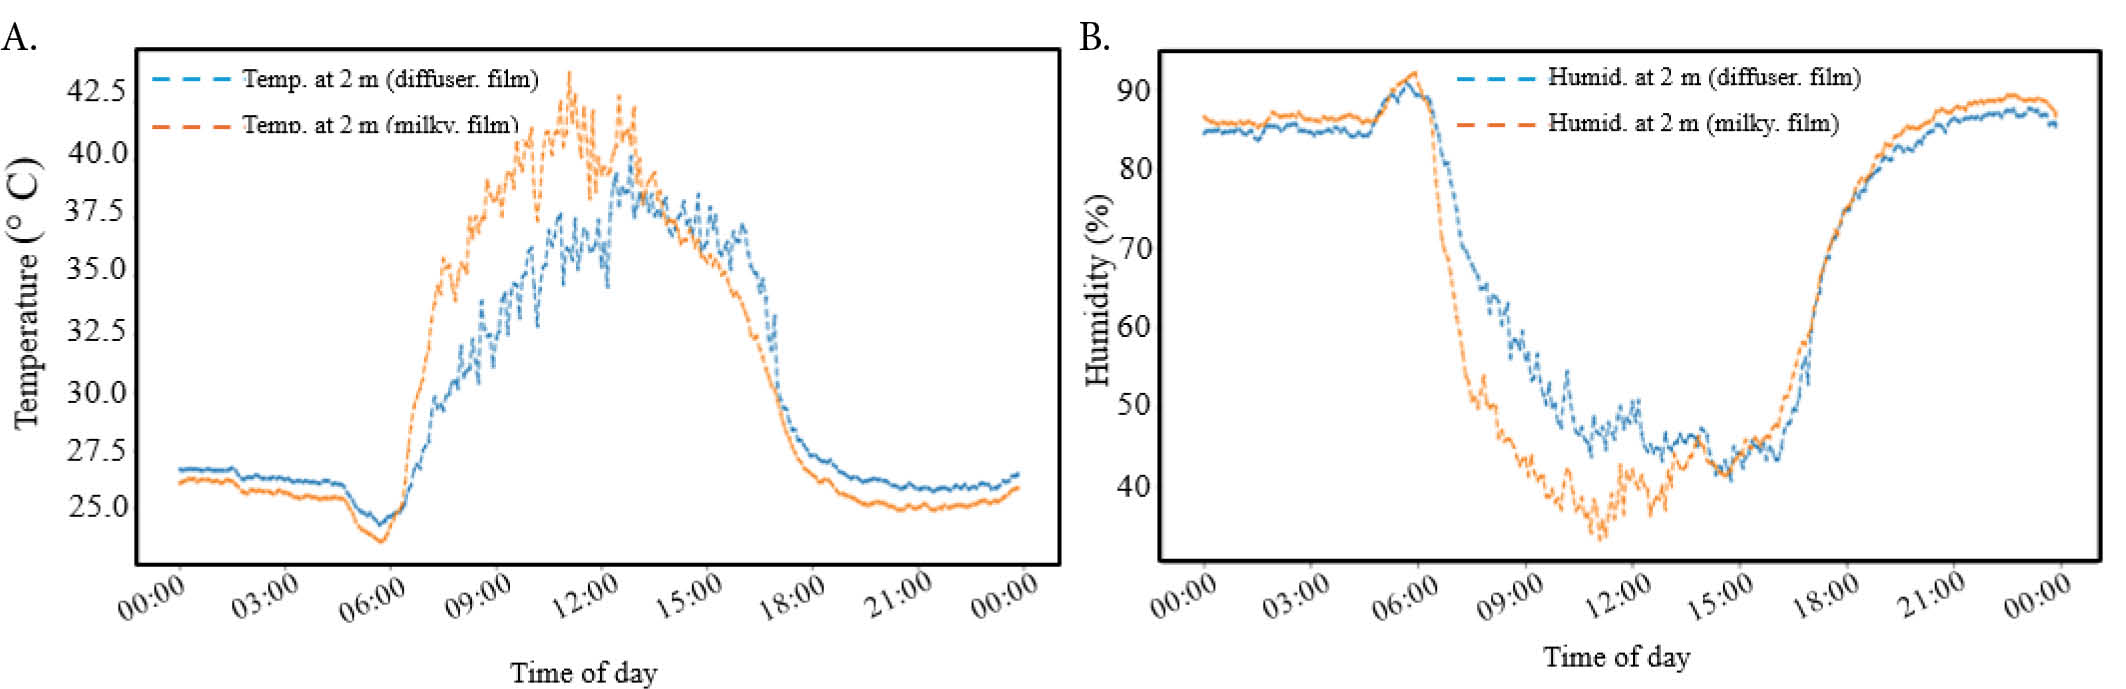
Al-Madani et al. (2024) reported that diffuser films can maintain higher relative air humidity levels and lower internal temperatures; similar results were found in the present study (Figures 13A and B). The milky film differed from the diffuser film during night-time intervals, which was not found between the diffuser and transparent films (Figures 13A and B).

Internal temperature (A) and relative air humidity (B) of greenhouses covered with diffuser and milky films
The transparent and milky film showed lower relative air humidity compared to the diffuser film (Figure 13B). ANOVA analysis for temperature showed no significant differences between the transparent and milky coverings. Figures 14A and B show the temperature for the transparent and milky films, which did not exhibit significant oscillations.
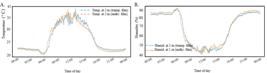
Internal temperature (A) and relative air humidity (B) in greenhouses covered with transparent and milky films
The temperature and relative air humidity found (Figures 14A and B) showed minimal fluctuations for the diffuser and milky coverings. The diffuser film resulted in lower variations in temperature and relative air humidity throughout the day, whereas the milky film exhibited peaks in temperature and relative air humidity over the analyzed hours.
Statistical analyses showed that the diffuser film resulted in the lowest temperatures and differed from the others in temperature and relative air humidity throughout the experiment. The diffuser film resulted in a more uniform temperature compared to the transparent and milky films in the internal environment.
The transparent film exhibited higher daytime temperatures compared to the diffuser film, presenting a difference of approximately 3.8 °C. The highest temperature peaks were found for the milky plastic covering, approximately 45 °C, with the greatest temperature and relative air humidity fluctuations over the nighttime hours.
Conclusions
-
The diffuser film resulted in the lowest temperature peaks and highest relative air humidity in greenhouses. The transparent and milky coverings resulted in higher temperature peaks and lower relative air humidity during the hottest times of the day.
-
The diffuser film showed to be able to distribute temperature more evenly compared to the other analyzed coverings.
Acknowledgments
The authors thank the Brazilian National Council for Scientific and Technological Development (CNPq) and the Brazilian Coordination for the Improvement of Higher Education Personnel (CAPES).
Literature Cited
-
Al-Madani, A. A.; Al-Helal, I. M.; Alsadon, A. A. Assessing the Effectiveness of Reflective and Diffusive Polyethylene Films as Greenhouse Covers in Arid Environments. Agronomy, v.14, e1082, 2024. https://doi.org/10.3390/agronomy14051082
» https://doi.org/10.3390/agronomy14051082 -
Chen, T.; Yin, H. Camera-based plant growth monitoring for automated plant cultivation with controlled environment agriculture. Smart Agricultural Technology, v.8, e100449, 2024. https://doi.org/10.1016/j.atech.2024.100449
» https://doi.org/10.1016/j.atech.2024.100449 -
Feng, C.; Yuan, G.; Wang, R.; Chen, X.; Ma, F.; Yang, H.; Li, X. Performance study on a novel greenhouse cover structure with beam split and heat control function. Energy Conversion and Management, v.301, e118077, 2024. https://doi.org/10.1016/j.enconman.2024.118077
» https://doi.org/10.1016/j.enconman.2024.118077 -
Hernández-Morales, C. A.; Luna-Rivera, J. M.; Perez-Jimenez, R. Design and deployment of a practical IoT-based monitoring system for protected cultivations. Computer Communications, v.186, p.51-64, 2022. https://doi.org/10.1016/j.comcom.2022.01.009
» https://doi.org/10.1016/j.comcom.2022.01.009 -
Jamil, F.; Ibrahim, M.; Ullah, I.; Kim, S.; Kahng, H. K.; Kim, D. H. Optimal smart contract for autonomous greenhouse environment based on IoT blockchain network in agriculture. Computers and Electronics in Agriculture, v.192, e106573, 2022. https://doi.org/10.1016/j.compag.2021.106573
» https://doi.org/10.1016/j.compag.2021.106573 -
Jamovi (Version 2.4.11). The jamovi project (2024). [Computer Software]. Retrieved from https://www.jamovi.org
» https://www.jamovi.org -
Katsoulas, N.; Bari, A.; Papaioannou, C. Plant responses to UV blocking greenhouse covering materials: A review. Agronomy, v.10, e1021, 2020. https://doi.org/10.3390/agronomy10071021
» https://doi.org/10.3390/agronomy10071021 -
Kim, Y. U.; Webber, H.; Adiku, S. G.; Nóia Júnior, R. D. S.; Deswarte, J. C.; Asseng, S.; Ewert, F. Mechanisms and modelling approaches for excessive rainfall stress on cereals: Waterlogging, submergence, lodging, pests and diseases. Agricultural and Forest Meteorology, v.344, e109819, 2024. https://doi.org/10.1016/j.agrformet.2023.109819
» https://doi.org/10.1016/j.agrformet.2023.109819 - Köppen, W. Klassifikation der klimate nach Temperatur, Niederschlag und Yahreslauf. Pet Mitt, v.64, p.193-203, 1918.
-
Li, Y.; Jian, Y.; Wang, S.; Liu, X.; Li, W.; Zhang, L.; Cao, Y. Spatial temperature distribution and ground thermal storage in the plastic greenhouse: An experimental and modeling study. Journal of Energy Storage, v.77, e109938, 2024. https://doi.org/10.1016/j.est.2023.109938
» https://doi.org/10.1016/j.est.2023.109938 -
Li, T.; Yang, Q. Advantages of diffuse light for horticultural production and perspectives for further research. Frontiers in Plant Science, v.6, e704, 2015. http://dx.doi.org/10.3389/fpls.2015.00704
» http://dx.doi.org/10.3389/fpls.2015.00704 -
Li, Y.; Liu, X.; Li, W.; Jian, Y.; Arıcı, M.; Chen, Y.; Shen, Q. Thermal environment evaluation of plastic greenhouses in southern China and optimization by phase change materials. Journal of Building Engineering, v.57, e104882, 2022. https://doi.org/10.1016/j.jobe.2022.104882
» https://doi.org/10.1016/j.jobe.2022.104882 -
Marôco, J. Análise Estatística com o SPSS Statistics. 7ª edição. ReportNumber, Lda, ISBN: 978-989-96763-5-0. 2018. Available on: < https://books.google.com.br/books?hl=pt-BR&lr=&id=Ki5gDwAAQBAJ&oi=fnd&pg=PP1&dq=An%C3%A1lise+Estat%C3%ADstica+com+o+SPSS+Statistics&ots=zOpqnyDbdE&sig=3Vi2N9riRmc-MWipenZVaWYFhs8#v=onepage&q=An%C3%A1lise%20Estat%C3%ADstica%20com%20o%20SPSS%20Statistics&f=false>
» https://books.google.com.br/books?hl=pt-BR&lr=&id=Ki5gDwAAQBAJ&oi=fnd&pg=PP1&dq=An%C3%A1lise+Estat%C3%ADstica+com+o+SPSS+Statistics&ots=zOpqnyDbdE&sig=3Vi2N9riRmc-MWipenZVaWYFhs8#v=onepage&q=An%C3%A1lise%20Estat%C3%ADstica%20com%20o%20SPSS%20Statistics&f=false -
Mishra, K.; Stanghellini, C.; Hemming, S. Technology and materials for passive manipulation of the solar spectrum in greenhouses. Advanced Sustainable Systems, v.7, e2200503, 2023. https://doi.org/10.1002/adsu.202200503
» https://doi.org/10.1002/adsu.202200503 - Oliveira, S. F.; Prado, R. B.; Monteiro, J. M. G. Impacts of climate change on agricultural production and adaptation measures under the perception of actors and rural producers in Nova Friburgo, RJ. Interações, v.23, p.1179-1201, 2023.
-
Oliveira, S. Internet das coisas com ESP8266, Arduino e Raspberry PI. Novatec Editora, 2017. Available on: https://books.google.com.br/books?hl=pt-BR&lr=&id=E8gmDwAAQBAJ&oi=fnd&pg=PA17&dq=vantagem+entre+a+comunica%C3%A7%C3%A3o+I2C+dos+demais+protocolos+como+UART+e+SPI&ots=5QSf5n2Z3A&sig=_XFGrmbnKFlKSf5l2L-_CDJQWp0#v=onepage&q&f=false
» https://books.google.com.br/books?hl=pt-BR&lr=&id=E8gmDwAAQBAJ&oi=fnd&pg=PA17&dq=vantagem+entre+a+comunica%C3%A7%C3%A3o+I2C+dos+demais+protocolos+como+UART+e+SPI&ots=5QSf5n2Z3A&sig=_XFGrmbnKFlKSf5l2L-_CDJQWp0#v=onepage&q&f=false -
Oliveira, S. F. Tropical Estufas agrícolas. Qualidade dos filmes difusores é fundamental. Tropical Estufas Agrícolas Hidroponia Filme Agrícola Tela Agrícola Plástico para Estufa. Available on: Available on: https://tropicalestufas.com.br/qualidade-dos-filmes-difusores-e-fundamental/ Accessed on: mar. 2024.
» https://tropicalestufas.com.br/qualidade-dos-filmes-difusores-e-fundamental/ -
Paperplast. Online Plástico para estufa. Available on: Available on: https://www.paperplast.com.br/plastico-para-estufa/filme-estufa-leitoso.html Accessed on: Jul. 2022.
» https://www.paperplast.com.br/plastico-para-estufa/filme-estufa-leitoso.html -
Paradiso, R.; Di Mola, I.; Cozzolino, E.; Ottaiano, L.; El-Nakhel, C.; Rouphael, Y.; Mori, M. Nutrient and Nutraceutical Quality of Rocket as a Function of Greenhouse Cover Film, Nitrogen Dose and Biostimulant Application. Agronomy, v.13, e638, 2023. https://doi.org/10.3390/agronomy13030638
» https://doi.org/10.3390/agronomy13030638 -
Python Software Foundation. Version 3.12.0. Available at http://www.python.org/downloads/
» http://www.python.org/downloads/ -
Rebouças, P. M.; Dias, Í. F.; Alves, M. A.; Barbosa Filho, J. A. D. Radiação solar e temperatura do ar em ambiente protegido. Revista Agrogeoambiental, v.7, p.115-125, 2015. https://doi.org/10.18406/2316-1817v7n22015610
» https://doi.org/10.18406/2316-1817v7n22015610 -
Sensirion AG. Catálogo de produtos: SHT31. Available on: Available on: https://www.sensirion.com/products/catalog/SHT31A-DIS-B Accessed on: Abril 2023.
» https://www.sensirion.com/products/catalog/SHT31A-DIS-B -
Shi, W.; Zhang, Y.; Li, Y.; Liu, X. A.; Meng, S.; Li, T.; Zhao, L. Performance of Reflective Film on the Light Environment of Chinese Solar Greenhouse. Agronomy, v.14, e652, 2024. https://doi.org/10.3390/agronomy14040652
» https://doi.org/10.3390/agronomy14040652 -
Sparkfun. I2C Protocol. Available on: Available on: https://learn.sparkfun.com/tutorials/i2c/protocol Accessed on: Mar. 2023.
» https://learn.sparkfun.com/tutorials/i2c/protocol -
Subahi, A. F.; Bouazza, K. E. An intelligent IoT-based system design for controlling and monitoring greenhouse temperature. IEEE Access, v.8, p.125488-125500, 2020. https://doi.org/10.1109/ACCESS.2020.3007955
» https://doi.org/10.1109/ACCESS.2020.3007955 -
Topgadget. Selecionando entre protocolos I2C e SPI para o seu projeto. Top Gadget, 2022. Available on: Available on: https://www.topgadget.com.br/howto/eletronica/selecionando-entre-protocolos-i2c-e-spi-para-o-seu-projeto.htm Accessed on: Mar. 2023.
» https://www.topgadget.com.br/howto/eletronica/selecionando-entre-protocolos-i2c-e-spi-para-o-seu-projeto.htm -
Visual Studio Code. Version 1.78. https://code.visualstudio.com/updates/v1_78
» https://code.visualstudio.com/updates/v1_78 -
World Meteorological Organization. Guidelines on the installation of meteorological instruments and observations systems. 7th ed. Geneva: WMO, 2008. Available on: Available on: https://library.wmo.int/doc_num.php?explnum_id=3461 Accessed on: Mar. 2023.
» https://library.wmo.int/doc_num.php?explnum_id=3461 -
Zou, H.; Wang, C.; Yu, J.; Huang, D.; Yang, R.; Wang, R. Eliminating greenhouse heat stress with transparent radiative cooling film. Cell Reports Physical Science, v.4, e101539, 2023. https://doi.org/10.1016/j.xcrp.2023.101539
» https://doi.org/10.1016/j.xcrp.2023.101539
Financing statement
There are no supplementary data for this research.




 Temp. - Temperature; Humid. - Relative air humidity
 Temp. - Temperature; Humid. - Relative air humidity
 Temp. - Temperature; Humid. - Relative air humidity