
 Rainfall variability in the region of Tangará da Serra, Mato Grosso, using the standardized precipitation index
ABSTRACT
Regionally, the municipality of Tangará da Serra, Mato Grosso state, Brazil, has significant agricultural potential due to its latitudinal and orographic conditions. The variability of meteorological elements, especially rainfall, has direct impacts on the socio-environmental, economic and agricultural spheres, so assessing the intensity and trends of this variability is essential to rationalize the use of water resources, quantify impacts and for decision-making and planning to minimize possible negative impacts. In this context, the objective was to analyze the variability of precipitation and apply the Standardized Precipitation Index (SPI) to quantify drought severity. Precipitation data made available by the National Institute of Meteorology and the National Water and Sanitation Agency (ANA) between 1970 and 2023 were used. These data were analyzed for monthly and annual distribution and subjected to analysis of the probabilistic Gamma distribution model and SPI index. In general, in 47.1% of the years (25 years), the annual average precipitation was higher than the historical average (1,774.4 mm). Between 2000 and 2023, only 15% of the years exceeded the historical average precipitation. Several years with prolonged dry periods indicated by the SPI were observed in the analyzed period, with evidence of accentuation from the last 20 years; to better analyze drought events and relate their influence on agriculture, time scales of 3 and 12 months were considered.
Key words:
drought index; extreme events; El Niño
HIGHLIGHTS:
The Standardized Precipitation Index (SPI) is one of the main tools for identifying droughts on different time scales.
The annual variability of rainfall in the municipality of Tangará da Serra can be explained by its geographic location.
The El Niño phenomenon influences the volume and temporal distribution of rainfall.
RESUMO
Regionalmente, o município de Tangará da Serra, Mato Grosso, apresenta potencial agrícola significativo devido às suas condições latitudinais e orográficas. A variabilidade dos elementos meteorológicos, especialmente a chuva, tem impactos diretos nos âmbitos socioambiental, econômico e agropecuário, de modo que, avaliar a intensidade e tendências dessa variabilidade são fundamentais para racionalizar o uso dos recursos hídricos, quantificar os impactos e tomadas de decisão e planejamento para minimizar possíveis impactos negativos. Nesse sentido, objetivou-se analisar a variabilidade da precipitação e aplicar o Índice Padronizado de Precipitação (SPI) para a quantificação da severidade de seca. Utilizou-se dados de precipitação disponibilizados pelo Instituto Nacional de Meteorologia (INMET) e da Agência Nacional de Águas e Saneamento Básico (ANA) entre 1970 e 2023. Estes dados foram analisados quanto a distribuição mensal e anual e submetidos à análise do modelo probabilístico de distribuição Gama e índice SPI. Em geral, em 47,1% dos anos (25 anos), a média anual de precipitação foi superior à média histórica (1.774,4 mm). Entre 2000 e 2023, somente 15% dos anos superaram a média histórica de precipitação. No intervalo de anos analisado, foram observados vários anos com períodos de seca prolongados indicados pelo SPI, com evidências de acentuação a partir dos últimos 20 anos; para melhor analisar os eventos de seca e relacionar sua influência na agricultura foram considerados escalas de tempo de 3 e 12 meses.
Palavras-chave
índice de seca; eventos extremos; El Niño
Introduction
The variability of meteorological elements has gained prominence in recent years due to its direct impacts on crop yields, causing effects on national and global scales (Guo et al., 2022). The meteorological factor is considered one of the main determinants of agricultural systems, with the precipitation variable being the main factor responsible for water availability in environments, directly influencing agriculture and crop yield (Hoogenboom, 2019).
Rainfall has a major influence on environmental conditions, and extreme events can directly impact water excess or scarcity, affecting drought occurrences and the climatological water balance. Additionally, any changes in rainfall patterns can trigger various problems, especially in water availability, causing irreversible effects on agriculture (Silva et al., 2021).
The state of Mato Grosso, Brazil, in addition to being a major agricultural producer, has great biodiversity, mainly because it is home to globally relevant regions, such as the Pantanal, Cerrado and Amazon biomes, which occupy 54% of its territory (Carauta et al., 2021). Regarding the agricultural scenario, the state is a global leader in the production of crops such as soybeans - Glycine max and corn - Zea mays, which represent a large part of the country’s market value (CONAB, 2025).
The heterogeneity of the state is characterized by interspersing agricultural and conservation areas. However, the expansion of agricultural systems has generated some irregular events in the region, such as increased temperature and variability in rainfall patterns (Andrea et al., 2020). Tangará da Serra is a municipality with agricultural potential, and the exploitation of crops such as soybeans and corn is prominent in the region, but extreme events such as severe droughts have caused periods of low water availability and impacts on agriculture (Barbieri et al., 2019).
Water scarcity is a natural risk that can occur frequently around the world, to which, in addition to all the impacts already described, agriculture is more vulnerable (Ingrao et al., 2023). Thus, considering the instability of precipitation, increased temperature and evapotranspiration, there may be a decrease in the availability of water in the soil and extreme water demand by plants, causing effects on all stages of growth and development of agricultural crops, resulting in significant losses in the production (Gozzo et al., 2019).
One of the main causes of variability in rainfall rates is characterized by two distinct phases: El Niño, when there are exceptionally warm oceanic and atmospheric conditions in the tropical Pacific, and La Niña, when there is anomalous cooling of the waters of the Pacific (Lin & Qian, 2019). These phenomena affect several aspects, such as anomalies in precipitation patterns and air temperature, and these changes directly influence the physiology of plants and animals, as well as the incidence of prolonged droughts depending on the region under analysis (Barbieri et al., 2019).
Meteorological indices are the main tools for identifying droughts on different time scales. The Standardized Precipitation Index (SPI) was developed with the aim of quantifying the severity and magnitude of droughts through numerical values (McKee et al., 1993). Several studies have used this methodology to characterize major drought events in different regions of Brazil, including research in Mato Grosso state (Fernandes et al., 2024; Souza et al., 2024).
The SPI is the index recommended by the World Meteorological Organization for assessing extreme drought events, which, due to its ease of calculation, promotes its use in several studies focused on agriculture and water resource management.
Based on the above, this study aimed to evaluate the variability of precipitation for the municipality of Tangará da Serra, Mato Grosso state, Brazil, with annual and monthly distribution, define different levels of precipitation probability, and evaluate the incidence of droughts for the region using the Standardized Precipitation Index. This study is expected to confirm that in the Tangará da Serra region there is significant variability on both annual and monthly scale, with specific seasonal patterns. In addition, different levels of probability of occurrence can be defined based on historical data, and the incidence of droughts, assessed through the Standardized Precipitation Index, which reveals critical periods of water deficit that impact the region.
Material and Methods
The study was carried out in the municipality of Tangará da Serra, located in the state of Mato Grosso, Brazil, at latitude 14º 39’ South, Longitude 57º 25’ West, with an average altitude of 440 m (Figure 1). The predominant climate of the region, according to Köppen’s classification, is characterized as megathermal or tropical (Aw) (Souza et al., 2013), with two well-defined seasons, one from May to September and the other from October to April, dry and rainy, respectively, with an average annual rainfall of 1,830 mm (Dallacort et al., 2011).

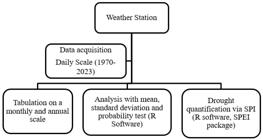
Precipitation data were obtained from two terrestrial weather stations belonging to the National Institute of Meteorology (INMET) and the National Water and Sanitation Agency (ANA), covering the period from 1970 to 2023, on a daily scale. The data were initially tabulated and analyzed using mean and standard deviation tests. They were then tabulated on a monthly scale to quantify drought events via SPI (Figure 2). Drought events were quantified using the SPEI package (https://cran.r-project.org/web/packages/SPEI/SPEI.pdf), which is freely available in R software. All analyses were conducted in R.
The determination of probable precipitation was performed using the probabilistic Gamma distribution model (Thom, 1958), whose function is given by Eqs. 1 and 2
where:
f(x) - probabilistic Gamma distribution model;
α - shape parameter (dimensionless);
β - scale parameter (mm);
e - base of the Napierian logarithm;
x - total precipitation (mm);
Γ - symbols of the gamma function (dimensionless); and,
π - value of 3.14159265;
A commonly used method consists of equating the mean (X) and variance (S²) of the sample to the mean and variance of the population. This process leads to obtaining Eqs. 3 and 4, as stated by Dallacort et al. (2011).
For this study, probability levels of 10, 25, 40, 60, 75 and 90% were determined for analysis and subsequent discussion of the results.
The Standardized Precipitation Index (SPI) can be calculated over different time periods. For this study, SPI-3 and SPI-12 were used, with the aim of visualizing greater differences within the historical series.
The SPI methodology is based on monthly sums of precipitation only, evaluating drought events on different time scales (1, 3, 6, 12, 24 and 48 months). Furthermore, this method has already been used by several researchers in Brazil (Paredes-Trejo, 2021).
All calculations were performed using the SPEI package (Beguería & Vicente-Serrano, 2023) available in R software (R Core Team, 2023). SPI was initially calculated using the Gamma distribution method, which is defined by the probability density function (PDF) described by Eqs. 5 and 6:
where:
β > 0 (β) scale parameter (mm);
α > 0 (α) shape parameter (dimensionless);
x > 0 (α) (x) total precipitation (mm); and,
Γ (α) gamma function.
All parameters, including the gamma probability density function, were adjusted based on the frequency distribution of accumulated rainfall used in the study. The α and β measures of the function were estimated for each station analyzed, using the Maximum Likelihood Method (MLM) (Thom, 1958), to estimate the parameters (Eqs. 7 and 8).
The classification of calculated SPI values is determined based on the limits specified in Table 1. Positive SPI values indicate above-average precipitation, while negative values represent below-average precipitation. Drought condition occurs when the SPI value is constantly negative.
Results and Discussion
The annual distribution of precipitation in the Tangará da Serra region, Mato Grosso state, Brazil, indicates a variation in rainfall rates during the 40 years evaluated, with a maximum annual accumulation of 2,770.50 mm, representing the year 1990, and an annual minimum in the year 2023, with an accumulation of 1,262.2 mm. The average annual precipitation for the period from 1970 to 2023 is 1,774.4 mm. The annual behavior of rainfall in the region (Figure 3) indicates that only 25 years (47.1%) of the rainfall rates exceeded the overall average, with 2018 being the last year of occurrence.

Annual cumulative distribution of precipitation from 1970 to 2023 for Tangará da Serra, Mato Grosso state, Brazil
When analyzing only the last 23 years (2000 to 2023), only 15% exceeded the historical average; however, a decrease in annual rainfall values is noticeable from 2018 onwards, reaching the lowest rate within the series. The annual variability of rainfall in the municipality can be explained by its geographic location, that is, in the Cerrado the annual averages tend to vary around 1,486 ± 146.8 mm; however, the municipality is in a transition environment between the Cerrado and the Amazon biomes, which generates an increase in rainfall rates, considering that the highest averages are in these ecotones.
One of the factors that may be associated with the annual reduction in rainfall rates, especially since 2018, is climate change, which has been responsible for influencing precipitation patterns in several ecosystems and regions in recent decades (Pörtner et al., 2021). Changes in the patterns of some climate variables generate several problems in the agricultural sector regardless of the region. Regarding rainfall, future estimates indicate a significant reduction in rates for the region, reaching 17% of areas unsuitable for agriculture due to changes in rainfall patterns (Andrea et al., 2020).
When evaluating the distribution of rainfall on a monthly scale (Figure 4), it can be seen that for the municipality of Tangará da Serra, the precipitation rates are divided into two distinct seasons, a dry season with the lowest rainfall rates (June to August) and a rainy season with the highest precipitation volume (October to April). The months of May and September are considered transition months, with a reduction and an increase in precipitation, respectively.

Average monthly rainfall distribution from 1970 to 2023, in Tangará da Serra, Mato Grosso state, Brazil
These results corroborate those of Barbieri et al. (2019), who observed similar rainfall behavior for the region, identifying two distinct phases, rainy (October to April) and dry (May to September), periods that are caused by the movement of hot and humid air masses formed in the Pacific Ocean and brought by the winds to the location.
In the rainy season, when the highest monthly precipitation rates occur, months with greater rainfall variability are observed, periods that represent the maximum and minimum values of the rainy season, with 585.8 mm in February 2010 and 7.8 mm recorded in March 1983. In contrast, the dry season has the lowest variability in monthly accumulations, with 0.00 mm in several years, and the maximum value recorded was 96.4 mm in 1981, in August (Figure 3).
This oscillation is important to measure the behavior of rainfall within the years evaluated, thus highlighting all the values recorded within each period. One of the indicators for rainfall amplitude on a monthly scale is the increase in the intensity of events, which in some aspects does not modify the overall averages, but can result in more frequent rainfall in a short period, especially in the rainy season when the months show the greatest standard deviations, thus confirming all the variability within this short period (Dallacort et al., 2011; Santos et al., 2023).
These low rates can cause water deficit, which is considered the main factor in reduced yield, affecting the quality and size of the grains. This factor further highlights the severity of water shortages during the dry season in the region, causing a delay in the maintenance of the hydrological cycle, in addition to changes in water input and output in the system (Cassettari & Queiroz, 2020).
The average annual rainfall observed in this study is present in probability estimates of 40 and 50%, these levels being the closest to the overall average. Considering specific estimates such as 25, 50 and 75% probability, average values of 1,968.4, 1,735.7 and 1,522.1 mm were observed, respectively (Table 2).
According to Barbieri et al. (2019), knowledge of the region’s probable precipitation provides a greater margin of safety in agricultural planning and irrigation systems, allowing for better water management, in addition to increasing reliability in decision-making.
Probability levels can be considered crucial indicators in the analysis of climate variability. In addition to corresponding to an essential function in weather forecasting, they can be associated with the possibility of knowing the region’s probable climate patterns, making it possible to assign a return period to any precipitation value (Dallacort et al., 2011; Abreu et al., 2017).
In the rainy season, when precipitation rates are the highest recorded, there was high variability in rainfall among the probability levels. However, when evaluating only 25, 50 and 75%, there was an increase and a reduction in probable rainfall, in the months of least uniformity (January and February), with values of 368.1, 283 and 212.3 mm for each scale, respectively.
In a study carried out for the Amazon and Cerrado regions, Rattis et al. (2021) found, according to future climate projections, a reduction in precipitation rates, considering only the 2030 and 2060s, with a decrease of 124 and 145 mm, respectively. These studies further indicate the real impact of possible changes in the climate.
The dry season, which represents the months with the lowest precipitation, showed a reduction in probable rainfall rates for the region. When analyzing only 75% probability, an accumulated reduction of up to 40.5 mm can be seen in the months of June, July, and August, a decrease also observed at other probability levels such as 50, 60, and 90%. Analytical understanding of probable precipitation rates ensures greater stability in decision-making, especially in irrigation, enabling prior knowledge of possible changes in the water regime, and thus further improving the use of natural resources (Melo & Lima, 2021).
The distribution of SPI-3 is characterized by the oscillation of wet and dry periods; however, from 1994 onwards there was a greater accentuation of dry periods for Tangará da Serra. The main events identified were from 2002 to 2004, from 2010 to 2011, from 2015 to 2016 and from 2019 to 2022, events that stood out for their duration and intensity, reaching a scale of -2.00, classified as exceptionally dry. All changes in drought patterns for the municipality, changing wet periods to dry ones, are indicated by the trend line, and with the beginning of the 21st century, events with greater intensity occurred, indicating a decreasing line until 2023 (Figure 5). Climate variation can be attributed to the impacts generated by the El Niño-Southern Oscillation (ENSO) phenomenon, and during these events there are variations in climate factors such as temperature and precipitation, thus generating a greater incidence of droughts in the regions, occurring with greater intensity and frequency (Lin & Qian, 2019).

Standardized Precipitation Index SPI-3 for Tangará da Serra, Mato Grosso state, Brazil, from 1970 to 2023
The Cerrado region has climate variability due to latitudinal variation and topographic amplitude, with a direct effect of air masses on temperature, precipitation, and humidity conditions, a fact that can explain the different rainfall rates in the region, as well as the incidence of droughts, making the region intermediate and dependent on these factors (Nascimento & Novais, 2020).
With SPI-12 it is possible to determine the wettest periods of the study, that is, from 1980 to 1990, which were classified as moderately humid or severely humid, periods that had the highest annual averages, exceeding the historical average observed in this study (Figure 6). In this distribution, there has been a greater accentuation of droughts in recent years (from 2019 to 2023), a condition that can have several negative effects on human life and agriculture, with precipitation being responsible for the water availability in the region. Following the trend line for both distributions, these events are expected to intensify and occur more frequently, and the decreasing line points to possible sequential periods of drought.

Standardized Precipitation Index SPI-12 for Tangará da Serra, Mato Grosso state, Brazil, from 1970 to 2023
These results corroborate those recorded by Cunha et al. (2019) when analyzing all Brazilian states in the period from 2011 to 2019 and Junqueira et al. (2020) when analyzing Juazeiro, BA, between 1980 and 2012, where the authors identify the main episodes of droughts from the beginning of the 21st century, with emphasis on 2011 to 2019, with events with greater frequency, intensity and severity, with severe droughts for the entire central region of Brazil in the years from 1997 to 1998, from 2014 to 2015, and from 2015 to 2016. According to the authors, these events caused a serious water crisis, with the greatest severity recorded in the last 100 years.
Rainfall has shown significant variation over the years, with irregular distribution across annual periods, especially in recent years, highlighting the impacts of climate change. In this context, it is essential to expand knowledge about the effects of extreme climate events on the agricultural sector, considering the importance of agribusiness to the Brazilian economy and the risks associated with its consequences (Nobre et al., 2019).
The SPI results demonstrated significant variation in conditions over the years analyzed. While the wetter categories were recorded less frequently, drought categories, especially moderately dry, severely dry, and extremely dry, had a higher incidence, reaffirming results already observed in this study, demonstrating great variability in rainfall patterns.
In the Midwest and throughout Brazil, the occurrence of severe droughts is becoming more frequent. And with the advancement of these climate changes, even more intense events are expected, which will harm various ecosystems, people, and agriculture. As rain is the main form of water entry into the hydrological cycle (Souza et al., 2013), and its distribution and variability is directly related to the dynamics of the atmosphere and the relief of the region, drought events directly influence agricultural yield.
According to the results, the variability of rainfall rates is visible throughout the period studied, in which the annual scale shows a tendency for rainfall to decline in the region, and there may be several factors associated with this change, such as geographic location, climate change, extreme events, among others.
Rainfall has an orderly distribution throughout the year, with rainy and dry periods, which may be associated with the incidence of droughts, when there is a reduction in precipitation over a longer time scale. In addition, it is important to measure other factors that cause droughts, such as increased temperature and, consequently, greater evapotranspiration, processes that tend to remove more water from the environment, affecting soil moisture, reservoirs and the water balance. These changes in temperature are consequences of greenhouse gases from fires and pollutant sources such as industries and vehicles (OBSERVATÓRIO DO CLIMA, 2023).
The study indicates that meteorological factors are already being affected by human actions, changes in rainfall and temperature patterns, which may not only affect human life, but also have a direct impact on several sectors such as agriculture, a sector that is totally dependent on climate conditions.
Conclusions
-
In the municipality of Tangará da Serra, there have been changes in rainfall patterns over the last 50 years, with the average annual rainfall being 1,774.69 mm, behavior possibly associated with the frequency of occurrence of ENSO events.
-
The region has two well-defined seasons, a rainy season that occurs between the months of October and April, and a dry season from June to August. The months of May and September were classified as transition months, when rainfall levels decrease and increase, respectively.
-
There was variability in rainfall for the rainy season, considering the probability levels, with January and February being the most affected months, and there was a reduction in rainfall during the dry season.
-
Several months were diagnosed with prolonged droughts, according to the Standardized Precipitation Index, with indexes on the -2.0 scale, characterized by a reduction in rainfall levels in the region, especially in the last years analyzed from 2019 onwards, following the annual distribution of reduced rainfall.
Acknowledgments
Mato Grosso State Research Support Foundation (FAPEMAT), for granting a scientific initiation scholarship to the first author.
Literature Cited
-
Abreu, F. G. de.; Angelini Sobrinha, L.; Brandão, J. L. B. Análise da distribuição temporal das chuvas em eventos hidrológicos extremos. Engenharia Sanitária e Ambiental. v.22, p.239-250, 2017. https://doi.org/10.1590/s1413-41522016146750
» https://doi.org/10.1590/s1413-41522016146750 -
Almeida, H. A. de; Galvani, E. Main water characteristics and climatic types of environments undergoing degradation and/or desertification in northeastern Brazil. Revista Brasileira de Geografia Física, v.17, p.3386-3401, 2024. https://doi.org/10.26848/rbgf.v17.5.p3386-3401
» https://doi.org/10.26848/rbgf.v17.5.p3386-3401 -
Andrea, M. C. da S.; Dallacort, R.; Tieppo, R. C.; Barbieri, J. D. Assessment of climate change impact on double-cropping systems. SN Applied Sciences, v.2, p.1-13, 2020. https://doi.org/10.1007/s42452-020-2325-z
» https://doi.org/10.1007/s42452-020-2325-z -
Barbieri, J. D.; Dallacort, R.; Freitas, P. S. L. de; Araújo, D. V. de; Tieppo, R. C.; Fenner, W. Effects of the ENSO on the variability of precipitation and air temperature in agricultural regions of Mato Grosso State. Journal of Agricultural Science, v.11, e91, 2019. https://doi.org/10.5539/jas.v11n9p91
» https://doi.org/10.5539/jas.v11n9p91 -
Beguería, S.; Vicente-Serrano, S. M. SPEI: Calculation of the Standardized Precipitation-Evapotranspiration Index. R package version 1.8.1, 2023. <https://CRAN.R-project.org/package=SPEI>.
» https://CRAN.R-project.org/package=SPEI -
Carauta, M.; Parussis, J.; Hampf, A.; Libera, A.; Berger, T. No more double cropping in Mato Grosso, Brazil? Evaluating the potential impact of climate change on the profitability of farm systems. Agricultural Systems, v.190, e103104, 2021. https://doi.org/10.1016/j.agsy.2021.103104
» https://doi.org/10.1016/j.agsy.2021.103104 -
Cassettari, G. A.; Queiroz, T. M. Balanço hídrico e classificação climática na bacia do rio Jauquara, região de transição entre o Cerrado e a Amazônia brasileira. Revista Brasileira de Climatologia, v.26, e59513, 2020. https://doi.org/10.5380/abclima.v26i0.59513
» https://doi.org/10.5380/abclima.v26i0.59513 - CONAB - Companhia Nacional de Abastecimento. Acompanhamento de safra brasileira de grãos, Brasília, DF, v.12 - Safra 2024/25, n.4 - Quarto levantamento, p.1-102, jan. 2025.
-
Cunha, A. P. M. A.; Zeri, M.; Leal, K. D.; Costa, L.; Cuartas, L. A.; Marengo, J. A.; Tomasella, J.; Vieira, R. M.; Barbosa, A. A.; Cunningham, C.; Garcia, J. V. C.; Broedel, E.; Alvalá, R.; Ribeiro-Neto, G. Extreme Drought Events over Brazil from 2011 to 2019. Atmosphere, v.10, e642, 2019. https://doi.org/10.3390/atmos10110642
» https://doi.org/10.3390/atmos10110642 -
Dallacort, R.; Martins, J. A.; Inoue, M. H.; Freitas, P. S. L. De; Coletti, A. J. Distribuição das chuvas no município de Tangará da Serra, médio norte do Estado de Mato Grosso, Brasil. Acta Scientiarum: Agronomy, v.33, p.193-200, 2011. https://doi.org/10.4025/actasciagron.v33i2.5838
» https://doi.org/10.4025/actasciagron.v33i2.5838 -
Fernandes, F. A. C.; Santos, L. O. F. D.; Nunes, N. D. C.; Machado, N. G.; Biudes, M. S. Quantifying droughts in Mato Grosso with SPI and SPEI: exploring connections to tropical sea Surface temperatures. Theoretical and Applied Climatology, v.155, p.9751-9766, 2024. https://doi.org/10.1007/s00704-024-05212-1
» https://doi.org/10.1007/s00704-024-05212-1 -
Gozzo, L. F.; Palma, D. S.; Custodio, M. S.; Machado, J. P. Climatology and trend of severe drought events in the state of Sao Paulo, Brazil, during the 20th century. Atmosphere, v.10, e190, 2019. https://doi.org/10.3390/atmos10040190
» https://doi.org/10.3390/atmos10040190 -
Guo, S.; Zhang, Z.; Guo, E.; Fu, Z.; Gongo, J.; Yang, X. Historical and projected impacts of climate change and technology on soybean yield in China. Agricultural Systems , v.203, e103522, 2022. https://doi.org/10.1016/j.agsy.2022.103522
» https://doi.org/10.1016/j.agsy.2022.103522 -
Hoogenboom, G.; Porter, C. H.; Boote, K. J.; Shelia, V.; Wilkens, P. W.; Singh, U.; White, J. W.; Asseng, S.; Lizaso, J. I.; Moreno, L. P.; Pavan, W. The DSSAT crop modeling ecosystem. In: Advances in crop modelling for a sustainable agriculture. Burleigh Dodds Science Publishing, 2019. p.173-216. https://doi.org/10.19103/AS.2019.0061.10
» https://doi.org/10.19103/AS.2019.0061.10 -
Ingrao, C.; Strippoli, R.; Lagioia, G.; Huisingh, D. Water scarcity in agriculture: An overview of causes, impacts and approaches for reducing the risks. Heliyon, v.9, e202465, 2023. https://doi.org/10.1016/j.heliyon.2023.e18507
» https://doi.org/10.1016/j.heliyon.2023.e18507 -
Junqueira, H. S.; Almeida, L. M. F. de; Souza, T. S. de; Nascimento, P. dos S. Análise da variação sazonal e tendências da precipitação pluviométrica no município de Juazeiro-BA. Revista Brasileira de Geografia Física . v.13, p.2641-2649, 2020. https://doi.org/10.26848/rbgf.v13.6.p2641-2649
» https://doi.org/10.26848/rbgf.v13.6.p2641-2649 -
Lin, J.; Qian, T. A new picture of the global impacts of El Nino-Southern oscillation. Scientific Reports, v.9, p.1-7, 2019. https://doi.org/10.1038/s41598-019-54090-5
» https://doi.org/10.1038/s41598-019-54090-5 -
Liu, C.; Yang, C.; Yang, Q.; Wang, J. Spatiotemporal drought analysis by the standardized precipitation index (SPI) and standardized precipitation evapotranspiration index (SPEI) in Sichuan Province, China. Scientific Reports , v.11, e1280, 2021. https://doi.org/10.1038/s41598-020-80527-3
» https://doi.org/10.1038/s41598-020-80527-3 - Mckee, T. B.; Doesken, N.; Kleist, J. The relationship of drought frequency and duration to time scales. In: Proceedings of the 8th Conference on Applied Climatology. 1993. p.179-183.
-
Melo, V. da S.; Lima, L. M. Caracterização da Chuva da Microrregião de Catolé do Rocha no Estado da Paraíba Baseada em Estatística Aplicada. Revista Brasileira de Meteorologia, v.36, p.97-106, 2021. https://doi.org/10.1590/0102-77863610006
» https://doi.org/10.1590/0102-77863610006 - Nascimento, D. T. F.; Novais, G. T. Clima do Cerrado: dinâmica atmosférica e características, variabilidades e tipologias climáticas. Élisée - Revista de Geografia da UEG, v.9, e92, 2020.
-
Nobre, G. G.; Muis, S.; Veldkamp, T. I. E; Ward, P. J. Achieving the reduction of disaster risk by better predicting impacts of El Niño and La Niña. Progress in Disaster Science, v.2, e100022, 2019. https://doi.org/10.1016/j.pdisas.2019.100022
» https://doi.org/10.1016/j.pdisas.2019.100022 -
OBSERVATÓRIO DO CLIMA, 2023. Futuro da Energia: visão do observatório do clima para uma transição justa no Brasil. Available at: Available at: https://www.oc.eco.br/futuro-da-energia-visao-do-observatoriodo-clima-para-uma-transicao-justa-no-brasil/ Access on: Jan. 21, 2025.
» https://www.oc.eco.br/futuro-da-energia-visao-do-observatoriodo-clima-para-uma-transicao-justa-no-brasil/ -
Paredes-Trejo, F.; Barbosa, H. A.; Giovannittone, J.; Kumar, T. V. L.; Thakur, M. K.; Buriti, C. de O. Long-term spatiotemporal variation of droughts in the Amazon River basin. Water, v.13, e351, 2021. https://doi.org/10.3390/w13030351
» https://doi.org/10.3390/w13030351 -
Pörtner, H. O.; Scholes, R. J.; Agard, J.; Archer, E.; Arneth, A.; Bai, X.; Barnes, D.; Burrows, M.; Chan, L.; Cheung, W.L.; Diamond, S.; Donatti, C.; Duarte, C.; Eisenhauer, N.; Foden, W.; Gasalla, M. A.; Handa, C.; Hickler, T.; Hoegh-Guldberg, O.; Ichii, K.; Jacob, U.; Insarov, G.; Kiessling, W.; Leadley, P.; Leemans, R.; Levin, L.; Lim, M.; Maharaj, S.; Managi, S.; Marquet, P. A.; McElwee, P.; Midgley, G.; Oberdorff, T.; Obura, D.; Osman, E.; Pandit, R.; Pascual, U.; Pires, A. P. F.; Popp, A.; Reyes-García, V.; Sankaran, M.; Settele, J.; Shin, Y. J.; Sintayehu, D. W.; Smith, P.; Steiner, N.; Strassburg, B.; Sukumar, R.; Trisos, C.; Val, A. L.; Wu, J.; Aldrian, E.; Parmesan, C.; Pichs-Madruga, R.; Roberts, D. C.; Rogers, A. D.; Díaz, S.; Fischer, M.; Hashimoto, S.; Lavorel, S.; Wu, N.; Ngo, H. T. IPBES-IPCC co-sponsored workshop report on biodiversity and climate change. Intergovernmental Science-Policy Platform on Biodiversity and Ecosystem Services and IPCC, v.10, e242343254, 2021. https://doi.org/10.5281/zenodo.5101125
» https://doi.org/10.5281/zenodo.5101125 -
Rattis, L.; Brando, P. M.; Macedo, M. N.; Spera, S.; Castanho, A. D. A.; Marques, E. Q.; Costa, N. Q.; Silvério, D. V.; Coe, M. T. Climatic limit for agriculture in Brazil. Nature Climate Change, v.11, p.1098-1104, 2021. https://doi.org/10.1038/s41558-021-01214-3
» https://doi.org/10.1038/s41558-021-01214-3 -
Santos, L. O. F. dos; Machado, N. G.; Biudes, M. S.; Geli, H. ME.; Querino, C.; Ruhoff, A.; Ivo, I. O.; Lotufo Neto, N. Trends in precipitation and air temperature extremes and their relationship with sea surface temperature in the Brazilian midwest. Atmosphere, v.14, e426, 2023. https://doi.org/10.3390/atmos14030426
» https://doi.org/10.3390/atmos14030426 -
Silva, G. M. da.; Dallacort, R.; Andrea, M. C. da S.; Queiroz, T. M. Suitable weather condition frequency for fungicide soybean application in Tangará da Serra, Mato Grosso, Brazil. Revista Ceres, v.68, p.245-256, 2021. https://doi.org/10.1590/0034-737X202168040001
» https://doi.org/10.1590/0034-737X202168040001 -
Souza, A. P.; Mota, L. L.; Zamadei, T.; Martin, C. C.; Almeida, F. T.; Paulino, J. Climate classification and climatological water balance in the state of Mato Grosso. Nativa, v.1, p.34-43, 2013. https://doi.org/10.31413/nativa.v1i1.1334
» https://doi.org/10.31413/nativa.v1i1.1334 - Souza, M. D.; Dallacort, R.; de Moraes Dias, V. R.; Fenner, W.; Tieppo, R. C.; Oliveira, G. C. Análise da precipitação e identificação de eventos de seca em municípios do Oeste de Mato Grosso por meio dos índices SPEI-3 e SPEI-6. Nativa, v.12, p.706-715, 2024.
-
Thom, H. C. S. A note on the gamma distribution. Monthly weather review, v.86, p.117-122, 1958. https://doi.org/10.1175/1520-0493(1958)086<0117:ANOTGD>2.0.CO;2
» https://doi.org/10.1175/1520-0493(1958)086<0117:ANOTGD>2.0.CO;2
There are no supplementary sources.


