
 Previsão exacta do carbono orgânico do solo utilizando técnicas espectroscópicas e aprendizado de máquina
O carbono orgânico do solo é um indicador importante para avaliar a qualidade e condição do solo. Sua estimativa pode ser realizada por meio de espectroscopia de imagem hiperespectral na faixa do visível e do infravermelho próximo (VNIR). Este estudo teve como objetivo avaliar o potencial das técnicas espectroscópicas para prever com precisão o teor de carbono orgânico do solo (SOC), comparando com medições diretas no campo com amostras processadas em laboratório. A eficiência e a confiabilidade dessa abordagem foram avaliadas. Foi efectuada uma análise exploratória rigorosa dos dados (EDA) para identificar as principais caraterísticas espectrais e minimizar o ruído. O SVM superou consistentemente outros algoritmos de aprendizagem de máquina, demonstrando elevada precisão e confiabilidade. Conclui-se que o modelo foi calibrado muito bem no terreno, o que constitui um avanço para a ciência, uma vez que a espetroscopia oferece uma alternativa rápida, econômica e não destrutiva aos métodos laboratoriais tradicionais para a avaliação de solos. Isto tem implicações significativas para a agricultura sustentável e para a monitorização da saúde do solo, uma vez que permite uma avaliação em tempo hábil e exata das reservas de carbono do solo.
Palavras-chave:
espectroscopia; SOC; máquina de vetor de suporte; saúde do solo
 Thumbnail
 Thumbnail
 Thumbnail
 Thumbnail
 Thumbnail
 Thumbnail
 Thumbnail
 Thumbnail
 Thumbnail
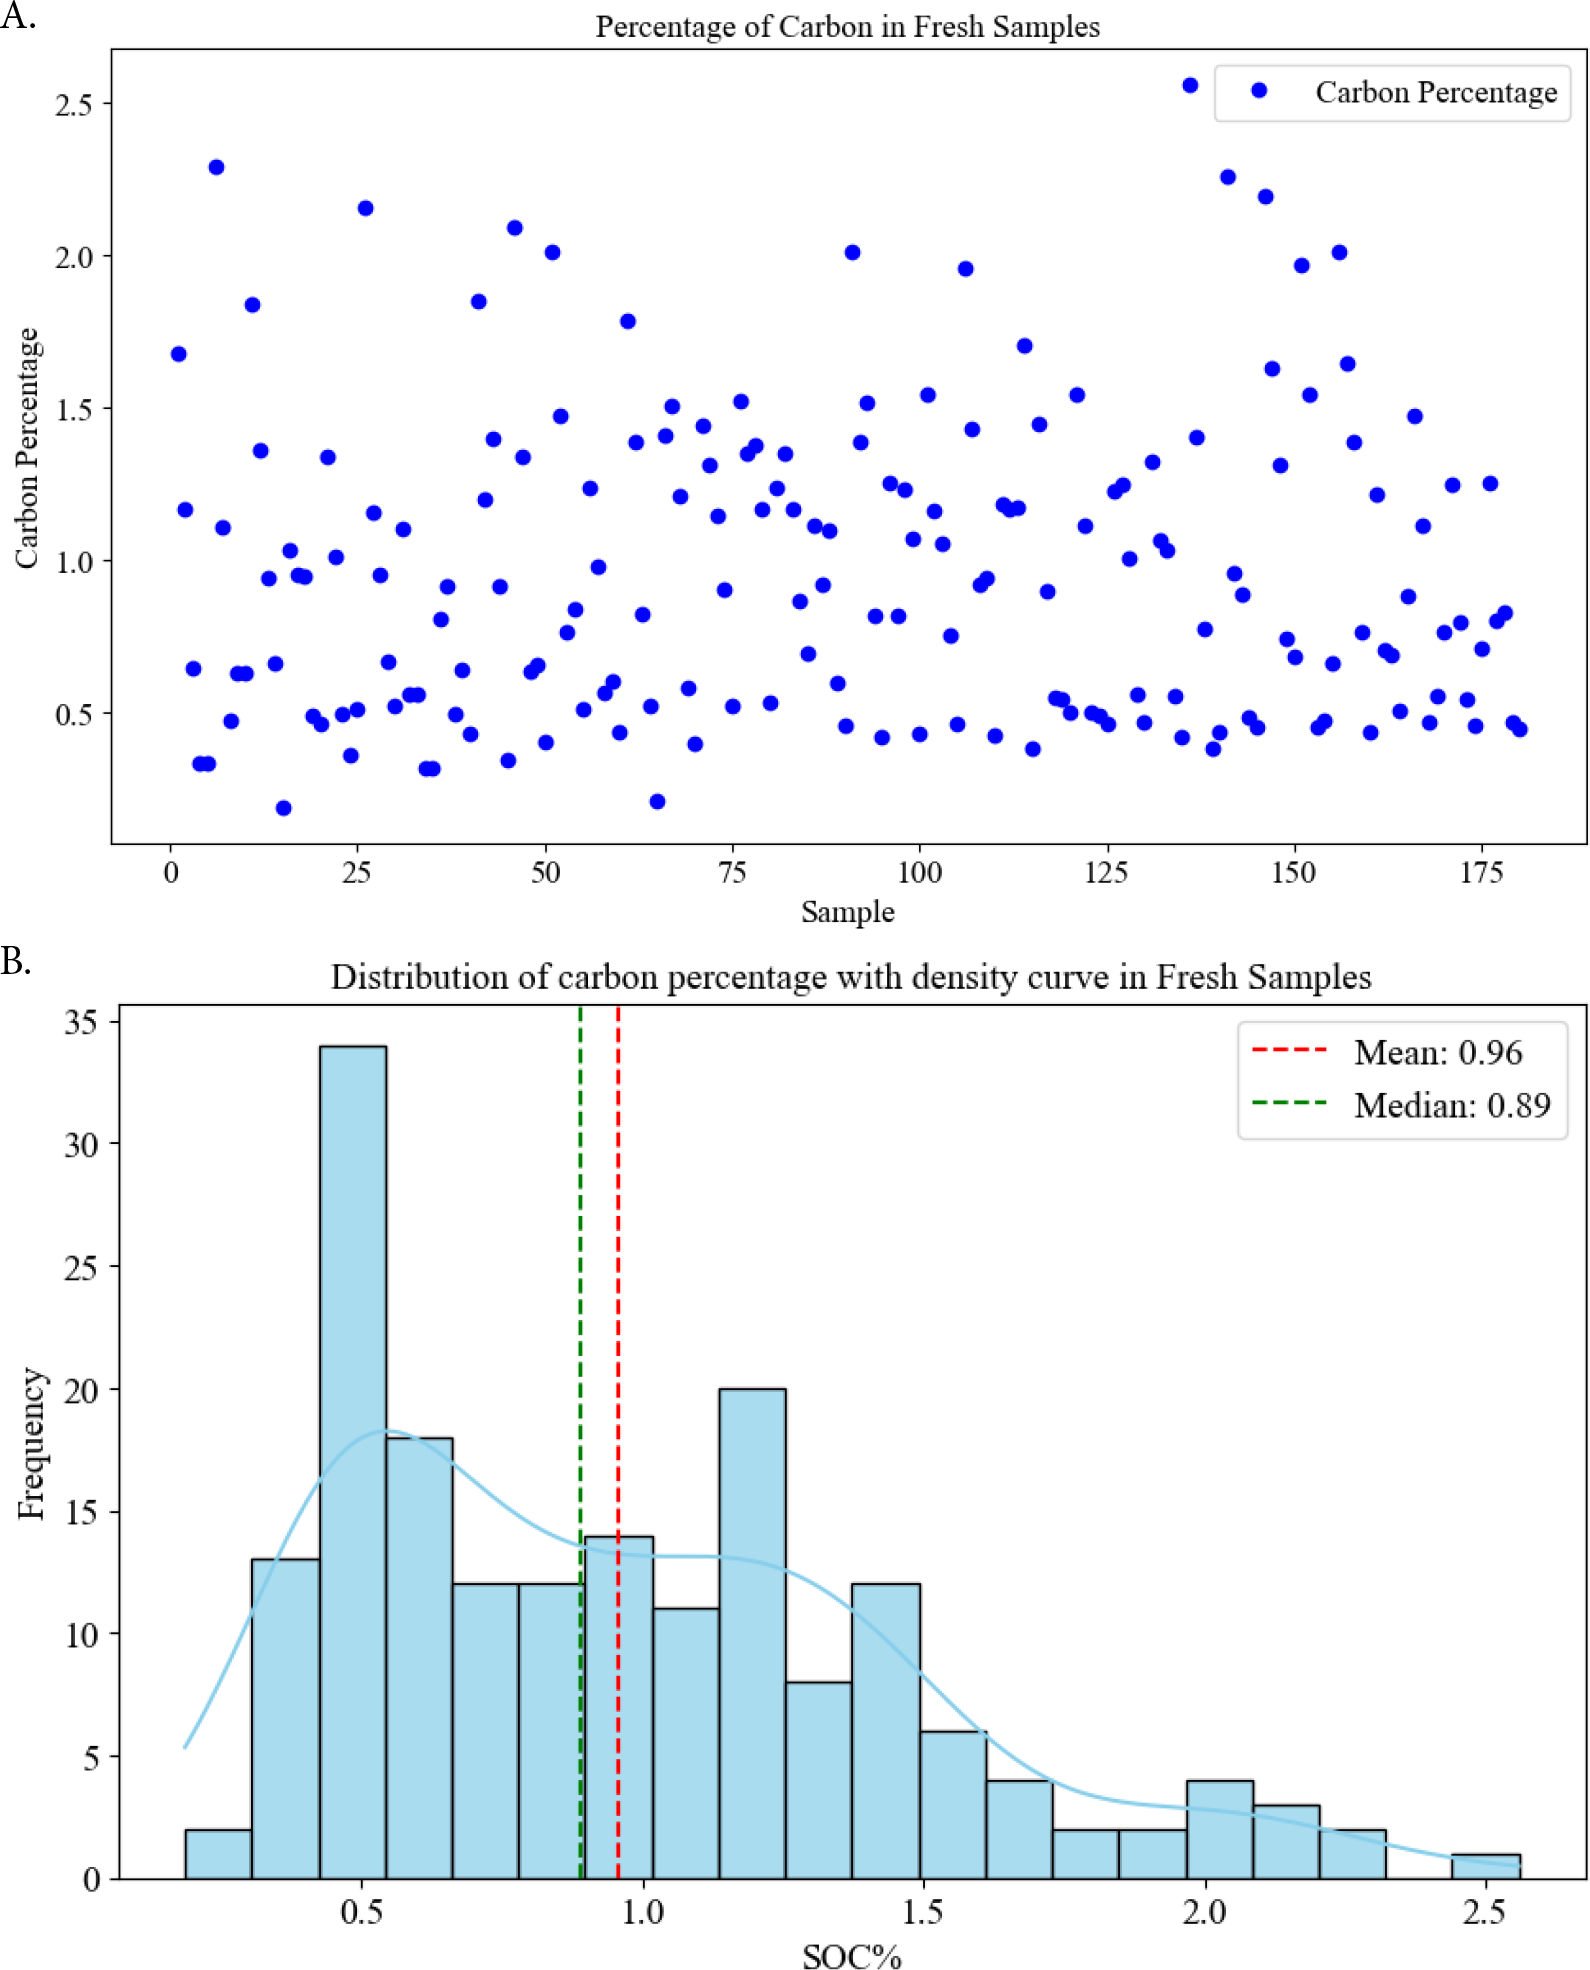 SOC - Soil Organic Carbon. Scatter diagram showing the distribution of carbon percentage across individual soil samples. Each blue dot represents the carbon percentage of a distinct soil sample. Frequency distribution of Soil Organic Carbon (SOC%) in fresh soil samples overlaid with a density curve. The dashed red line indicates the mean carbon percentage, while the dashed green line represents the median carbon percentage
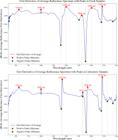
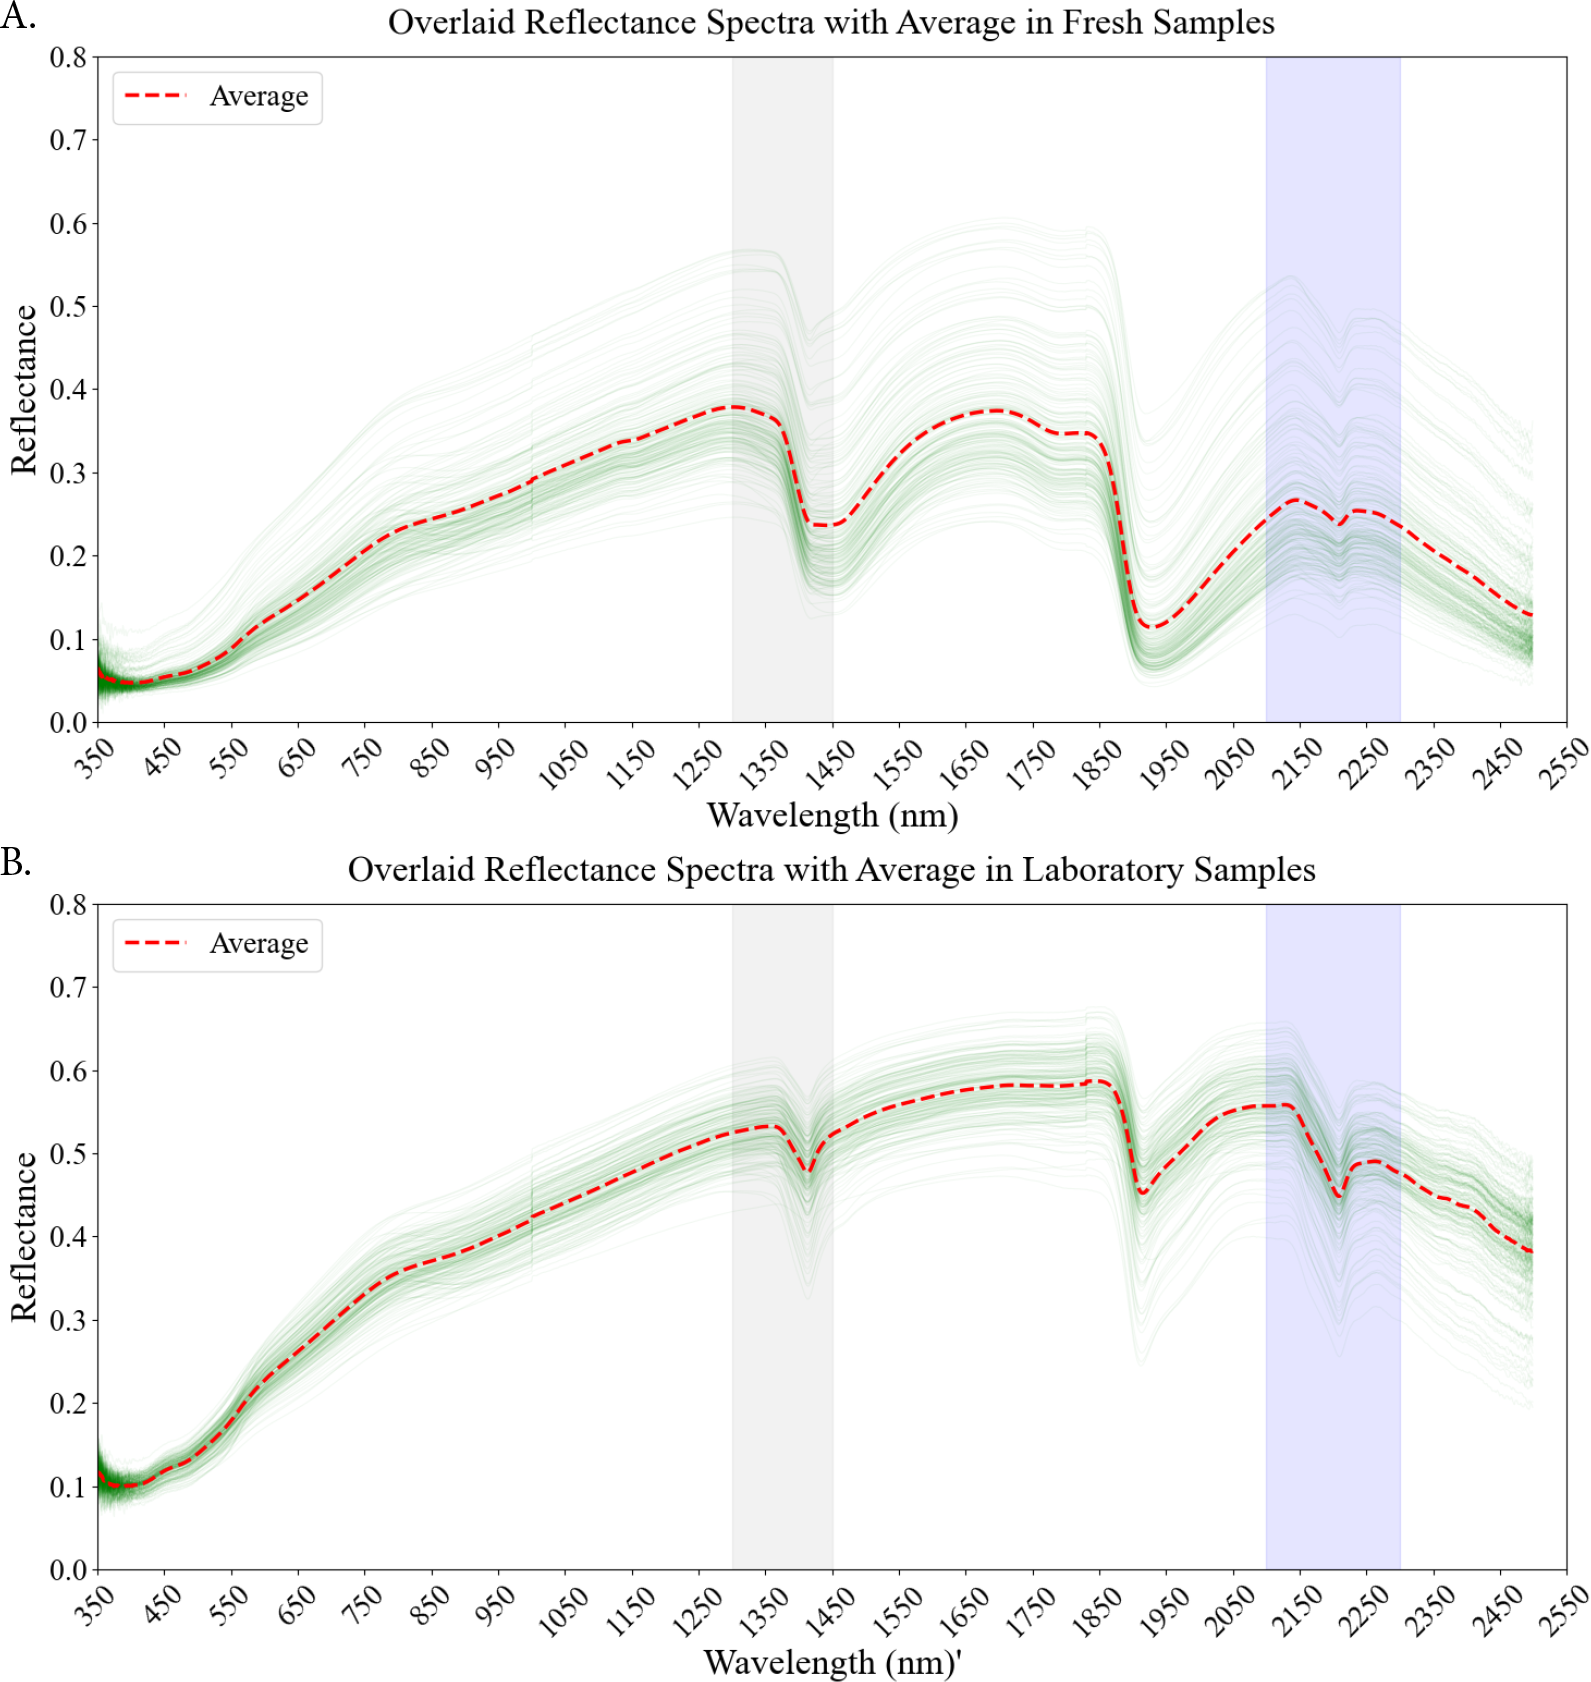 A. Reflectance spectra acquired from average fresh soil samples (collected in the field). The individual lines represent the reflectance spectrum for each fresh sample, showing how much light was reflected at different wavelengths (visible to near-infrared range). The average spectrum (thicker line) is overlaid to represent the general spectral characteristics and trends of the fresh samples within the dataset. B. Reflectance spectra obtained from the laboratory soil samples (drying, grinding, and sieving to standardize the sample condition). Each line corresponds to the reflectance spectrum of a laboratory-prepared sample, illustrating how light is reflected across different wavelengths. The average spectrum (thicker line) is overlaid to show the laboratory-processed samples’ overall spectral signature and central tendency. The vertical gray band, typically associated with organic matter, lies within the 1300-1450 nm range, while the vertical purple band, also linked to organic matter in previous studies, spans the 2100-2300 nm range
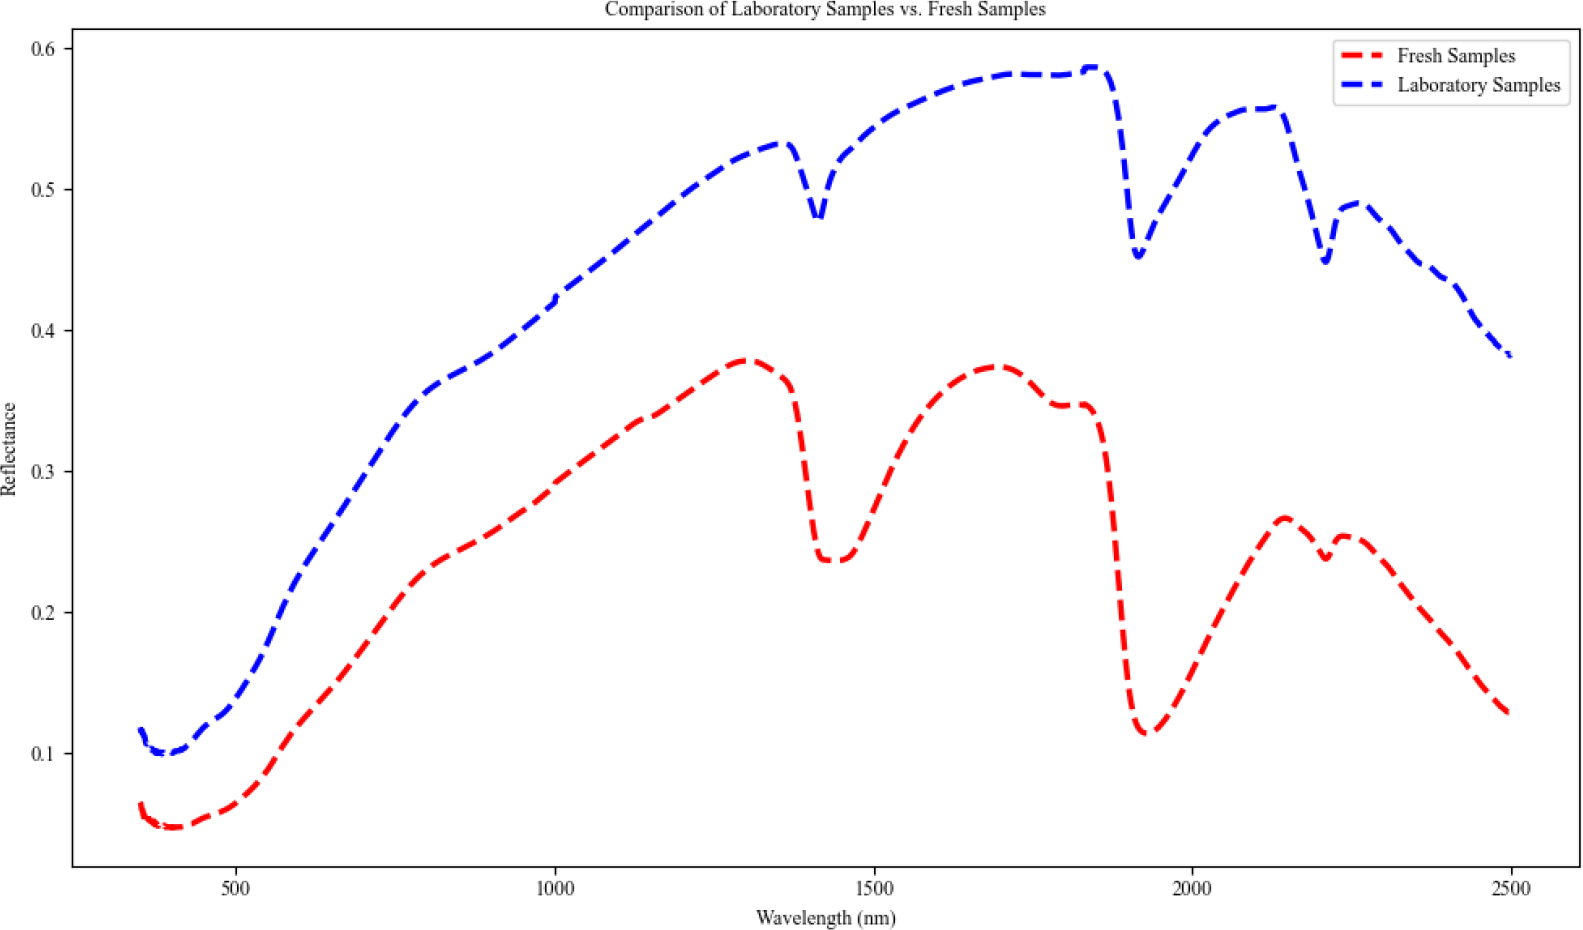

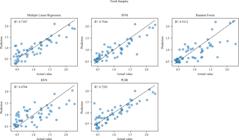
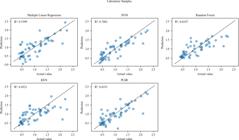
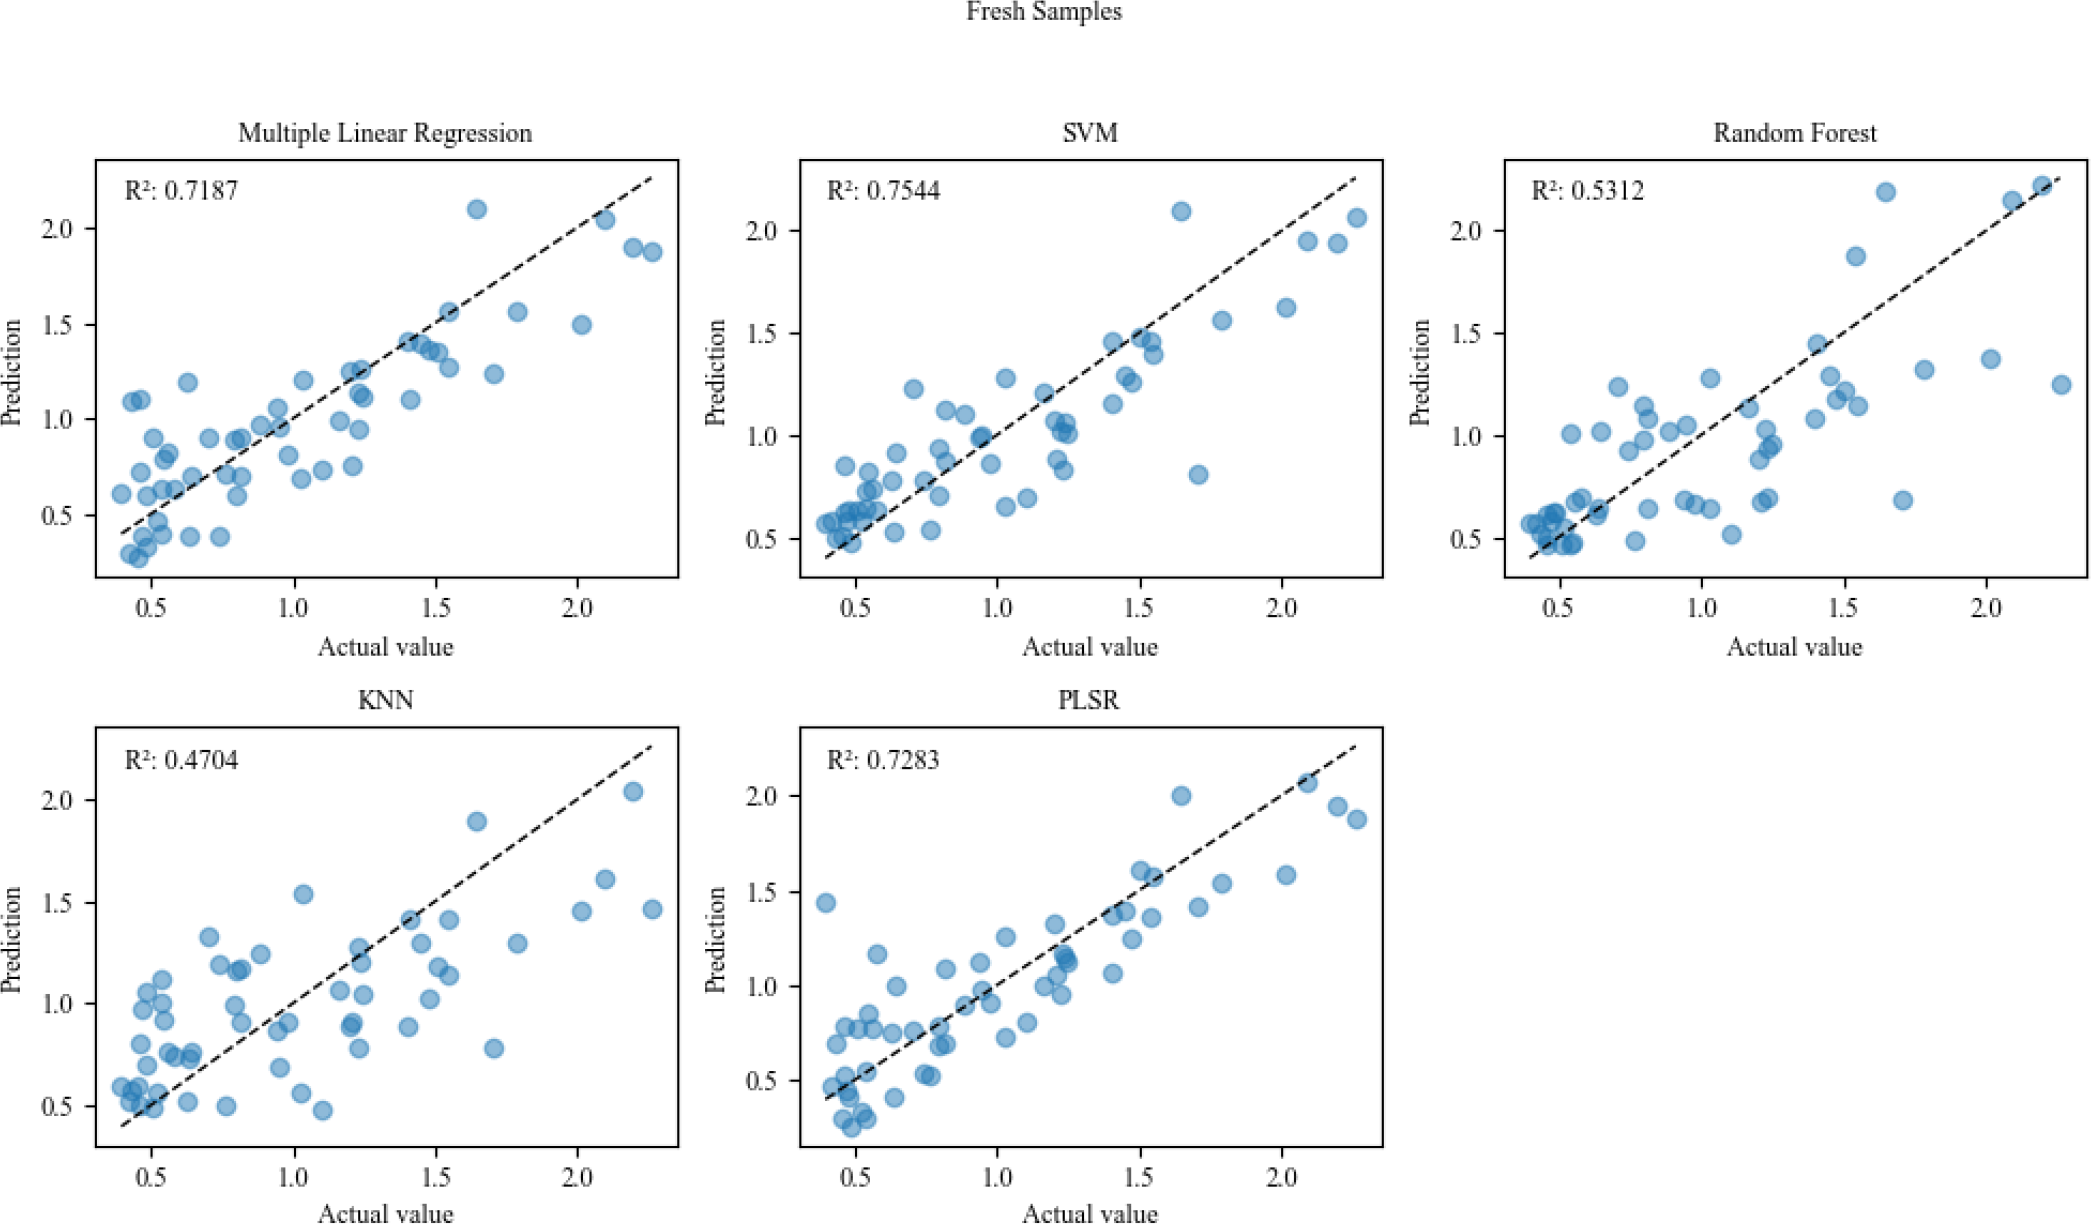 R2 - Coefficient of determination; SVM - Support Vector Machine; KNN - K-Nearest Neighbors and PLSR - Partial Least Squares Regression
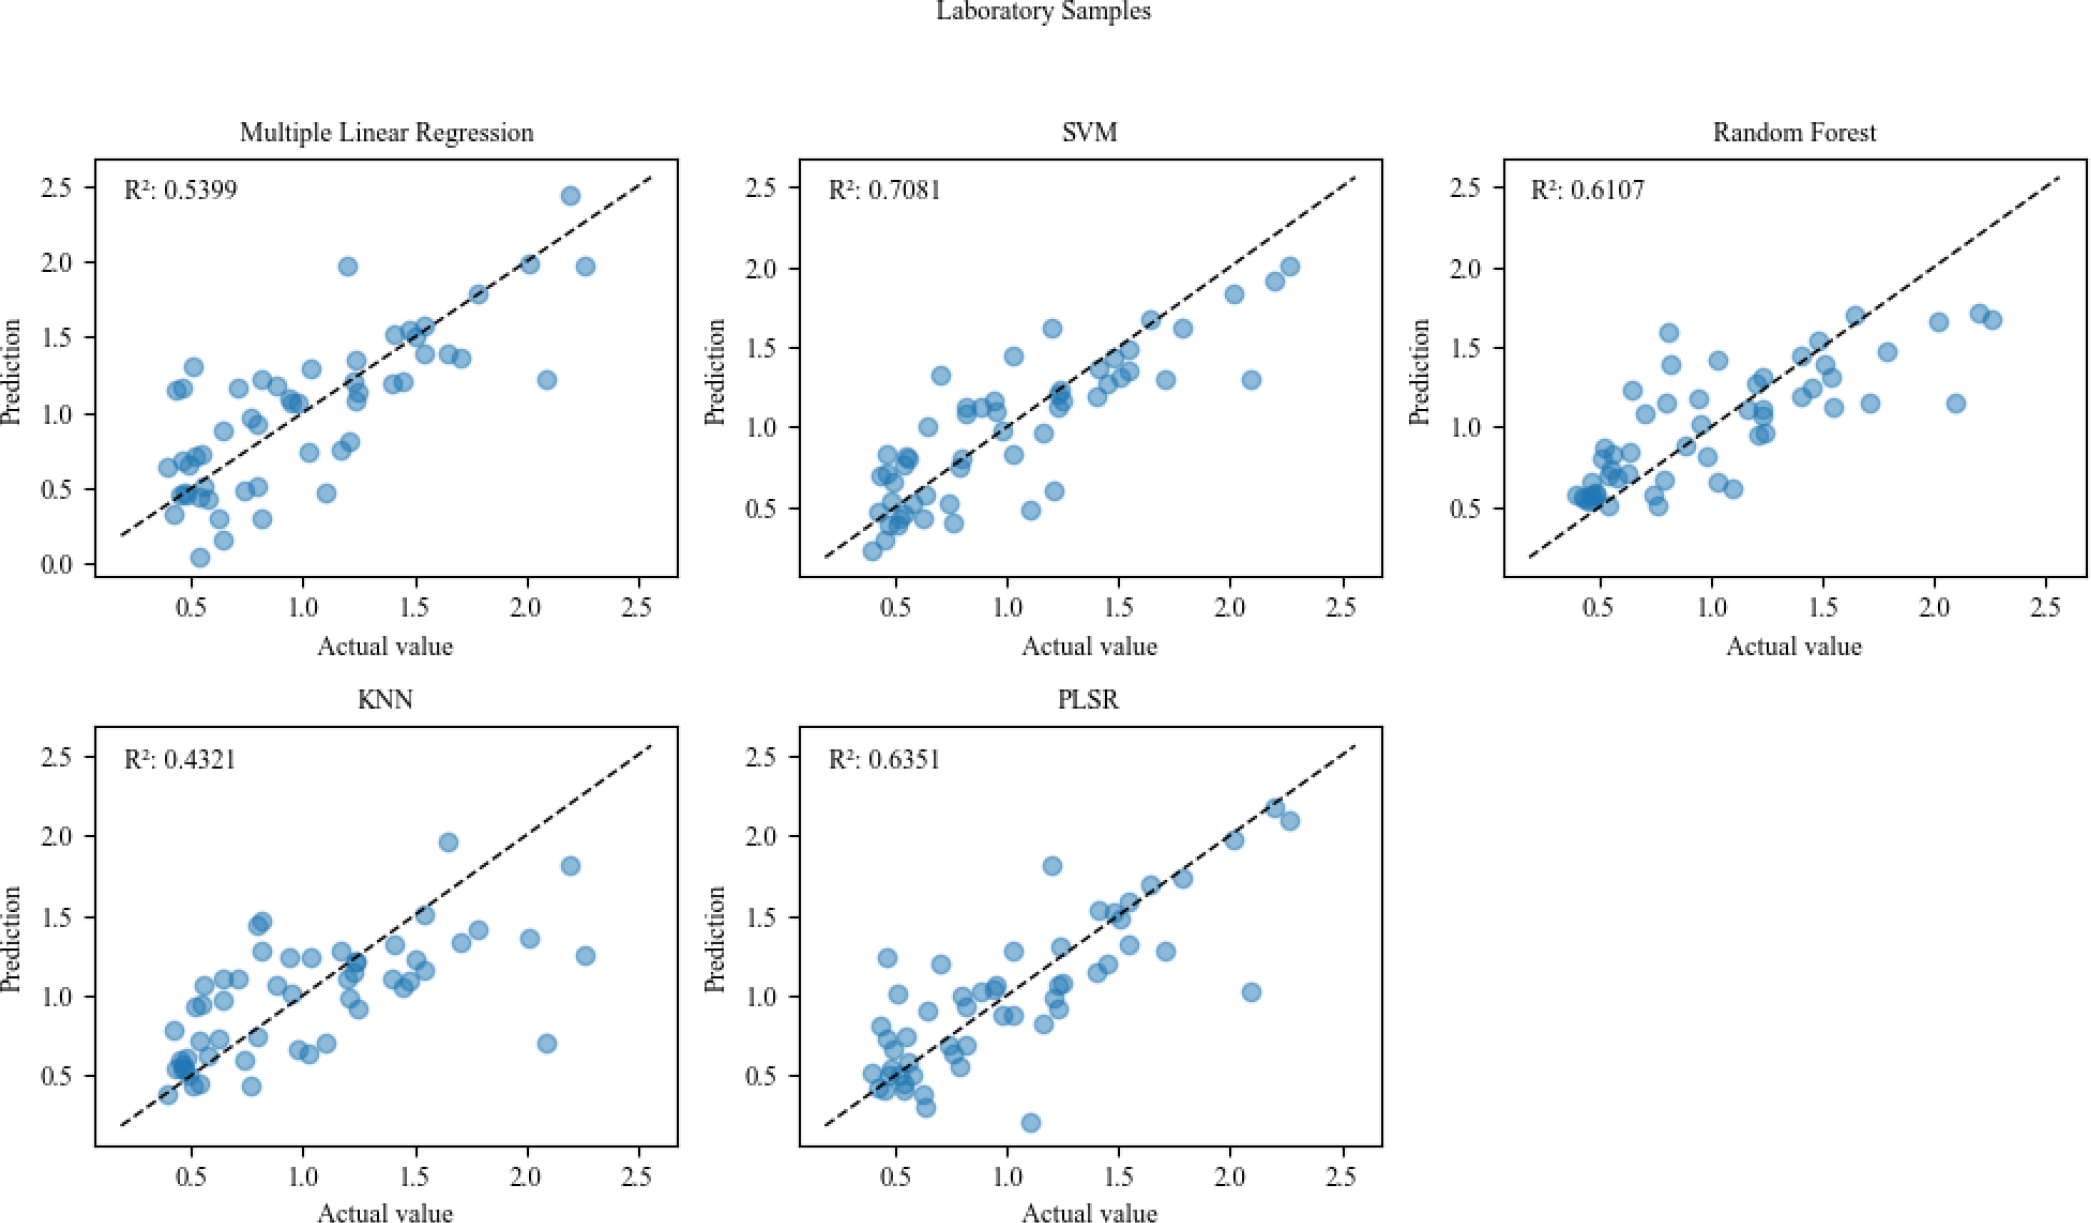 R2 - Coefficient of determination; SVM - Support Vector Machine; KNN - K-Nearest Neighbors and PLSR - Partial Least Squares Regression
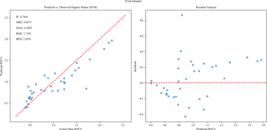
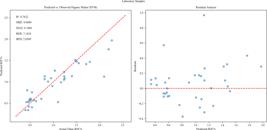
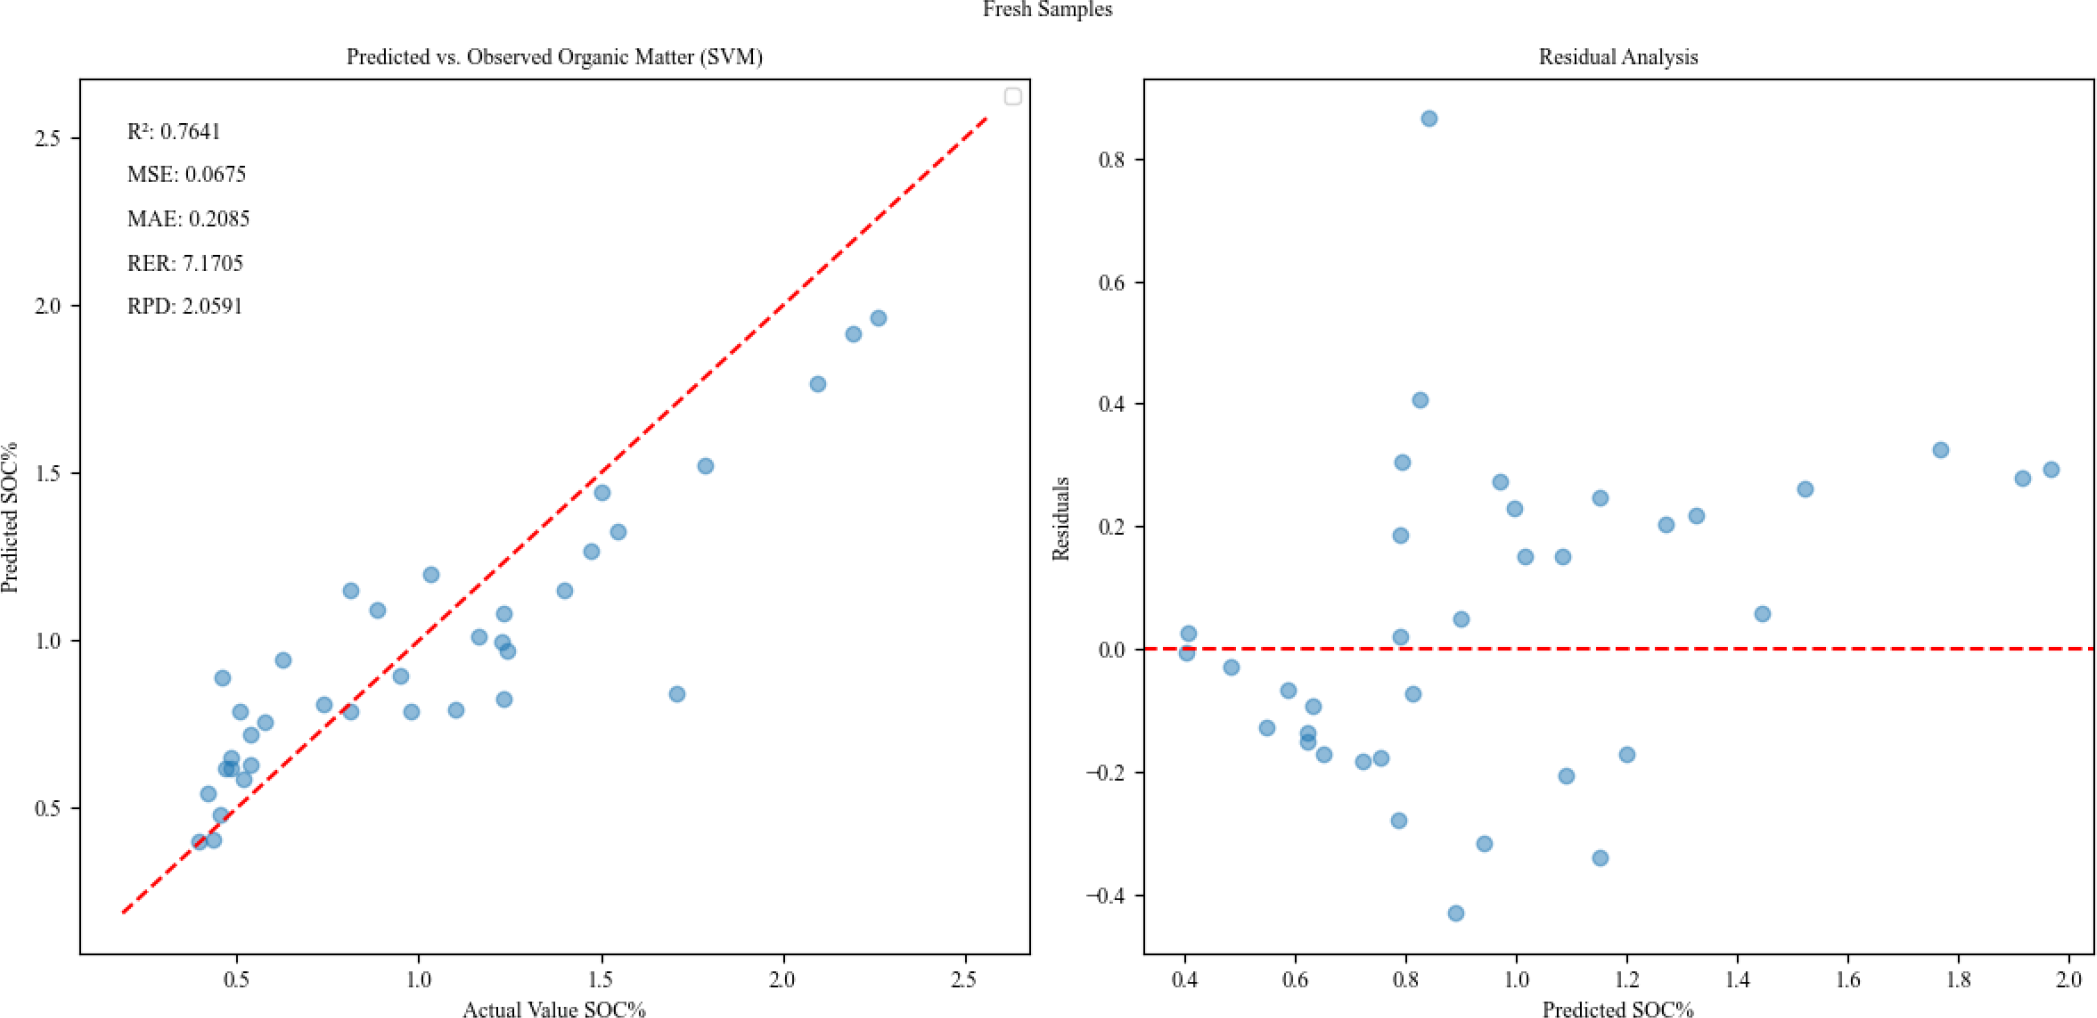 R2 - Coefficient of Determination; MSE - Mean Squared Error; MAE - Mean Absolute Error; RER - Range Error Ratio and RPD - Ratio of Performance to Deviation
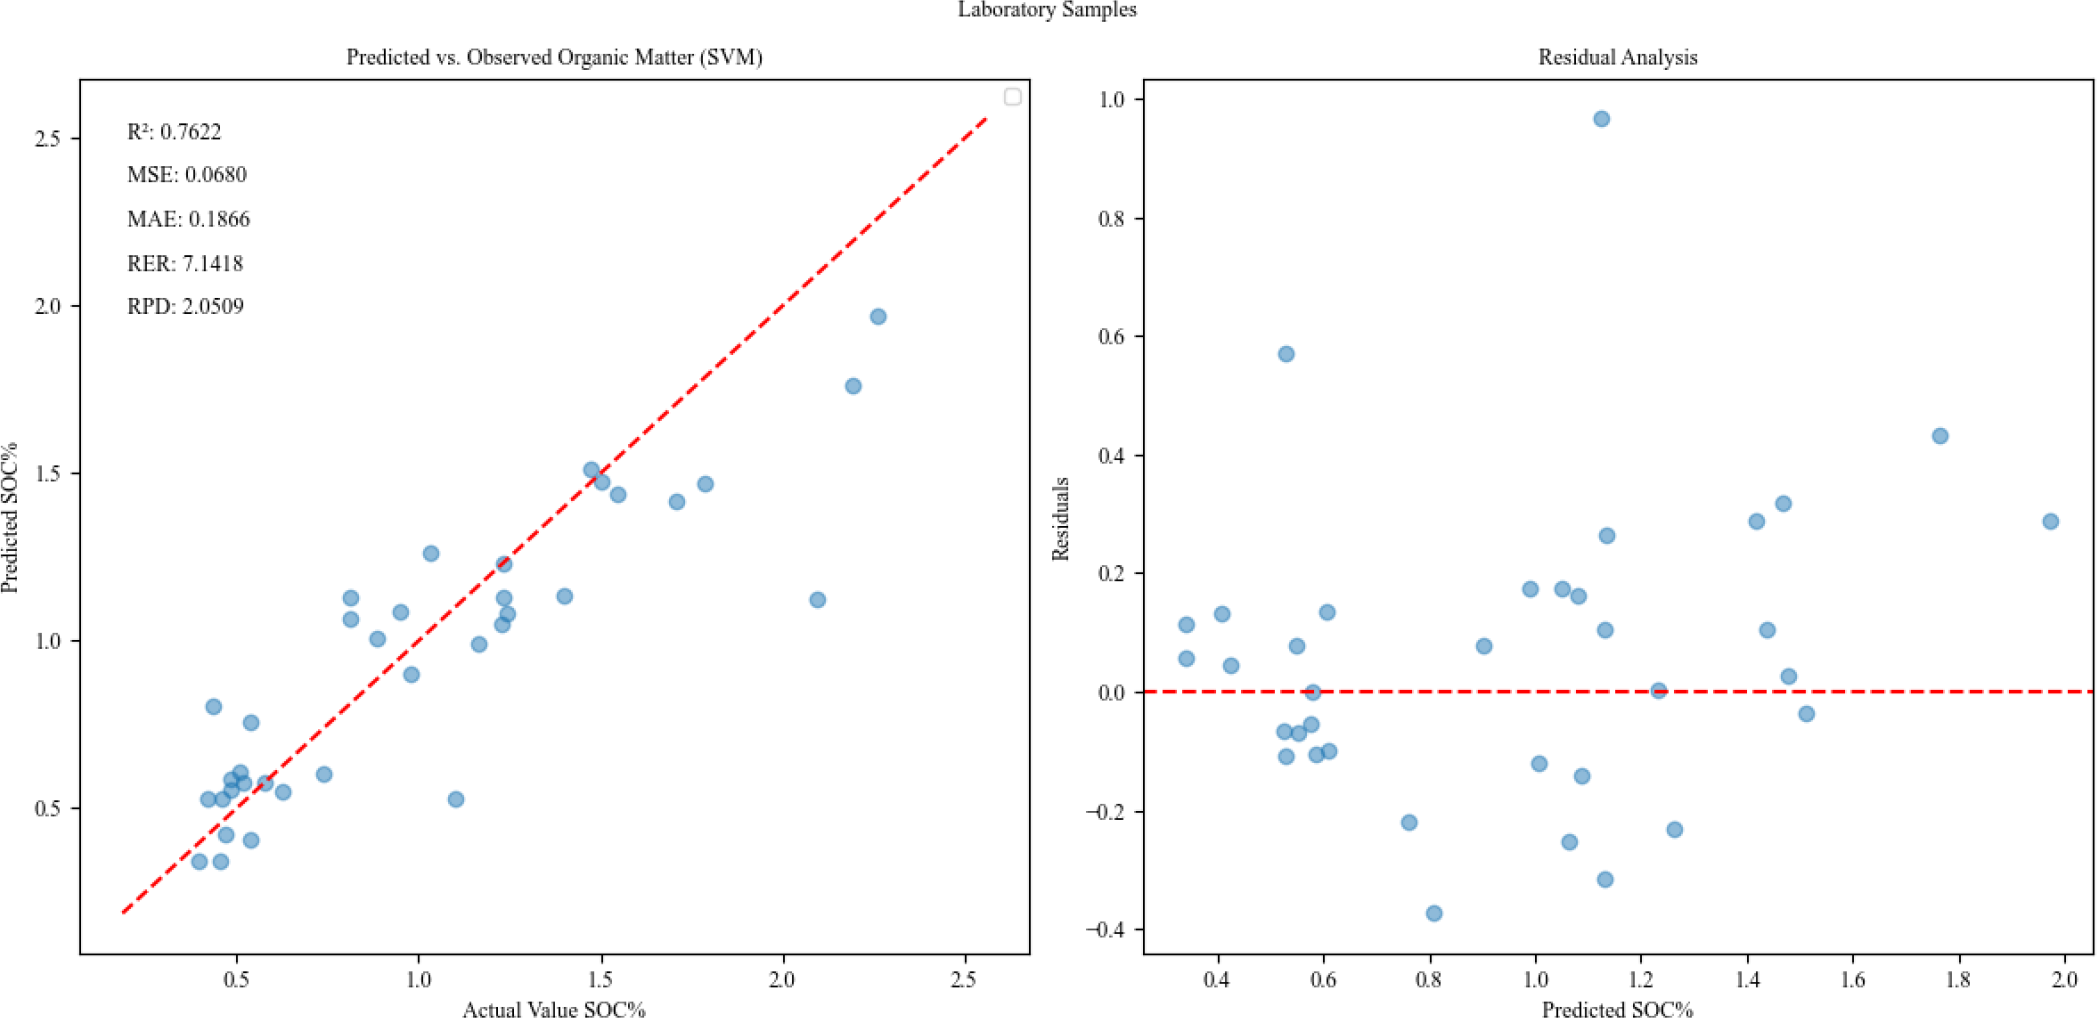 R2 - Coefficient of Determination; MSE - Mean Squared Error; MAE - Mean Absolute Error; RER - Range Error Ratio and RPD - Ratio of Performance to Deviation