
 Accurate prediction of soil organic carbon using spectroscopic techniques and machine learning
ABSTRACT
Soil organic carbon is a key indicator for assessing soil quality and condition. Its estimation can be conducted through hyperspectral imaging spectroscopy within the visible and near-infrared (VNIR) range. This study aimed to evaluate the potential of spectroscopic techniques to accurately predict soil organic carbon (SOC) content by comparing direct field measurements with laboratory-processed samples. The efficiency and reliability of this approach were assessed. A rigorous exploratory data analysis (EDA) was conducted to identify key spectral features and minimize noise. Support vector machine (SVM) consistently outperformed other machine learning algorithms, demonstrating high accuracy and reliability. It is concluded that the model has been calibrated very well in the field, a breakthrough for science; spectroscopy offers a rapid, cost-effective and non-destructive alternative to traditional laboratory methods for SOC assessment. This has significant implications for sustainable agriculture and soil health monitoring, allowing for timely and accurate assessment of soil carbon stocks.
Key words:
spectroscopy; SOC; support vector machine; soil health
HIGHLIGHTS
An innovative method to estimate soil carbon content without traditional laboratory procedures.
A reliable predictive model for preliminary soil classification and trend detection.
A safe and sustainable approach that eliminates the use of hazardous chemicals.
RESUMO
O carbono orgânico do solo é um indicador importante para avaliar a qualidade e condição do solo. Sua estimativa pode ser realizada por meio de espectroscopia de imagem hiperespectral na faixa do visível e do infravermelho próximo (VNIR). Este estudo teve como objetivo avaliar o potencial das técnicas espectroscópicas para prever com precisão o teor de carbono orgânico do solo (SOC), comparando com medições diretas no campo com amostras processadas em laboratório. A eficiência e a confiabilidade dessa abordagem foram avaliadas. Foi efectuada uma análise exploratória rigorosa dos dados (EDA) para identificar as principais caraterísticas espectrais e minimizar o ruído. O SVM superou consistentemente outros algoritmos de aprendizagem de máquina, demonstrando elevada precisão e confiabilidade. Conclui-se que o modelo foi calibrado muito bem no terreno, o que constitui um avanço para a ciência, uma vez que a espetroscopia oferece uma alternativa rápida, econômica e não destrutiva aos métodos laboratoriais tradicionais para a avaliação de solos. Isto tem implicações significativas para a agricultura sustentável e para a monitorização da saúde do solo, uma vez que permite uma avaliação em tempo hábil e exata das reservas de carbono do solo.
Palavras-chave:
espectroscopia; SOC; máquina de vetor de suporte; saúde do solo
Introduction
Soil organic carbon (SOC) is a vital component of soil health, influencing essential chemical, physical, and biological processes (Ashida et al., 2021). As a key indicator of soil degradation and fertility, SOC provides valuable insights into soil quality. However, despite its importance, SOC remains a complex and poorly understood component of the soil system (Yang et al., 2022). Initially derived from plant, microbial, and animal residues, secretions, and soil humus, SOC is a significant carbon sink, making it a major constituent of organic matter (Ashida et al., 2021; Du et al., 2022).
The determination of SOC involves differentiating between total carbon and inorganic carbon (Oliveira et al., 2019), necessitating the consideration of additional inorganic carbon content in the soil (Shamrikova et al., 2023). Two primary methods are employed for this: dry combustion and wet oxidation (Murindangabo et al., 2023). The Walkley-Black (WB) method, a wet oxidation technique, is widely used for SOC determination (Vaudour et al., 2022). This method involves adding an acidic potassium dichromate solution to the soil sample (Shamrikova et al., 2022; Guillén et al., 2023; Murindangabo et al., 2023). However, it has several drawbacks, including the use of large quantities of hazardous reagents, generation of toxic waste, time-consuming analysis, and high cost (Okolo et al., 2019; Barrezueta-Unda et al., 2020; González-Aguiar et al., 2020; Reyna-Bowen et al., 2020; Shamrikova et al., 2022).
To address the limitations of conventional methods, spectroscopic methods have gained prominence. These physical analysis techniques study the interaction between electromagnetic waves and soil samples, allowing for the quantification of soil characteristics (Barra et al., 2021; Di Martino & Garcia, 2022). Visible and near-infrared spectroscopy (VIS-NIR) is particularly effective and costefficient for measuring SOC (Liu et al., 2019). VIS-NIR spectroscopy was developed to reduce the time and cost associated with conventional techniques (Alomar et al., 2022; Reyna-Bowen et al., 2025). It has proven to be efficient, productive, and environmentally friendly, enabling effective management of spatial variability in soil properties (Gozukara et al., 2021; Mendes et al., 2022; Bai et al., 2023; Zhao et al., 2023).
While VIS-NIR models have shown promise in aligning with conventional WB methods, most research focuses on controlled laboratory conditions (Gholizadeh et al., 2020; Thomas et al., 2021). Direct field application presents challenges due to environmental factors. This study aimed to evaluate the potential of spectroscopic techniques to accurately predict soil organic carbon (SOC) content by comparing direct field measurements with laboratory-processed samples.
Material and Methods
The study was conducted on an experimental farm in Hinojosa del Duque, Córdoba, Spain, at 543 m above sea level. The site features a “Dehesa” pasture system with young Holm oaks (Quercus ilex) planted in a 12 m × 12 m grid at a density of 70 trees per ha. The area receives 437 mm of rainfall annually and has an average temperature of 15.1 °C. The pasture is grazed by Merino sheep at a stocking rate of three sheep per ha. In 2016, the pasture was fertilized with 40 kg of P₂O₅ ha-1.
Four soil pits were dug in 2017, two in each area, starting near the tree trunk and extending beyond the tree crown projection. Undisturbed soil samples were collected at four soil layers (0-5, 5-10, 10-20, and 20-30 cm) using a hand soil sampler. A total of 180 soil samples were collected for subsequent analysis.
Soil samples were dried at 40 ºC, passed through a 2 mm sieve, and homogenized. SOC concentration was determined according to Walkley (1947). The results of SOC content are shown in Table 1.
Mean of soil organic carbon (SOC), standard deviation (Std. Dev.), coefficient of variation (CV), median, minimum
(Min.), and maximum (Max.) values
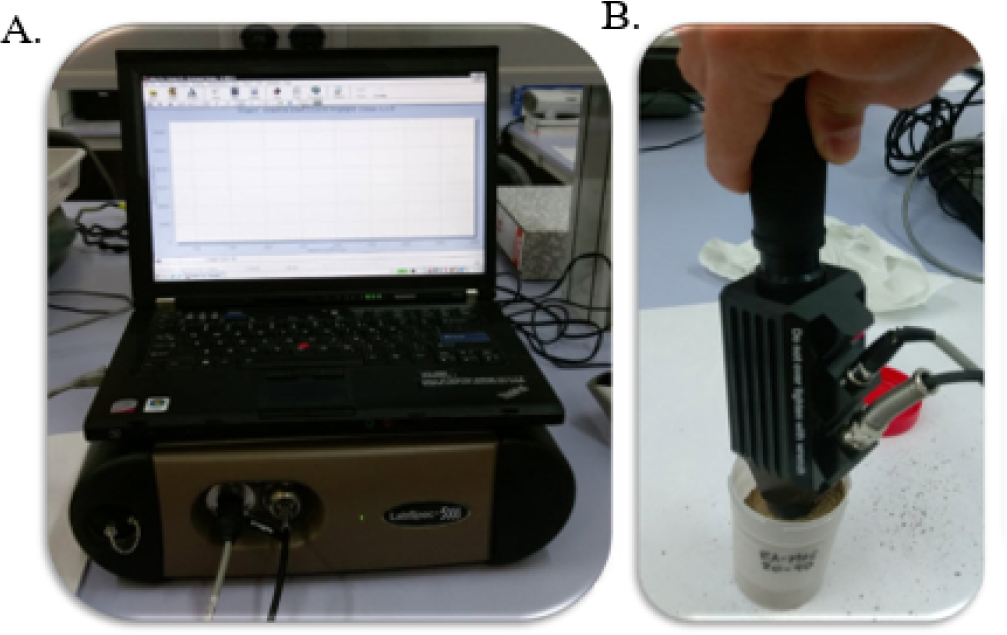
Soil samples collected for laboratory analysis were scanned using a portable LabSpec 5000 spectrometer in the 350-2500 nm wavelength range. A contact probe was employed to acquire spectral measurements, with four consecutive scans recorded per sample. A Spectralon white reference panel was measured every 50 samples during the scanning session to account for potential instrumental drift and compute the reflectance factor. The reflectance factor was calculated as the ratio of the spectral response of the sample to that of the white reference. This methodology aligns with the procedure described by Salgado et al. (2025), who utilized a Spectralon panel to calibrate the spectroradiometer before and after each session, performing calibration every 20 spectral acquisitions.
The other group scanned, which was taken directly in the soil profile, at the same depth as the samples were taken for laboratory analysis with the mobile equipment. These measurements reflected actual field moisture conditions during the spring season, close to field capacity.
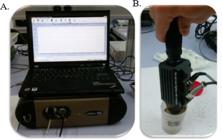
The collected spectra were processed using WinISI IV software. The raw spectral data were interpolated to 1 nm intervals and averaged to obtain a single spectrum for each sample. The spectrophotometer is a portable, post-dispersive NIR analyzer with a resolution of 1 nm at 700 nm and 10 nm at 1400/2100 nm. Three scans were averaged for each spectrum using a direct-contact sensor for each soil property (Figure 1).
An exploratory data analysis was conducted using Python to gain insights into the data. The datasets were clear, strong, and free from significant outliers. Spectral data, spanning the 350-2500 nm wavelength range, were extracted and visualized to understand the spectral characteristics of the samples.
By comparing the average spectra of the two datasets, distinct spectral signatures were observed, potentially attributable to laboratory processing. These spectral differences may be exploited to develop predictive models for predicting SOC content with higher accuracy and precision. Specific spectral regions, particularly between 350-550 nm and 23002500 nm, were identified as introducing noise and reducing the signal-to-noise ratio. To improve the accuracy and reliability of subsequent analyses, these noisy spectral regions were removed from further consideration, resulting in a more improved spectral clarity and consistency dataset for model development.
To gain a comprehensive understanding of the dataset, an EDA was conducted. This involved examining the distribution of variables, identifying outliers, and assessing the relationships between different parameters (Hidalgo, 2019). The dataset consisted of samples from various locations, with one subset undergoing preliminary laboratory processing and another collected directly from the field. Through EDA, potential data quality issues were addressed, ensuring the reliability of subsequent analyses.
The datasets, each comprising 180 samples and 2154 spectral features, were sourced from a specific location in Spain. The first dataset represents samples in their fresh state, directly collected from the field. The second dataset corresponds to the same samples after undergoing a laboratory processing step.
A diverse range of machine learning algorithms, including K-Nearest Neighbors (KNN), Random Forest (RF), Support Vector Machines (SVM), Partial Least Squares Regression (PLSR), and Multiple Linear Regression (MLR), were considered for predicting SOC content from spectroscopic data (Vite et al., 2020). However, SVM was selected as the main algorithm due to its proven effectiveness in handling complex and high-dimensional data sets, followed by PLSR, which has high dimensionality and can extract meaningful information from spectral data.
To train and evaluate the data set, the machine learning models, a 70/30 split was used, assigning 70% of the samples to training and 30% for testing. The regression models (KNN, RF, SVM, PLSR, and MLR) were implemented with the following configurations: KNN with five nearest neighbors, RF with 100 decision trees, SVM with a radial basis kernel and a regularization parameter, that is, ten components, PLSR with 15 latent components and MLR without additional parameters. Also, 5-partition cross-validation (K-Fold Cross-Validation) was performed on the training set. The models were evaluated using the mean squared error (MSE), the mean absolute error (MAE), and the coefficient of determination (R2) to assess their predictive performance. A random seed of 42 was set to ensure reproducibility of the results.
The selected machine learning algorithms were trained and evaluated using appropriate performance metrics such as the coefficient of determination (R2) and mean square error (MSE). In addition, the validation models Range Error Ratio (RER) and Ratio of Performance to Deviation (RPD) Eqs. 1 and 2, commonly used in spectroscopy calibration analysis, were employed to assess the quality of the predictions (Estupiñán et al., 2021). The most efficient algorithm for SOC prediction was identified by comparing the different models’ performance. This approach provides a fast and accurate method for estimating SOC content, allowing agronomists to make informed decisions and optimize agricultural practices (Reyna-Bowen et al., 2025).
where:
RER - Range Error Ratio;
Min - Minimum value;
Max - Maximum value; and,
SEC - Standard error of calibration.
where:
RPD - Ratio of performance to deviation;
SD - Standard deviation; and,
SEC - Standard error of calibration.
According to established guidelines, RPD values below 2.0 are qualified as “very poor” and discourage the use of the model. Values between 2.0 and 2.49 are considered “poor”, and limited to rough screening tasks. A RPD of 2.5 to 2.99 is classified as “acceptable”, and suitable for basic screening applications. Values between 3.0 and 3.49 are considered “good” and suitable for quality control, while those from 3.5 to 4.09 are rated as “very good”, and suitable for process control. Finally, models with a RPD of 4.1 or higher are rated as “excellent”, allowing their application in any scenario. This classification system ensures the proper selection and application of prediction models according to their calibration performance (Table 2).
Results and Discussion
Both Laboratory-processed and fresh soil samples (Figure 2) display a similar, non-uniform distribution of organic carbon. A mean of 0.96 was obtained, with a skewness of 0.7974, indicating a slight positive skewness, which shows that more values are concentrated in the lower range with a longer tail to the right. The kurtosis of 0.1084 indicates that the distribution is meso-kurtic, in other words, similar to the normal distribution in terms of the concentration of extreme values. Most values cluster between 0.5 and 1.5%, with a small number of outliers reaching 2% or higher. This indicates that the Laboratory processing techniques did not significantly affect the overall variability in organic carbon content, suggesting that the Laboratory samples represent the original fresh samples.

Variability and central tendency of Soil Organic Carbon (SOC) content in the analyzed samples
The main finding is illustrated in Figure 3. The signatures from fresh soil are dispersed in comparison to the lab signature. This dispersion is much more likely to be due to the humidity of the soil without having been treated or processed as the soil processed in the Laboratory. Likewise, humidity can play a fundamental role in causing the spectral signature to suffer a change and the model to fail to calibrate with the reference values. However, there is a dispersion in the spectral signatures of Laboratory origin. In this case, this dispersion can be assumed by the organic carbon content at the different soil layers because the soil sample was homogenized before taking the spectral signature. Therefore, the model was adjusted with a cut of the extremes to reduce the noise of the database analyzed for the calibration of the model. The scientific literature has documented that different spectral ranges are associated with specific soil properties, such as mineral content and organic matter. In particular, wavelengths between 400 and 600 nm show a significant correlation with organic matter, as evidenced by the selection of visible bands (520-580 nm) in spectral reflectance studies (Henderson et al., 1989). Other works associate it up to the 1001 nm range (Liu et al., 2023). This range variability can also be related to the clay content of the soil.

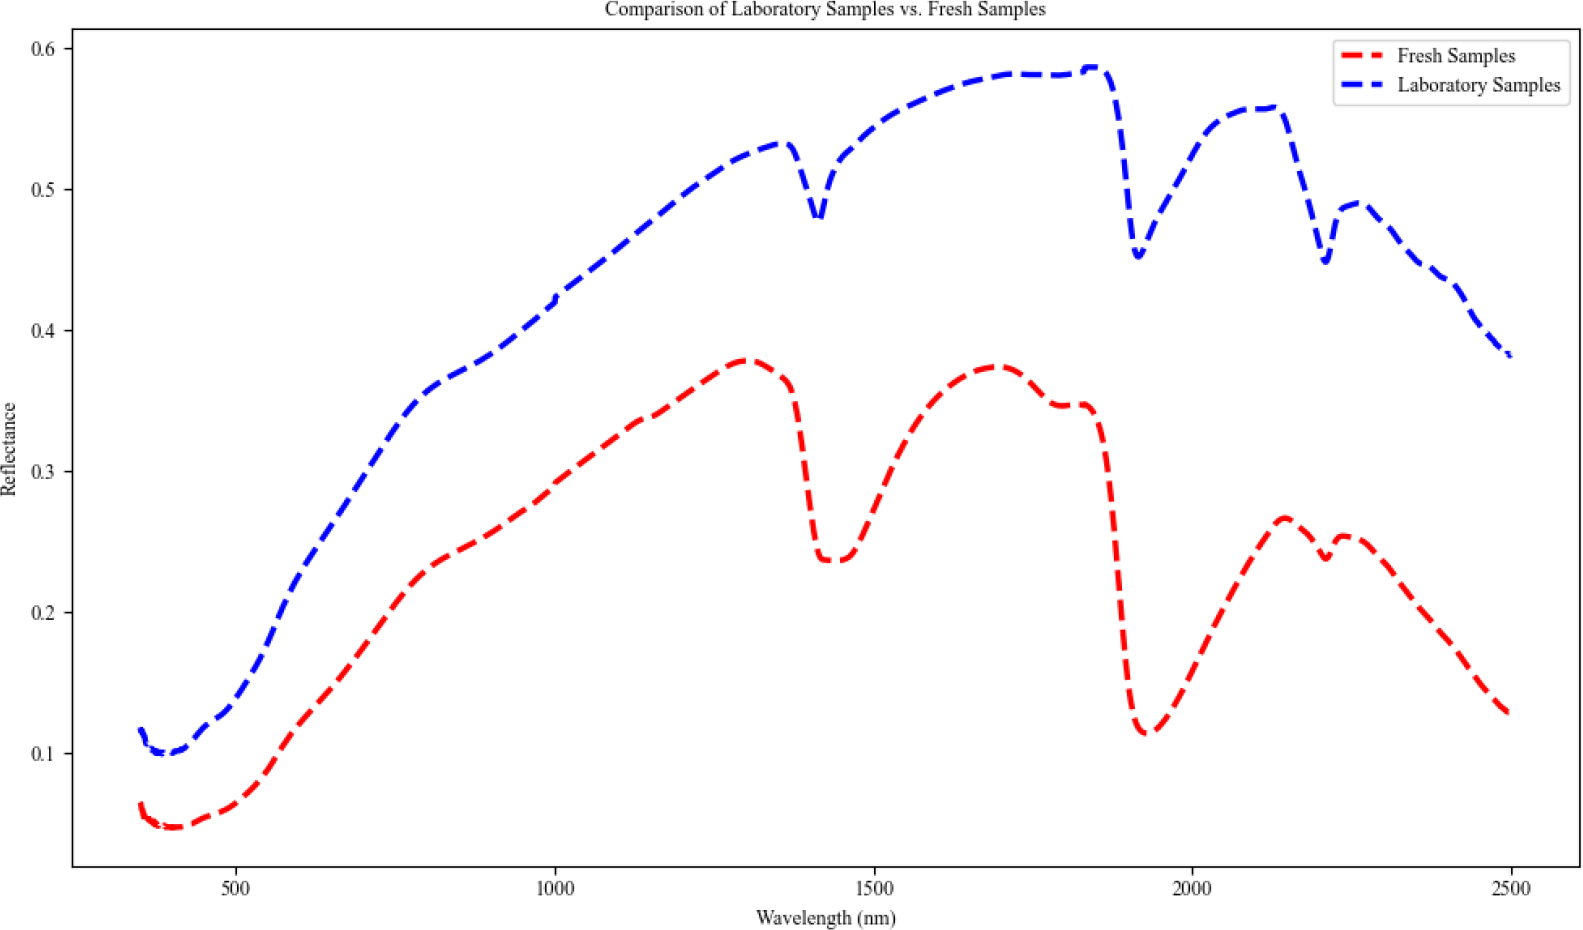
Fresh Samples have higher spectral values than Laboratory samples (Figure 4). This means that fresh samples have a higher spectral intensity in the measured range due to storage, processing, and treatment conditions.

Comparison of the two databases of spectral profiles of soil samples fresh samples (red line) and Laboratory samples (blue line) (350-2500 nm)
The first derivative of the mean reflectance spectrum was calculated further to investigate the spectral differences between the two sample types. This technique is commonly employed to enhance subtle spectral features and minimize the influence of baseline variations (Chinilin et al., 2023). Moreover, derivative spectroscopy has proven valuable as an independent quantitative technique and an effective preprocessing step for the subsequent application of chemometric methods (Frost, 1999).
Figure 5 shows the resulting peaks in the first derivative spectra, which may be associated with specific physical and chemical properties of the soil samples, including those affected by Laboratory processing (Bou-Orm et al., 2020). Well-defined peaks are observed in the derivative spectra, some of which are commonly attributed to specific chemical bonds-for instance, in the spectral regions between 4100-4500 cm⁻1 and 51005300 cm⁻1, where organic chemical bonds tend to dominate (Russell et al., 2019). These spectral features could potentially be leveraged to develop more accurate models for predicting soil organic carbon content using spectroscopic techniques.
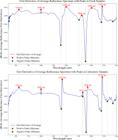
First derivative of the average reflectance spectrum highlighting peak regions. (A) Fresh soil samples measured in the field; (B) laboratory-processed soil samples
The peak wavelengths and corresponding local maxima (positive peaks) from the first derivative of the reflectance spectra, derived from both fresh and Laboratory-processed soil samples, are presented in Table 3. These peaks represent significant spectral features that may be associated with specific soil properties and Laboratory processing effects.
Positive peak values (local maxima) from the first derivative of the mean reflectance spectra in soil samples
A rigorous exploratory data analysis (EDA) was crucial for identifying key spectral features and potential noise sources. By focusing on the most informative spectral regions and excluding noisy bands, as suggested by previous studies (Esquivel-Valenzuela et al., 2018; Shen et al., 2020; Xu et al., 2021), the model’s performance was significantly enhanced.
It was performed a comparative analysis of various machine learning algorithms, including KNN, RF, SVM, and PLSR (Khosravi et al., 2021; Biney et al., 2022; Wang et al., 2023).
On the fresh sample database, in the cross-validation on the training set, the PLSR model presented the best performance with a R2 of 0.7181, followed by SVM with 0.6995 and Random Forest with 0.6589. RLM achieved a R2 of 0.657, while KNN presented the lowest value of 0.5964, suggesting a less accurate fit to the training data. As for the error metrics, PLSR obtained the lowest MSE, 0.0667, and the lowest MAE, 0.1962, indicating predictions closer to the real values. SVM also performed well, with a MSE of 0.0712 and a MAE of 0.2119. In contrast, KNN obtained the worst results, with a MSE of 0.0956 and a MAE of 0.2421, which suggests a higher margin of error.
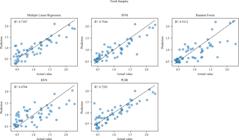
In the evaluation of the test set (Figure 6), the model that stood out is SVM with a R2 of 0.7544, followed by PLSR with 0.7283, both maintaining a satisfactory performance similar to that of the training data. RLM obtained a R2 of 0.7187, showing a solid performance on the test data. On the contrary, Random Forest and KNN presented the worst performances on the test set, with R2 of 0.5312 and 0.4704, respectively, showing that they have a lower generalization ability. As for the error metrics, SVM obtained the lowest MSE of 0.0621 and MAE of 0.1966, followed by PLSR with a MSE of 0.0687 and MAE of 0.2001. KNN showed the highest MSE of 0.134 and the highest MAE of 0.2998, indicating a higher error in model predictions.
In the Laboratory samples, during cross-validation on the training set, the PLSR model showed the best performance with a R2 of 0.6467, followed by SVM with 0.6117 and Random Forest with 0.4417. RLM achieved a R2 of 0.5273, while KNN obtained the lowest value of 0.3449, which means that the fit is less accurate on the training data. As for the error metrics, PLSR obtained the lowest values for MSE and MAE (0.0837 and 0.2086). SVM also showed satisfactory performance with a MSE of 0.0919 and a MAE of 0.2287. KNN obtained the worst results, with a MSE of 0.1551 and a MAE of 0.2978.
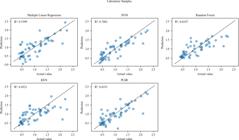
In the test set (Figure 7), SVM stood out with a R2 of 0.7081, followed by PLSR with 0.6351. The RLM achieved a R2 of 0.5399, indicating a moderate predictive performance. In comparison, Random Forest yielded a higher R2 of 0.6107, while KNN showed a lower value of 0.4321. These results suggest that, among the models tested, Random Forest demonstrated the strongest generalization capacity on the test dataset. As for the error metrics in the test set, SVM presented a MSE of 0.0738 and a MAE of 0.2118, followed by PLSR with a MSE of 0.0923 and a MAE of 0.2122. KNN showed the highest MSE of 0.1436 and the highest MAE of 0.2842, showing a greater prediction error.
Considering these results obtained in field and Laboratory samples, SVM emerged as the most effective model for predicting soil organic carbon content. The PLSR model also showed satisfactory performance, especially in the Laboratory samples, where it obtained a R2 of 0.6351 and presented the lowest MSE in both data sets.
The SVM model exhibited satisfactory predictive performance, showing superior performance in SOC prediction, coinciding with previous research highlighting its ability to capture nonlinear relationships and handle highdimensional data effectively (Zhang et al., 2024). It has even been recognized as an efficient regressor in small data sets, reinforcing its applicability in limited-sample contexts (Zhang et al., 2024). Similarly, SVM-R has shown higher RPD values than PLSR (Sarkar et al., 2020).
On the other hand, it is important to note that in other investigations, the RF model has been chosen as the most suitable for predicting SOC due to its ability to capture nonlinear interactions in carbon cycle processes, obtaining consistent and acceptable R2 and RMSE values (Carbajal et al., 2024). In this study, RF was the algorithm that showed the worst performance compared to the other models evaluated, indicating that the effectiveness of each model can be influenced by various extrinsic and intrinsic factors (Yao et al., 2020), from fertilizer use to soil composition, organic matter, moisture and spectral characteristics of the data analyzed.
Proceeded to train the Support Vector Regression Machines (SVR) model, a variant of SVM focused on spectroscopic data. The data set was split by 80% for training and 20% for testing. In addition, a normalization was performed using StandardScaler, to ensure that the variables have a mean of 0 and a standard deviation of 1 to have better numerical stability. To reduce the dimensionality of the data, a Principal Component Analysis (PCA) was performed, in which 50 principal components were retained. The optimization of the hyperparameters included regularization by the C parameter with a range of 0.1, 1, 5, 10, 50, 100, 500, and gamma adjustment of 0.1, 0.01, 0.001, 0.0001, 0.00001, was conducted using RandomizedSearchCV, with five-fold cross-validation and 15 iterations. The selection of these hyperparameters was performed by maximizing the coefficient of determination (R2) using the full processing power of the computer, which allowed several tasks to run at the same time and accelerated the search for the best parameters.
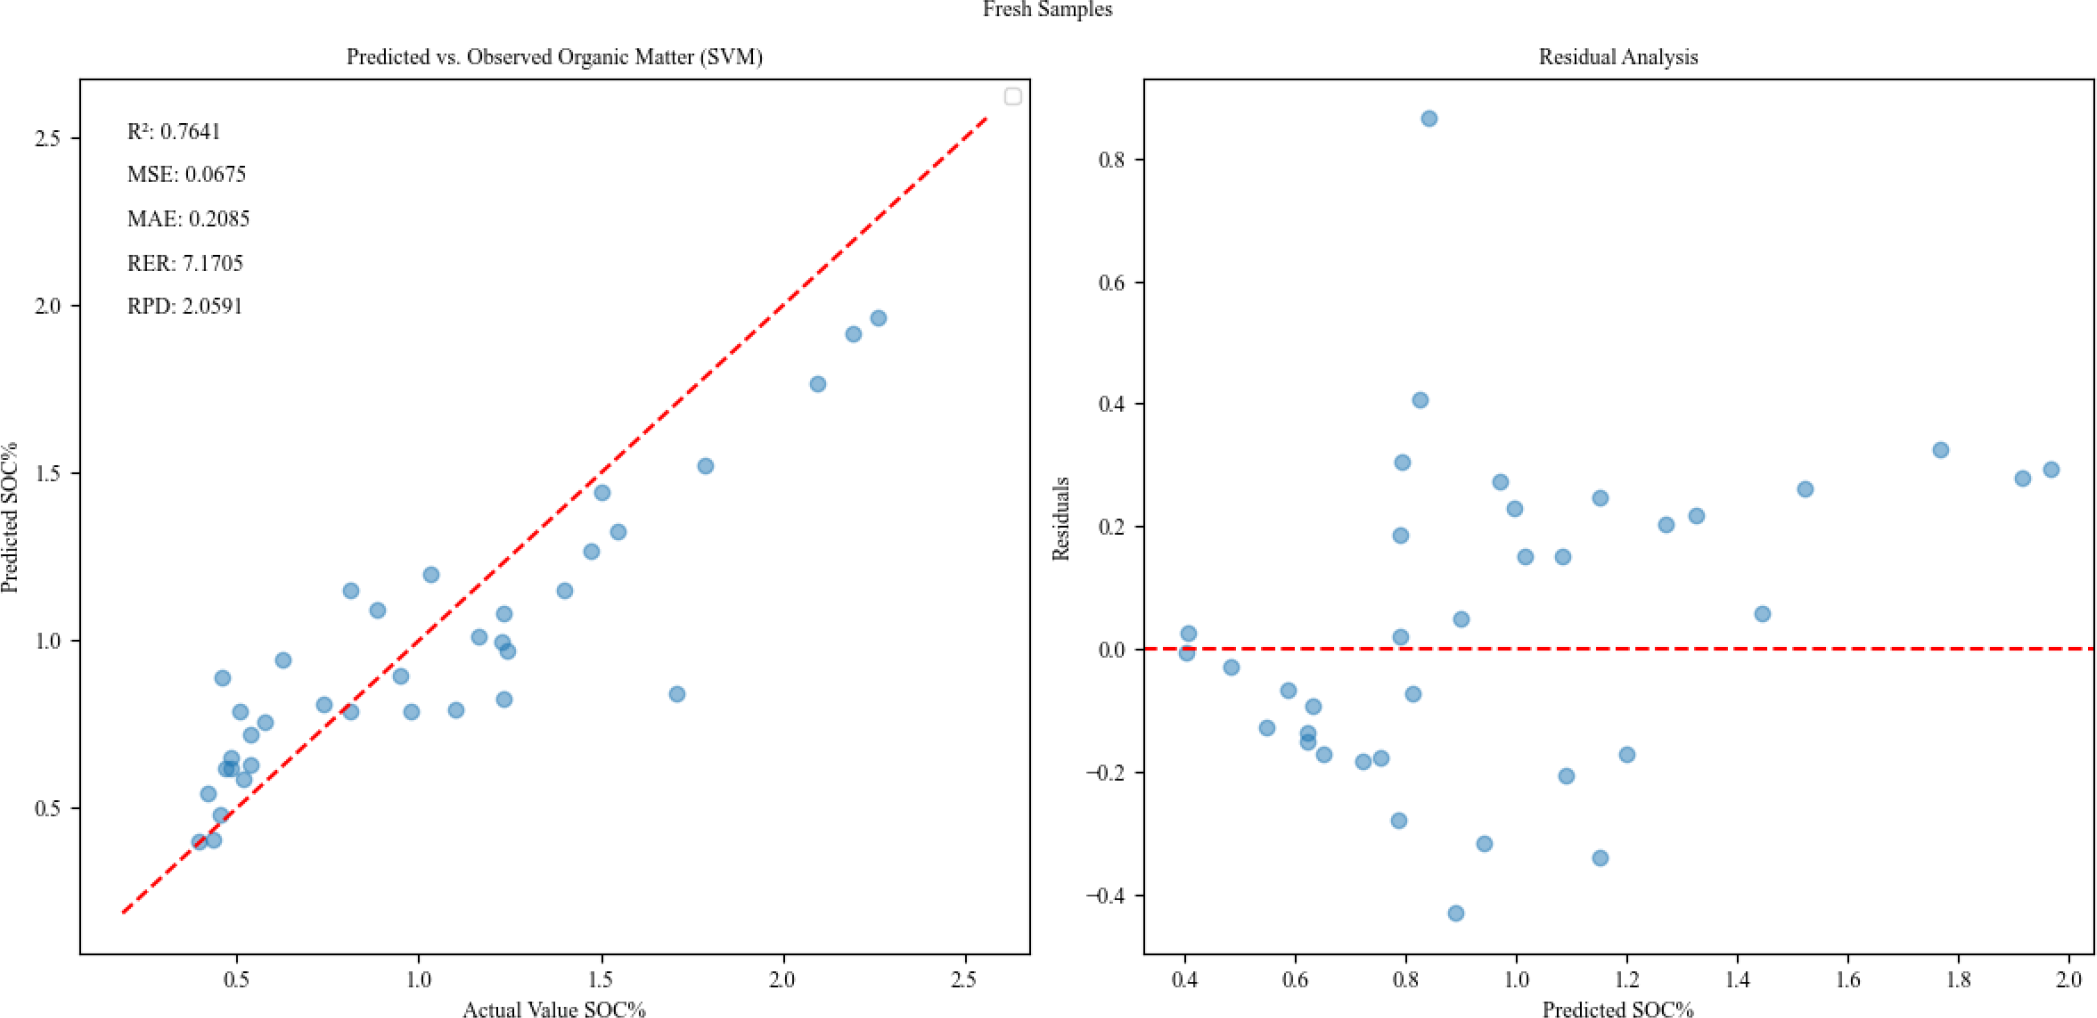
The values obtained from the model show moderate performance according to the evaluation metrics. The coefficient of determination (R2) was 0.7444 on the training set and slightly increased to 0.7640 on the test set, indicating good generalization ability without signs of overfitting. These results suggest the model successfully captures a substantial portion of the data’s variability. Nevertheless, these values are not high enough to consider that the model is excellent, so it is strongly recommended to improve its predictive ability.
Regarding errors, the MSE and MAE values were relatively low, 0.0591 and 0.1893 for the training set and 0.0675 and 0.2085 for the test set, respectively, reflecting appropriate performance, although with room for improvement in accuracy, especially in the test data. The RER was high for training 9.7571 and test 7.1691, demonstrating the model has optimal predictive ability. Notwithstanding, the RPD was 1.9779 for the training set and 2.0587 for the test set, which places the model in the “poor” category according to the established guidelines, limiting its usefulness only to rough selection tasks rather than tasks requiring near precision.
The scatter plot in Figure 8 further highlights the performance of the SVM model. The points are clustered around the ideal 1:1 line, indicating a high correlation between the predicted and observed values. This visual representation confirms the model’s ability to capture the underlying trends and variability in the data accurately. The residual analysis shows a relatively balanced distribution around zero, with values varying between -0.4 and 0.6, indicating that the model does not present significant biases in its predictions.
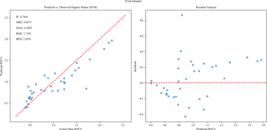
Soil Organic Carbon (SOC) content comparison for fresh soil samples comparison between the predicted and observed values (left); matching residual analysis for the Support Vector Machine (SVM) model (right)
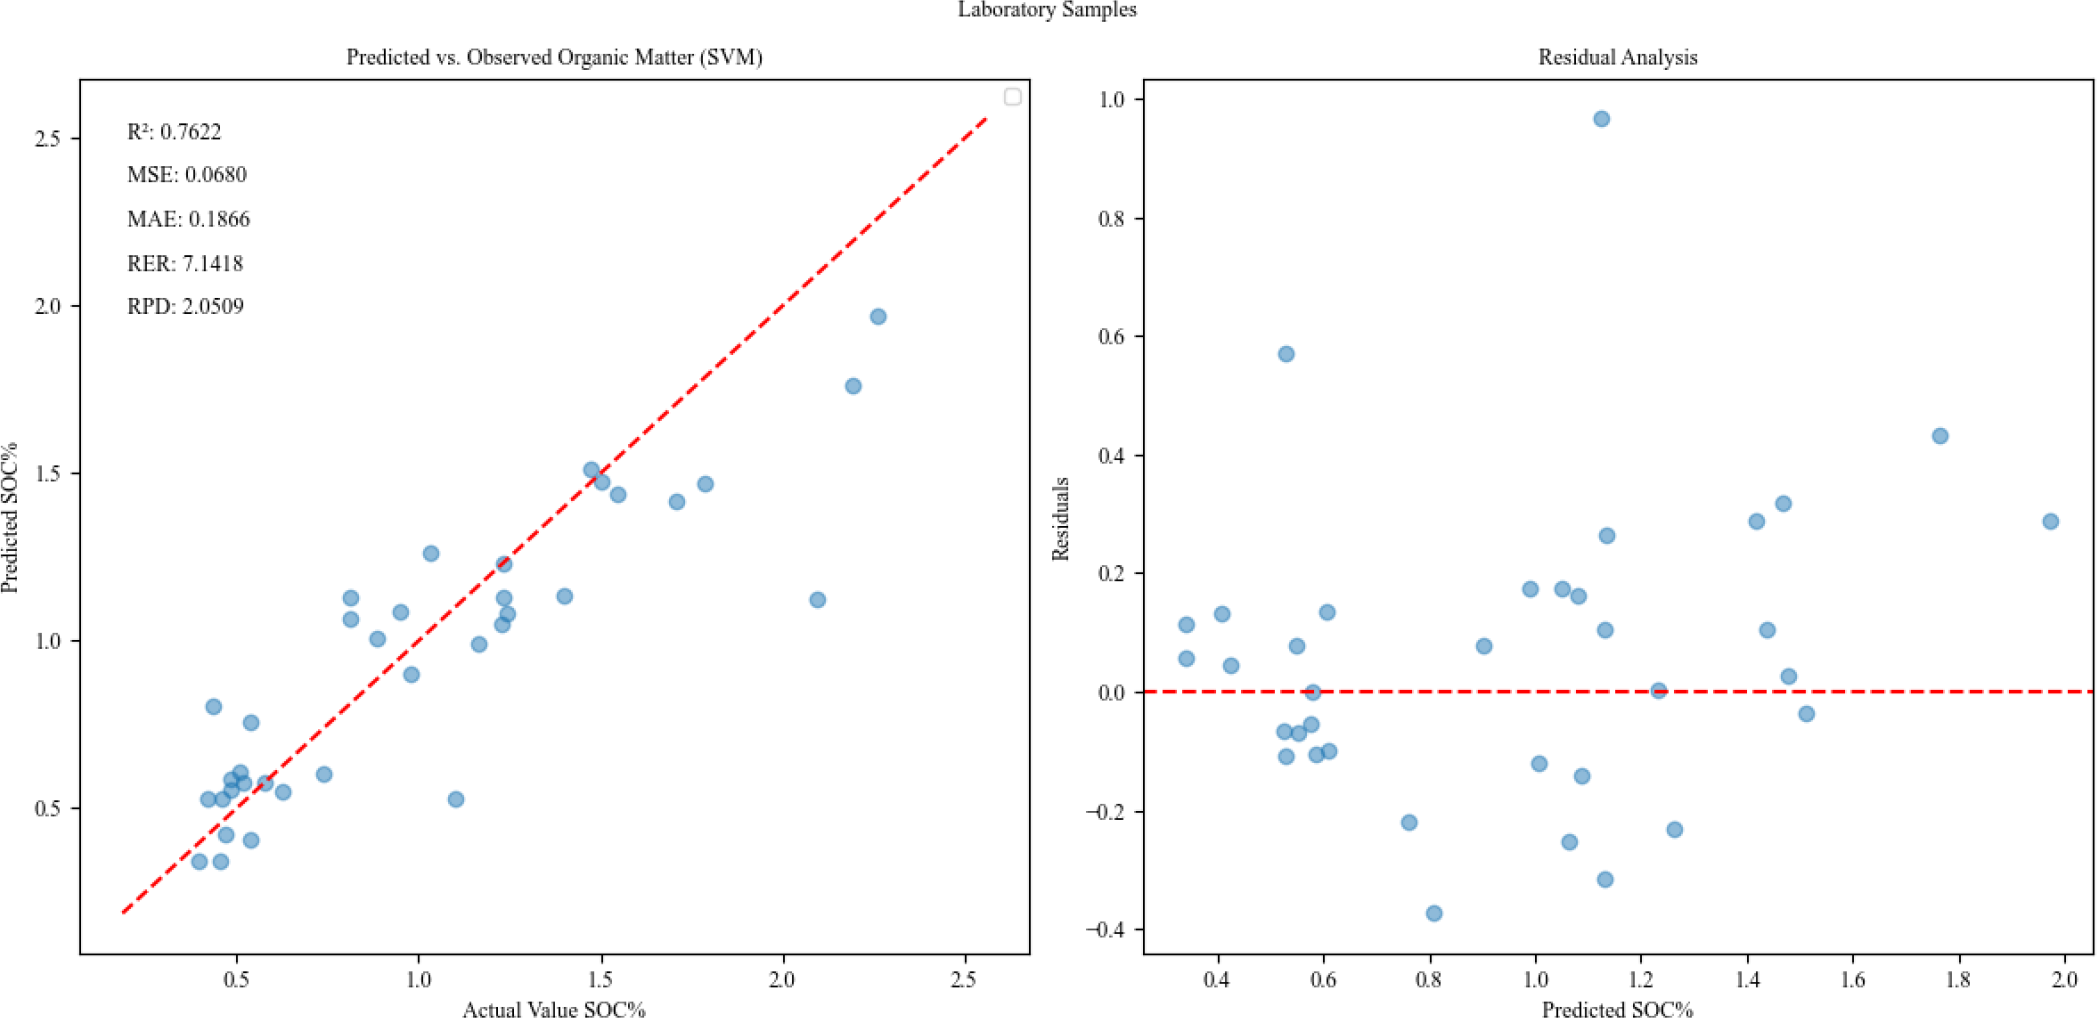
The results achieved for the Laboratory processed sample show similar performance to the field samples. The coefficient of determination (R2) was 0.7533 in the training set and 0.7622 in the test set, indicating that the model captures a considerable proportion of the variability in the data. Although these values are slightly higher than those obtained in the fresh sample, they still do not reach a perfect level; in other words, the accuracy of the model can still be better.
The MSE and MAE present relatively low values of 0.0571 and 0.1786 in the training set and 0.0680 and 0.1866 in the test set, respectively. These results reflect stable behavior between the two sets, with no obvious signs of overfitting, which supports the usefulness of the model for preliminary estimates. The RER, with values of 9.9321 in training and 7.1418 in test, indicates an acceptable predictive ability. However, the RPD remains low, with 2.0133 for training and 2.0509 for testing, classifying the model within the “poor” category.
The superior performance of SVM on Laboratory data is illustrated in the scatter plot of predicted versus observed organic matter (Figure 9). While the alignment of the data points with the ideal red diagonal line indicates reasonable accuracy, the clustering pattern suggests potential areas for further optimization or feature engineering, such as incorporating additional spectral features or refining the model parameters. The predicted values of SOC% ranged from 0.5 to 2.5, with a distribution of residuals ranging from 0.2 to 2.0, implying that the model does not have significant biases in its predictions.
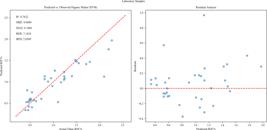
Soil Organic Carbon (SOC) content comparison for laboratory soil samples comparison between the predicted and observed values (left); matching residual analysis for the Support Vector Machine (SVM) model (right)
The spectroscopy-based approach offers a cost-effective and time-efficient alternative to traditional Laboratory analysis (Jakkan et al., 2023; Das et al., 2023; Liu et al., 2023). By leveraging spectroscopic techniques, it is possible to predict SOC content accurately, streamlining the analysis process and reducing associated costs. This has significant implications for sustainable agriculture and soil health monitoring, enabling rapid and accurate assessment of soil carbon stocks.
Future research could explore integrating additional spectral ranges, such as the visible and shortwave infrared (SWIR) regions, to improve model performance further. Additionally, incorporating other soil properties, such as soil texture and moisture content, could enhance the predictive capabilities of the models. Developing real-time monitoring systems based on spectroscopic sensors would enable continuous soil health and carbon sequestration tracking. By addressing these areas, applying spectroscopic techniques and machine learning can significantly contribute to sustainable soil management and climate change mitigation.
This research is important because spectroscopy can provide good SOC prediction results without the need for soil modification, which offers a significant advantage in terms of efficiency and cost (Soriano-Disla et al., 2014). Therefore, it is essential to increase and diversify the spectral libraries to improve the accuracy of the models, adjusting to the specific conditions of each region (Viscarra et al., 2016). Studies such as Stevens et al. (2013) and Were et al. (2015) have highlighted the importance of adjusting models to local soil characteristics since the use of global spectral libraries being so large and diverse often gives biased predictions at the local level, while Ramirez-Lopez et al. (2013) demonstrated how the use of spectral libraries can significantly improve SOC prediction. These findings support the need for further development and expansion of spectral libraries to optimize the applicability of models in different agricultural and environmental contexts.
Conclusions
-
1. This study showed the integration of spectroscopic techniques, integrated with machine learning algorithms- particularly Support Vector Machines (SVM)-to accurately predict soil organic carbon (SOC) content. By strategically selecting relevant spectral regions, the predictive accuracy of the model was improved compared to traditional Laboratory methods.
-
2. When applied with visible and near-infrared (VisNIR) spectroscopy, the Support Vector Machine (SVM) model demonstrates predictive performance comparable to conventional methods for estimating organic carbon content in agricultural soils.
-
3. The Support Vector Machine (SVM) is time-efficient for the analysis of agricultural soils, as it allows corroborating the estimation of organic carbon content without the need for timeconsuming Laboratory post-processing of soil samples and the use of chemical inputs for organic carbon determination.
Data availability statement:
The authors declare that there are no data underlying the text.
-
1
Research developed at Escuela Superior Politécnica Agropecuaria de Manabí Manuel Félix López, Campus Politécnico El Limón, Calceta, Ecuador
-
Financing statement:
This study was funded by the Escuela Superior Politécnica Agropecuaria de Manabí “Manuel Félix López”. Projects: Soil Organic Carbon CUP:91880000.0000.388095 and Machine Learning with Agricultural Datasets CUP:91880000.0000.388091 SEMPLADES, Ecuador.
Literature Cited
-
Alomar, S.; Mireei, S. A.; Hemmat, A.; Masoumi, A. A.; Khademi, H. Prediction and variability mapping of some physicochemical characteristics of calcareous topsoil in an arid region using VisSWNIR and NIR spectroscopy. Scientific Reports, v.12, e8435, 2022. https://doi.org/10.1038/s41598-022-12276-4
» https://doi.org/10.1038/s41598-022-12276-4 -
Ashida, K.; Watanabe, T.; Urayama, S.; Hartono, A.; Kilasara, M.; Mvondo Ze, A. D.; Nakao, A.; Sugihara, S.; Funakawa, S. Quantitative relationship between organic carbon and geochemical properties in tropical surface and subsurface soils. Biogeochemistry, v.155, p.77-95, 2021. https://doi.org/10.1007/s10533-021-00813-8
» https://doi.org/10.1007/s10533-021-00813-8 -
Bai, Z.; Chen, S.; Hong, Y.; Hu, B.; Luo, D.; Peng, J.; Shi, Z. Estimation of soil inorganic carbon with visible near-infrared spectroscopy coupling of variable selection and deep learning in arid region of China. Geoderma, v.437, e116589, 2023. https://doi.org/10.1016/j.geoderma.2023.116589
» https://doi.org/10.1016/j.geoderma.2023.116589 -
Barra, I.; Haefele, S. M.; Sakrabani, R.; Kebede, F. Soil spectroscopy with the use of chemometrics, machine learning and preprocessing techniques in soil diagnosis: Recent advances-A review. Trends in Analytical Chemistry, v.135, e116166, 2021. https://doi.org/10.1016/j.trac.2020.116166
» https://doi.org/10.1016/j.trac.2020.116166 -
Barrezueta-Unda, S.; Cervantes-Alava, A.; Ullauri-Espinoza, M.; Barrera Leon, J.; Condoy-Gorotiza, A. Evaluación del método de ignición para determinar materia orgánica en suelos de la provincia el oro-ecuador. FAVE. Secc. Ciências. Agrarias, v.19, p.25-26, 2020. http://www.scielo.org.ar/scielo.php?script=sci_arttext&pid=S1666-77192020000200025&lng=es&tlng=es
» http://www.scielo.org.ar/scielo.php?script=sci_arttext&pid=S1666-77192020000200025&lng=es&tlng=es -
Biney, J. K. M.; Vašát, R., Bell, S. M.; Kebonye, N. M.; Klement, A.; John, K.; Borůvka, L. Prediction of topsoil organic carbon content with Sentinel-2 imagery and spectroscopic measurements under different conditions using an ensemble model approach with multiple pre-treatment combinations. Soil and Tillage Research, v.220, e105379, 2022. https://doi.org/10.1016/j.still.2022.105379
» https://doi.org/10.1016/j.still.2022.105379 -
Bou-Orm, N.; AlRomaithi, A. A.; Elrmeithi, M.; Ali, F. M.; Nazzal, Y.; Howari, F. M.; Al Aydaroos, F. Advantages of first-derivative reflectance spectroscopy in the VNIR-SWIR for the quantification of olivine and hematite. Planetary and Space Science, v.188, e104957, 2020. https://doi.org/10.1016/J.PSS.2020.104957
» https://doi.org/10.1016/J.PSS.2020.104957 -
Carbajal, M.; Ramírez, D. A.; Turin, C.; Schaeffer, S. M.; Konkel, J.; Ninanya, J.; Rinza, J.; De Mendiburu, F.; Zorogastua, P.; Villaorduña, L.; Quiroz, R. From rangelands to cropland, landuse change and its impact on soil organic carbon variables in a Peruvian Andean highlands: a machine learning modeling approach. Ecosystems, v.27, p.899-917, 2024. https://doi.org/10.1007/s10021-024-00928-7
» https://doi.org/10.1007/s10021-024-00928-7 -
Chinilin, A. V.; Vindeker, G. V.; Savin, I. Y. Vis-NIR spectroscopy for soil organic carbon assessment: A meta-analysis. Eurasian Soil Science, v.56, p.1605-1617. 2023. https://doi.org/10.1134/S1064229323601841
» https://doi.org/10.1134/S1064229323601841 -
Das, B.; Chakraborty, D.; Singh, V. K.; Das, D.; Sahoo, R. N.; Aggarwal, P.; Murgaokar, D.; Mondal, B. P. Partial least square regression based machine learning models for soil organic carbon prediction using visible-near infrared spectroscopy. Geoderma Regional, v.33, e00628, 2023. https://doi.org/10.1016/j.geodrs.2023.e00628
» https://doi.org/10.1016/j.geodrs.2023.e00628 -
Di Martino, A.; Garcia, L. Análisis de materia orgánica en suelos por espectroscopia de infrarrojo cercano. EEA Pergamino, INTA, v.10, p.27-31, 2022. https://repositorio.inta.gob.ar/handle/20.500.12123/14001
» https://repositorio.inta.gob.ar/handle/20.500.12123/14001 -
Du, X.; Xu, Z.; Lv, Q.; Meng, Y.; Wang, Z.; Feng, H.; Ren, X.; Hu, S.; Gao, Z. Fractions, stability, and influencing factors of soil organic carbon under different land-use in sodic soils. Geoderma Regional, v.31, e00590, 2022. https://doi.org/10.1016/j.geodrs.2022.e00590
» https://doi.org/10.1016/j.geodrs.2022.e00590 -
Esquivel-Valenzuela, B.; Cueto-Wong, J. A.; Cruz-Gaistardo, C. O.; Guerrero-Peña, A.; Jarquín-Sánchez, A.; Burgos-Córdova, D. Carbono orgánico y nitrógeno total en suelos forestales de México mediante espectroscopia VIS-NIR. Revista Mexicana de Ciencias Forestales, v.9, p.295-313, 2018. https://doi.org/10.29298/rmcf.v9i47.158
» https://doi.org/10.29298/rmcf.v9i47.158 -
Estupiñán, M. C.; Carcelén, C. F.; Hidalgo, L. V.; Rojas, E. D.; Vera, C. O.; López G. S.; Bezada, Q. S. Aplicación de la espectroscopía del infrarrojo cercano - NIRS - para determinar el valor nutritivo de variedades de alfalfa (Medicago sativa L) y trébol rojo (Trifolium pratense L). Revista de Investigaciones Veterinarias del Perú, v.32, e19491, 2021. https://doi.org/10.15381/rivep.v32i1.19491
» https://doi.org/10.15381/rivep.v32i1.19491 -
Frost, T. Quantitative Analysis. Encyclopedia of Spectroscopy and Spectrometry, p.1931-1936, 1999. https://doi.org/10.1006/RWSP.2000.0250
» https://doi.org/10.1006/RWSP.2000.0250 -
Gholizadeh, A.; Saberioon, M.; Ben-Dor, E.; Viscarra Rossel, R. A.; Borůvka, L. Modelling potentially toxic elements in forest soils with vis-NIR spectra and learning algorithms. Environmental Pollution, v.267, e115574, 2020. https://doi.org/10.1016/j.envpol.2020.115574
» https://doi.org/10.1016/j.envpol.2020.115574 -
González-Aguiar, D.; Colás-Sánchez, A.; Rodríguez-López, O.; Álvarez-Vázquez, D. L.; Gattorno-Muñoz, S.; Chacón-Iznaga, A. Estimación de la materia orgánica en suelo Pardo mullido medianamente lavado mediante espectroscopia vis-NIR. Centro Agrícola, v.47, p.23-32, 2020. http://scielo.sld.cu/pdf/cag/v47n3/0253-5785-cag-47-03-23.pdf
» http://scielo.sld.cu/pdf/cag/v47n3/0253-5785-cag-47-03-23.pdf -
Gozukara, G.; Hartemink, A. E.; Zhang, Y. Soil catena characterization using pXRF and Vis-NIR spectroscopy in Northwest Turkey. Eurasian Soil Science, v.54, p.S1-S15, 2021. https://doi.org/10.1134/S1064229322030061
» https://doi.org/10.1134/S1064229322030061 -
Guillén, S.; López, G.; Ormaza, P.; Mesias, F.; Błońska, E.; Reyna-Bowen, L. Soil health and dragon fruit cultivation: Assessing the impact on soil organic carbon. Scientia Agropecuaria, v.14, p.519-528, 2023. https://doi.org/10.17268/sci.agropecu.2023.043
» https://doi.org/10.17268/sci.agropecu.2023.043 -
Hidalgo, A. Técnicas estadísticas en el análisis cuantitativo de datos. Revista Sigma, v.15, p.28-44, 2019. https://revistas.udenar.edu.co/index.php/rsigma/article/view/4905
» https://revistas.udenar.edu.co/index.php/rsigma/article/view/4905 - Henderson, T. L.; Szilagyi, A.; Baumgardner, M. F.; Chen, C. C. T.; Landgrebe, D. A. Spectral band selection for classification of soil organic matter content. Soil Science Society of America Journal, v.53, p.1778-1784, 1989.
-
Jakkan, D. A.; Ghare, P.; Sakode, C. Multi-parameter soil property prediction incorporating mid-infrared spectroscopy and dropout sequential artificial neural network. Water, Air, & Soil Pollution, v.234, e694, 2023. https://doi.org/10.1007/s11270-023-06726-6
» https://doi.org/10.1007/s11270-023-06726-6 -
Khosravi A. K.; Yaghmaeian M. N.; Ramezanpour, H.; Rezapour, S.; Mosleh, Z. Selecting environmental factors to predict spatial distribution of soil organic carbon stocks, northwestern Iran. Environmental Monitoring and Assessment, v.193, e713, 2021. https://doi.org/10.1007/s10661-021-09502-3
» https://doi.org/10.1007/s10661-021-09502-3 -
Liu, S.; Chen, J.; Guo, L.; Wang, J.; Zhou, Z.; Luo, J.; Yang, R. Prediction of soil organic carbon in soil profiles based on visible-near-infrared hyperspectral imaging spectroscopy. Soil and Tillage Research, v.232, e105736, 2023. https://doi.org/10.1016/j.still.2023.105736
» https://doi.org/10.1016/j.still.2023.105736 -
Liu, Y.; Liu, Y.; Chen, Y.; Zhang, Y.; Shi, T.; Wang, J.; Hong, Y.; Fei, T.; Zhang, Y. The influence of spectral pretreatment on the selection of representative calibration samples for soil organic matter estimation using Vis-NIR reflectance spectroscopy. Remote Sensing, v.11, e450, 2019. https://doi.org/10.3390/rs11040450
» https://doi.org/10.3390/rs11040450 -
Mendes, W. de S.; Sommer, M.; Koszinski, S.; Wehrhan, M. Peatlands spectral data influence in global spectral modelling of soil organic carbon and total nitrogen using visible-near-infrared spectroscopy. Journal of Environmental Management, v.317, e115383, 2022. https://doi.org/10.1016/j.jenvman.2022.115383
» https://doi.org/10.1016/j.jenvman.2022.115383 -
Murindangabo, Y. T.; Kopecký, M.; Konvalina, P.; Ghorbani, M.; Perná, K.; Nguyen, T. G.; Bernas, J.; Baloch, S. B.; Hoang, T. N.; Eze, F. O.; Ali, S. Quantitative approaches in assessing soil organic matter dynamics for sustainable management. Agronomy, v.13, e1776, 2023. https://doi.org/10.3390/agronomy13071776
» https://doi.org/10.3390/agronomy13071776 -
Okolo, C. C.; Gebresamuel, G.; Retta, A. N.; Zenebe, A.; Haile, M. Advances in quantifying soil organic carbon under different land uses in Ethiopia: a review and synthesis. Bulletin of the National Research Centre, v.43, e99, 2019. https://doi.org/10.1186/s42269-019-0120-z
» https://doi.org/10.1186/s42269-019-0120-z -
Oliveira Morais, P. A. de; Souza, D. M. de; Madari, B. E.; Soares, A. da S.; Oliveira, A. E. de. Using image analysis to estimate the soil organic carbon content. Microchemical Journal, v.147, p.775-781, 2019. https://doi.org/10.1016/j.microc.2019.03.070
» https://doi.org/10.1016/j.microc.2019.03.070 -
Ramirez-Lopez, L.; Behrens, T.; Schmidt, K.; Stevens, A.; Demattê, J. A. M.; Scholten, T. The spectrum-based learner: A new local approach for modeling soil vis-NIR spectra of complex datasets. Geoderma, v.195, p.268-279, 2013. https://doi.org/10.1016/j.geoderma.2012.12.014
» https://doi.org/10.1016/j.geoderma.2012.12.014 -
Reyna-Bowen, L.; Fernandez-Rebollo, P.; Fernández-Habas, J.; Gómez, J. A. The influence of tree and soil management on soil organic carbon stock and pools in dehesa systems. Catena, v.190, e104511, 2020. https://doi.org/10.1016/j.catena.2020.104511
» https://doi.org/10.1016/j.catena.2020.104511 -
Reyna-Bowen, L.; Vera-Montenegro, L.; Delgado, M. I. Optimizing soil analysis in precision agriculture: Evaluating alternative methods for SOC prediction. Journal of Ecological Engineering, v.26, p.322-331, 2025. https://doi.org/10.12911/22998993/195882
» https://doi.org/10.12911/22998993/195882 -
Russell, F. E.; Boyle, J. F.; Chiverrell, R. C. NIRS quantification of lake sediment composition by multiple regression using end-member spectra. Journal of Paleolimnology, v.62, p.73-88, 2019. https://doi.org/10.1007/S10933-019-00076-2
» https://doi.org/10.1007/S10933-019-00076-2 -
Salgado, L.; Forján, R.; Rodríguez-Pérez, J. R.; Colina, A.; MejíaCorreal, K. B.; López-Sánchez, C. A.; Gallego, J. L. R. Soil organic carbon fractionation assessment in areas with high fire activity using diffuse spectroscopy and tree-based machine learning algorithms. Earth Systems and Environment, v.2025, p.1-15, 2025. https://doi.org/10.1007/s41748-024-00564-0
» https://doi.org/10.1007/s41748-024-00564-0 -
Sarkar, S.; Basak, J. K.; Moon, B. E.; Kim, H. T. A comparative study of PLSR and SVM-R with various preprocessing techniques for the quantitative determination of soluble solids content of Hardy Kiwi fruit by a portable Vis/NIR spectrometer. Foods, v.9, e1078, 2020. https://doi.org/10.3390/foods9081078
» https://doi.org/10.3390/foods9081078 -
Shamrikova, E. V.; Kondratenok, B. M.; Tumanova, E. A.; Vanchikova, E. V.; Lapteva, E. M.; Zonova, T. V.; Lu-Lyan-Min, E. I.; Davydova, A. P.; Libohova, Z.; Suvannang, N. Transferability between soil organic matter measurement methods for database harmonization. Geoderma, v.412, e115547, 2022. https://doi.org/10.1016/j.geoderma.2021.115547
» https://doi.org/10.1016/j.geoderma.2021.115547 -
Shamrikova, E. V.; Vanchikova, E. V.; Lu-Lyan-Min, E. I.; Kubik, O. S.; Zhangurov, E. V. Which method to choose for measurement of oranic and inorganic carbon content in carbonate-rich soils? Advantages and disadvantages of dry and wet chemistry. Catena, v.228, e107151, 2023. https://doi.org/10.1016/j.catena.2023.107151
» https://doi.org/10.1016/j.catena.2023.107151 -
Soriano-Disla, J. M.; Janik, L. J.; Viscarra Rossel, R. A.; Macdonald, L. M.; McLaughlin, M. J. The performance of visible, near-, and midinfrared reflectance spectroscopy for prediction of soil physical, chemical, and biological properties. Applied Spectroscopy Reviews, v.49, p.139-186, 2014. https://doi.org/10.1080/05704928.2013.811081
» https://doi.org/10.1080/05704928.2013.811081 -
Stevens, A.; Nocita, M.; Tóth, G.; Montanarella, L.; Van Wesemael, B. Prediction of soil organic carbon at the european scale by visible and near infraRed reflectance spectroscopy. PLoS ONE, v.8, e66409, 2013. https://doi.org/10.1371/journal.pone.0066409
» https://doi.org/10.1371/journal.pone.0066409 -
Shen, L.; Gao, M.; Yan, J.; Li, Z. L.; Leng, P.; Yang, Q.; Duan, S. B. Hyperspectral estimation of soil organic matter content using different spectral preprocessing techniques and PLSR method. Remote Sensing, v.12, e1206, 2020. https://doi.org/10.3390/rs12071206
» https://doi.org/10.3390/rs12071206 -
Thomas, F.; Petzold, R.; Becker, C.; Werban, U. Application of Low-Cost MEMS spectrometers for forest topsoil properties prediction. Sensors, v.21, e3927, 2021. https://doi.org/10.3390/s21113927
» https://doi.org/10.3390/s21113927 -
Vaudour, E.; Gholizadeh, A.; Castaldi, F.; Saberioon, M.; Borůvka, L.; Urbina-Salazar, D.; Fouad, Y.; Arrouays, D.; Richer-de-Forges, A. C.; Biney, J.; Wetterlind, J.; Van Wesemael, B. Satellite imagery to map topsoil organic carbon content over cultivated areas: an overview. Remote Sensing, v.14, e2917, 2022. https://doi.org/10.3390/rs14122917
» https://doi.org/10.3390/rs14122917 -
Vigo, A.; Latorre, M. Á.; Ripoll, G. Espectroscopía en el infrarrojo cercano por transmitancia y reflectancia para la predicción de la composición química de cereales en grano y molidos. Informacion Tecnica Economica Agraria, v.118, p.565-579 2022. https://doi.org/10.12706/itea.2022.001
» https://doi.org/10.12706/itea.2022.001 -
Vite Cevallos, H.; Carvajal Romero, H.; Barrezueta Unda, S. Aplicación de algoritmos de aprendizaje automático para clasificar la fertilidad de un suelo bananero. Conrado, v.16, p.15-19, 2020. http://scielo.sld.cu/scielo.php?script=sci_arttext&pid=S1990-86442020000100015
» http://scielo.sld.cu/scielo.php?script=sci_arttext&pid=S1990-86442020000100015 -
Viscarra Rossel, R. A.; Behrens, T.; Ben-Dor, E.; Brown, D. J.; Demattê, J. A. M.; Shepherd, K. D.; Shi, Z.; Stenberg, B.; Stevens, A.; Adamchuk, V.; Aïchi, H.; Barthès, B. G.; Bartholomeus, H. M.; Bayer, A. D.; Bernoux, M.; Böttcher, K.; Brodský, L.; Du, C. W.; Chappell, A.; Ji, W. A global spectral library to characterize the world’s soil. Earth-Science Reviews, v.155, p.198-230, 2016. https://doi.org/10.1016/j.earscirev.2016.01.012
» https://doi.org/10.1016/j.earscirev.2016.01.012 -
Walkley, A. A critical examination of a rapid method for determining organic carbon in soils-effect of variations in digestion conditions and of inorganic soil constituents. Soil Science, v.63, p.251-264, 1947. https://doi.org/10.1097/00010694-194704000-00001
» https://doi.org/10.1097/00010694-194704000-00001 -
Wang, Y.; Yang, S.; Yan, X.; Yang, C.; Feng, M.; Xiao, L.; Song, X.; Zhang, M.; Shafiq, F.; Sun, H.; Li, G.; Yang, W.; Wang, C. Evaluation of data pre-processing and regression models for precise estimation of soil organic carbon using Vis-NIR spectroscopy. Journal of Soils and Sediments, v.23, p.634-645, 2023. https://doi.org/10.1007/s11368-022-03337-2
» https://doi.org/10.1007/s11368-022-03337-2 -
Were, K.; Bui, D. T.; Dick, Ø. B.; Singh, B. R. A comparative assessment of support vector regression, artificial neural networks, and random forests for predicting and mapping soil organic carbon stocks across an Afromontane landscape. Ecological Indicators, v.52, p.394-403, 2015. https://doi.org/10.1016/j.ecolind.2014.12.028
» https://doi.org/10.1016/j.ecolind.2014.12.028 -
Xu, M.; Chu, X.; Fu, Y.; Wang, C.; Wu, S. Improving the accuracy of soil organic carbon content prediction based on visible and nearinfrared spectroscopy and machine learning. Environmental Earth Sciences, v.80, e326, 2021. https://doi.org/10.1007/s12665-021-09582-x
» https://doi.org/10.1007/s12665-021-09582-x -
Yang, S.; Dong, Y.; Song, X.; Wu, H.; Zhao, X.; Yang, J.; Chen, S.; Smith, J.; Zhang, G.-L. Vertical distribution and influencing factors of deep soil organic carbon in a typical subtropical agricultural watershed. Agriculture, Ecosystems & Environment, v.339, e108141, 2022. https://doi.org/10.1016/j.agee.2022.108141
» https://doi.org/10.1016/j.agee.2022.108141 -
Yao, X.; Yu, K.; Deng, Y.; Liu, J.; Lai, Z. Spatial variability of soil organic carbon and total nitrogen in the hilly red soil region of Southern China. Journal of Forestry Research, v.31, p.2385-2394, 2020. https://doi.org/10.1007/s11676-019-01014-8
» https://doi.org/10.1007/s11676-019-01014-8 -
Zhang, T.; Li, Y.; Wang, M. Prediction of soil organic carbon and total nitrogen affected by mine using Vis-NIR spectroscopy coupled with machine learning algorithms in calcareous soils. Scientific Reports, v.14, e28014, 2024. https://doi.org/10.1038/s41598-024-73761-6
» https://doi.org/10.1038/s41598-024-73761-6 -
Zhang, X.; Feng, J.; Cai, F.; Huang, K.; Wang, S. A novel state of health estimation model for lithium-ion batteries incorporating signal processing and optimized machine learning methods. Frontiers in Energy, v.21, e514, 2024. https://doi.org/10.1007/s11708-024-0969-x
» https://doi.org/10.1007/s11708-024-0969-x -
Zhao, P.; Fallu, D. J.; Pears, B. R.; Allonsius, C.; Lembrechts, J. J.; Van de Vondel, S.; Meysman, F. J. R.; Cucchiaro, S.; Tarolli, P.; Shi, P.; Six, J.; Brown, A. G.; van Wesemael, B.; Van Oost, K. Quantifying soil properties relevant to soil organic carbon biogeochemical cycles by infrared spectroscopy: The importance of compositional data analysis. Soil and Tillage Research. v.231, e105718, 2023. https://doi.org/10.1016/j.still.2023.105718
» https://doi.org/10.1016/j.still.2023.105718
Edited by
-
Editors:
Toshik Iarley da Silva & Carlos Alberto Vieira de Azevedo

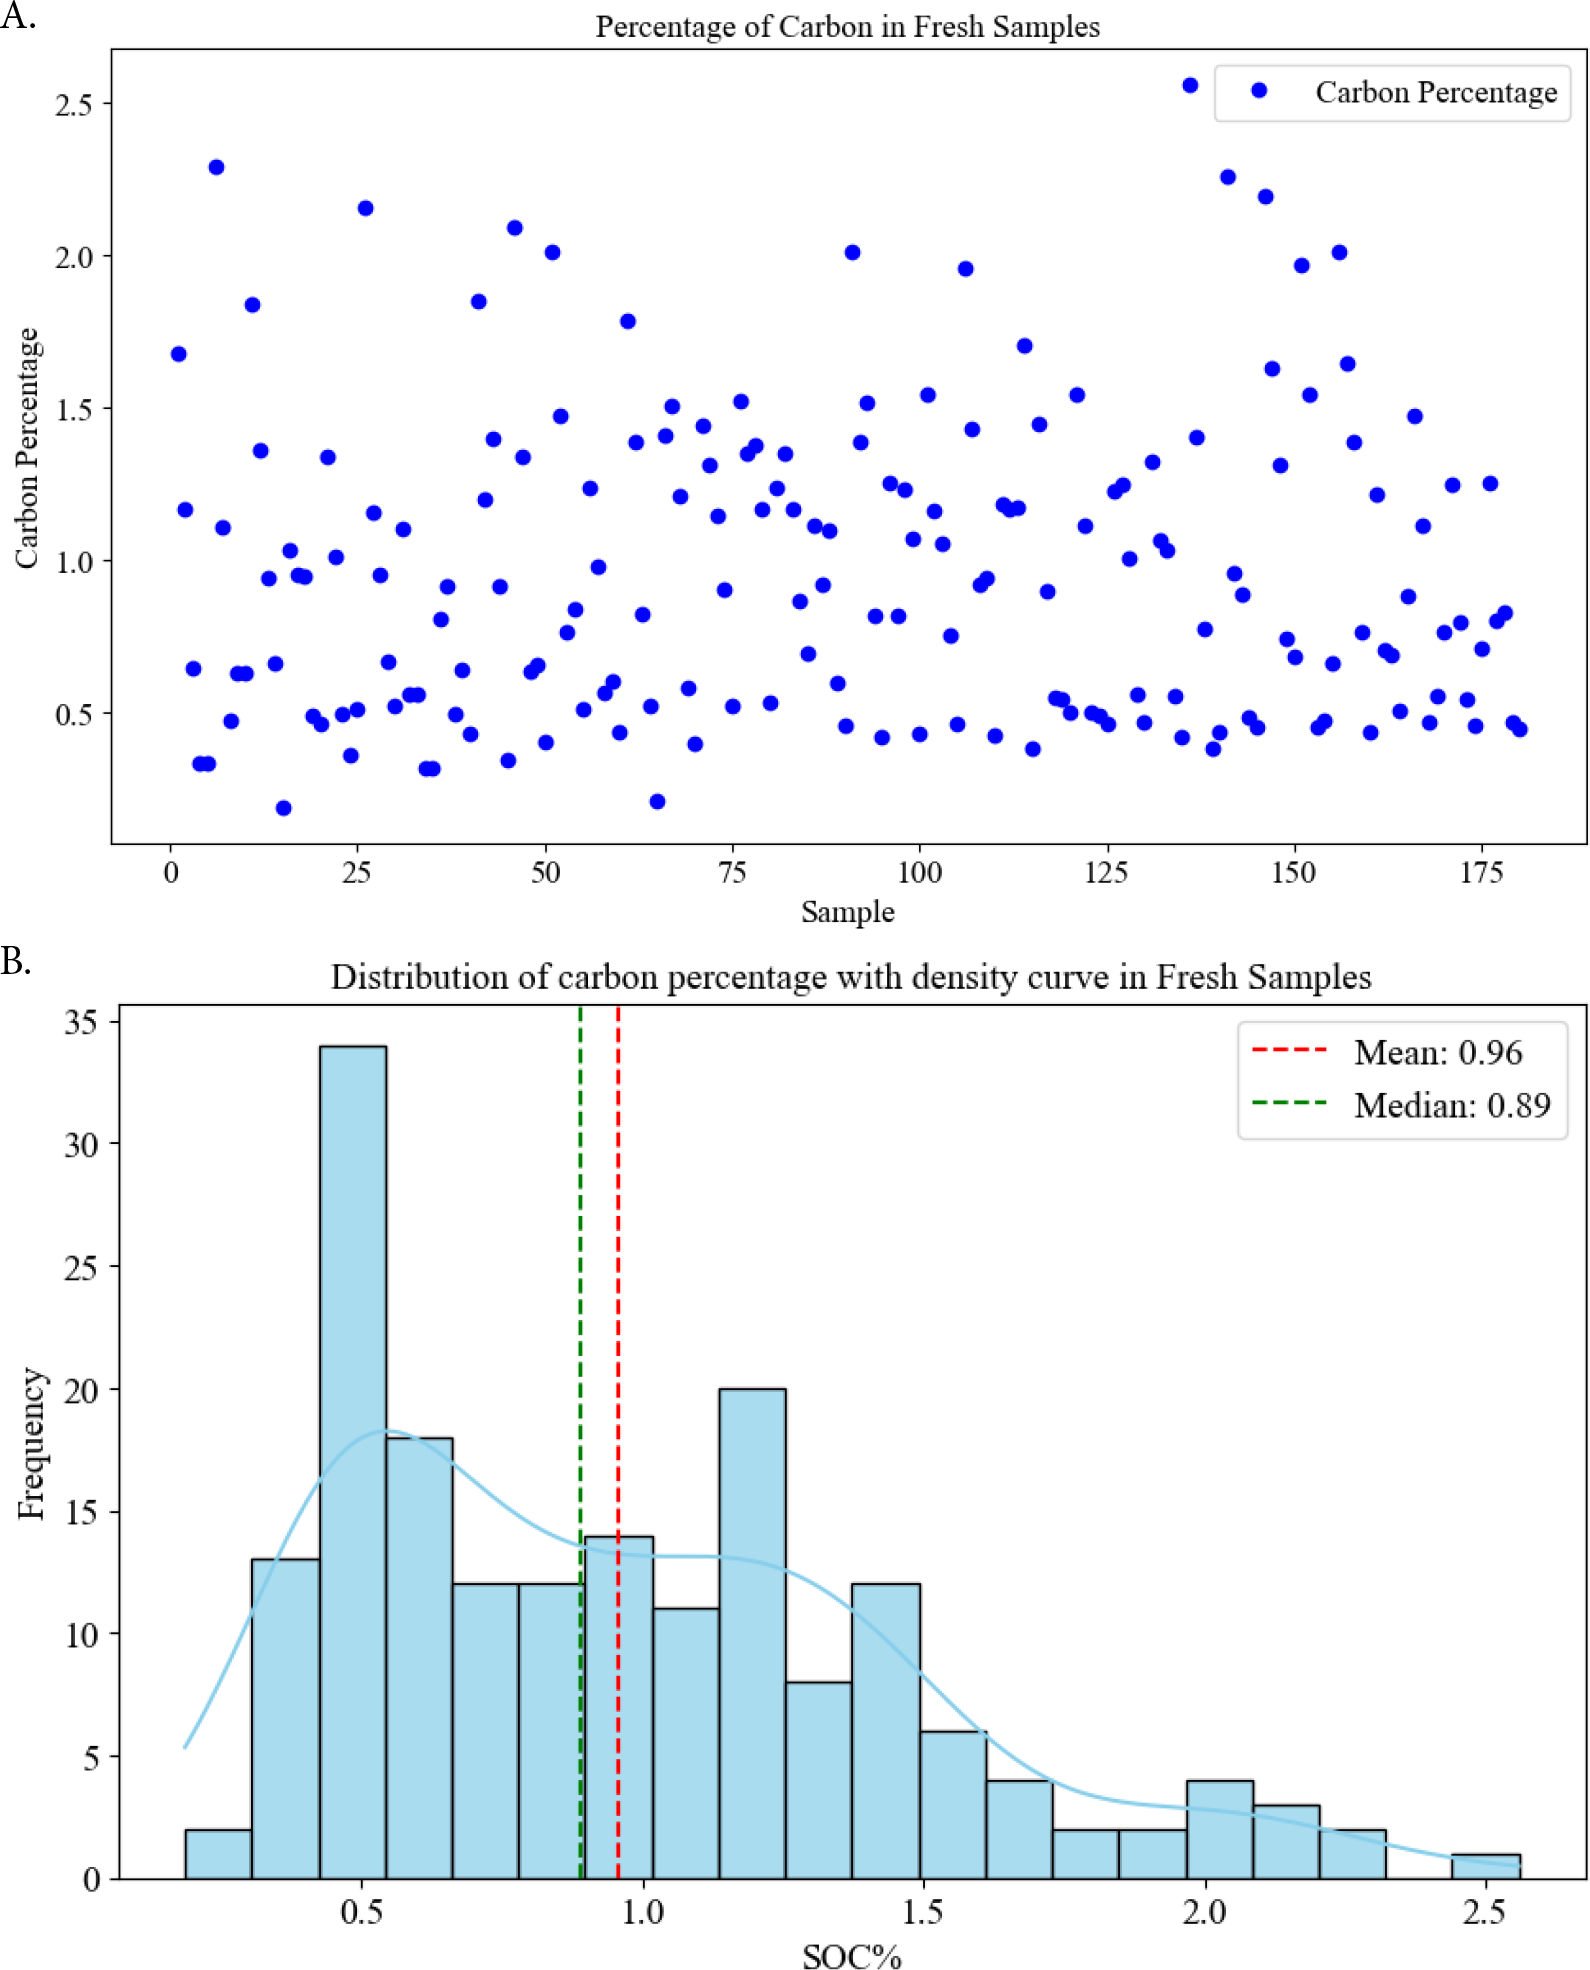 SOC - Soil Organic Carbon. Scatter diagram showing the distribution of carbon percentage across individual soil samples. Each blue dot represents the carbon percentage of a distinct soil sample. Frequency distribution of Soil Organic Carbon (SOC%) in fresh soil samples overlaid with a density curve. The dashed red line indicates the mean carbon percentage, while the dashed green line represents the median carbon percentage
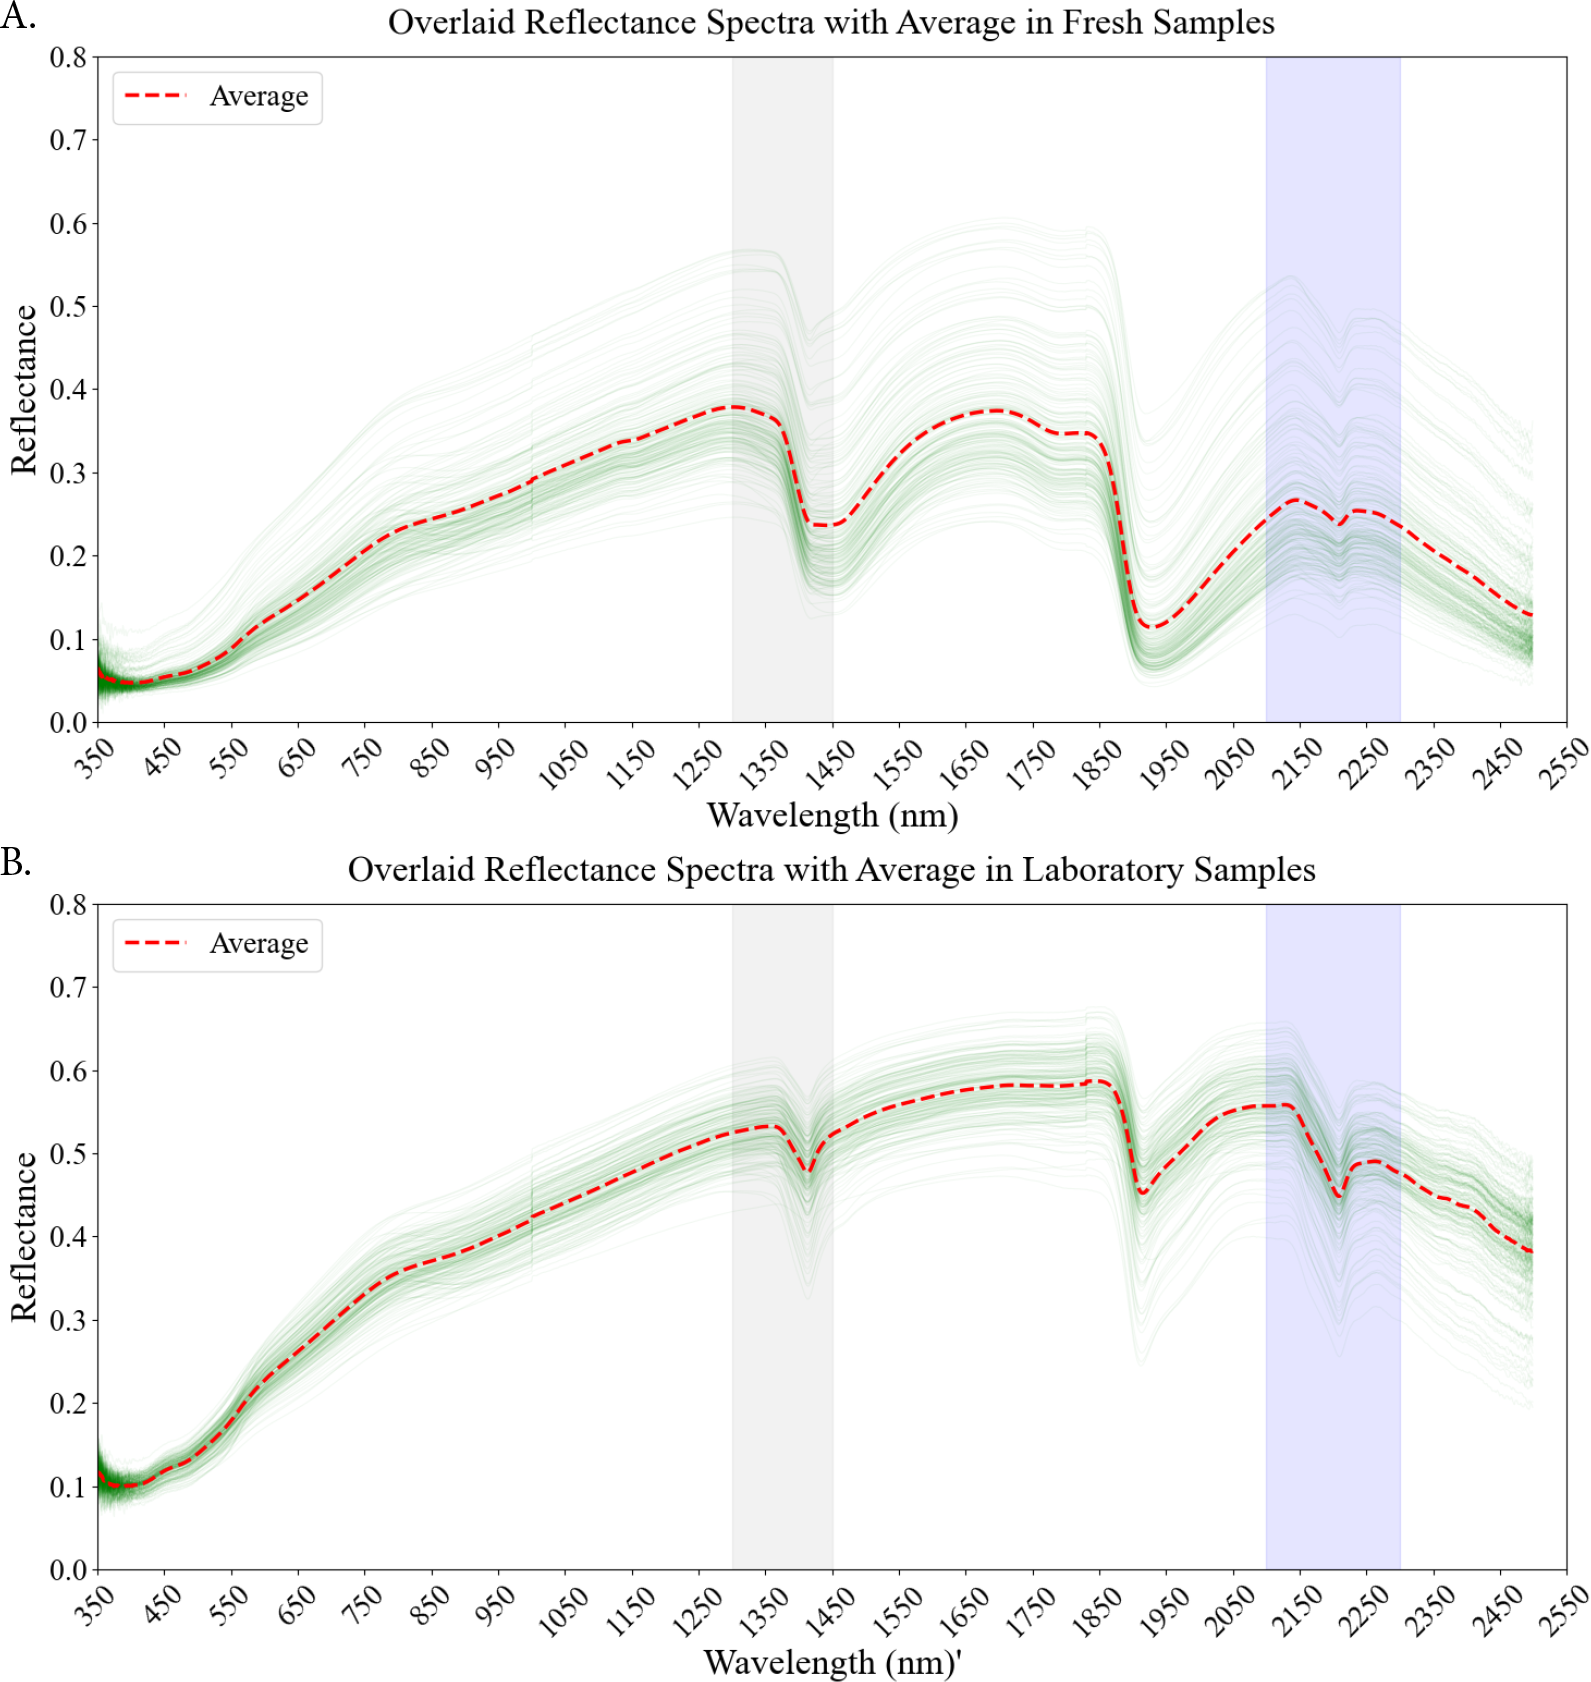 A. Reflectance spectra acquired from average fresh soil samples (collected in the field). The individual lines represent the reflectance spectrum for each fresh sample, showing how much light was reflected at different wavelengths (visible to near-infrared range). The average spectrum (thicker line) is overlaid to represent the general spectral characteristics and trends of the fresh samples within the dataset. B. Reflectance spectra obtained from the laboratory soil samples (drying, grinding, and sieving to standardize the sample condition). Each line corresponds to the reflectance spectrum of a laboratory-prepared sample, illustrating how light is reflected across different wavelengths. The average spectrum (thicker line) is overlaid to show the laboratory-processed samples’ overall spectral signature and central tendency. The vertical gray band, typically associated with organic matter, lies within the 1300-1450 nm range, while the vertical purple band, also linked to organic matter in previous studies, spans the 2100-2300 nm range

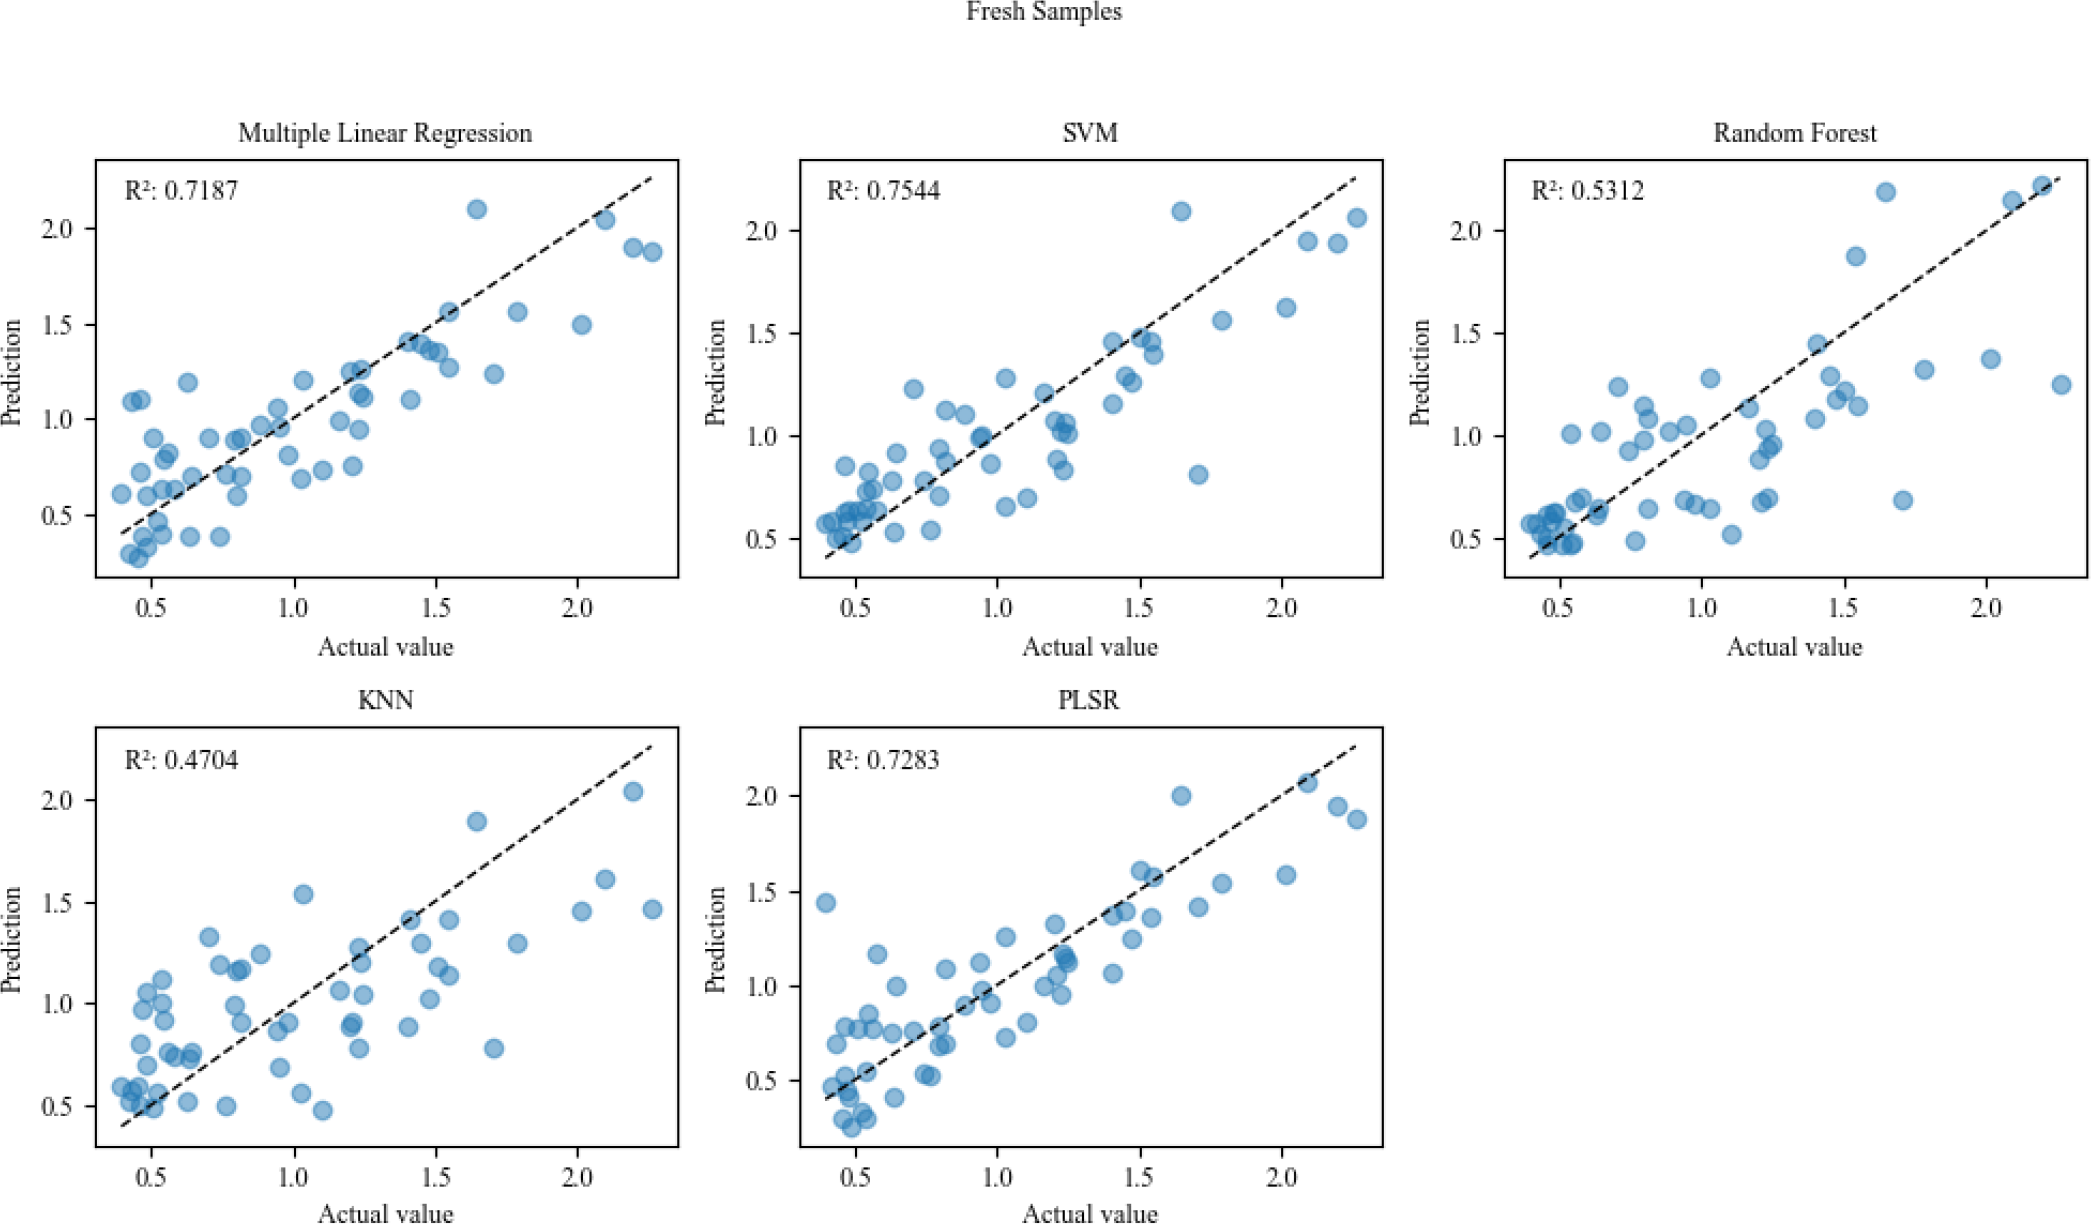 R2 - Coefficient of determination; SVM - Support Vector Machine; KNN - K-Nearest Neighbors and PLSR - Partial Least Squares Regression
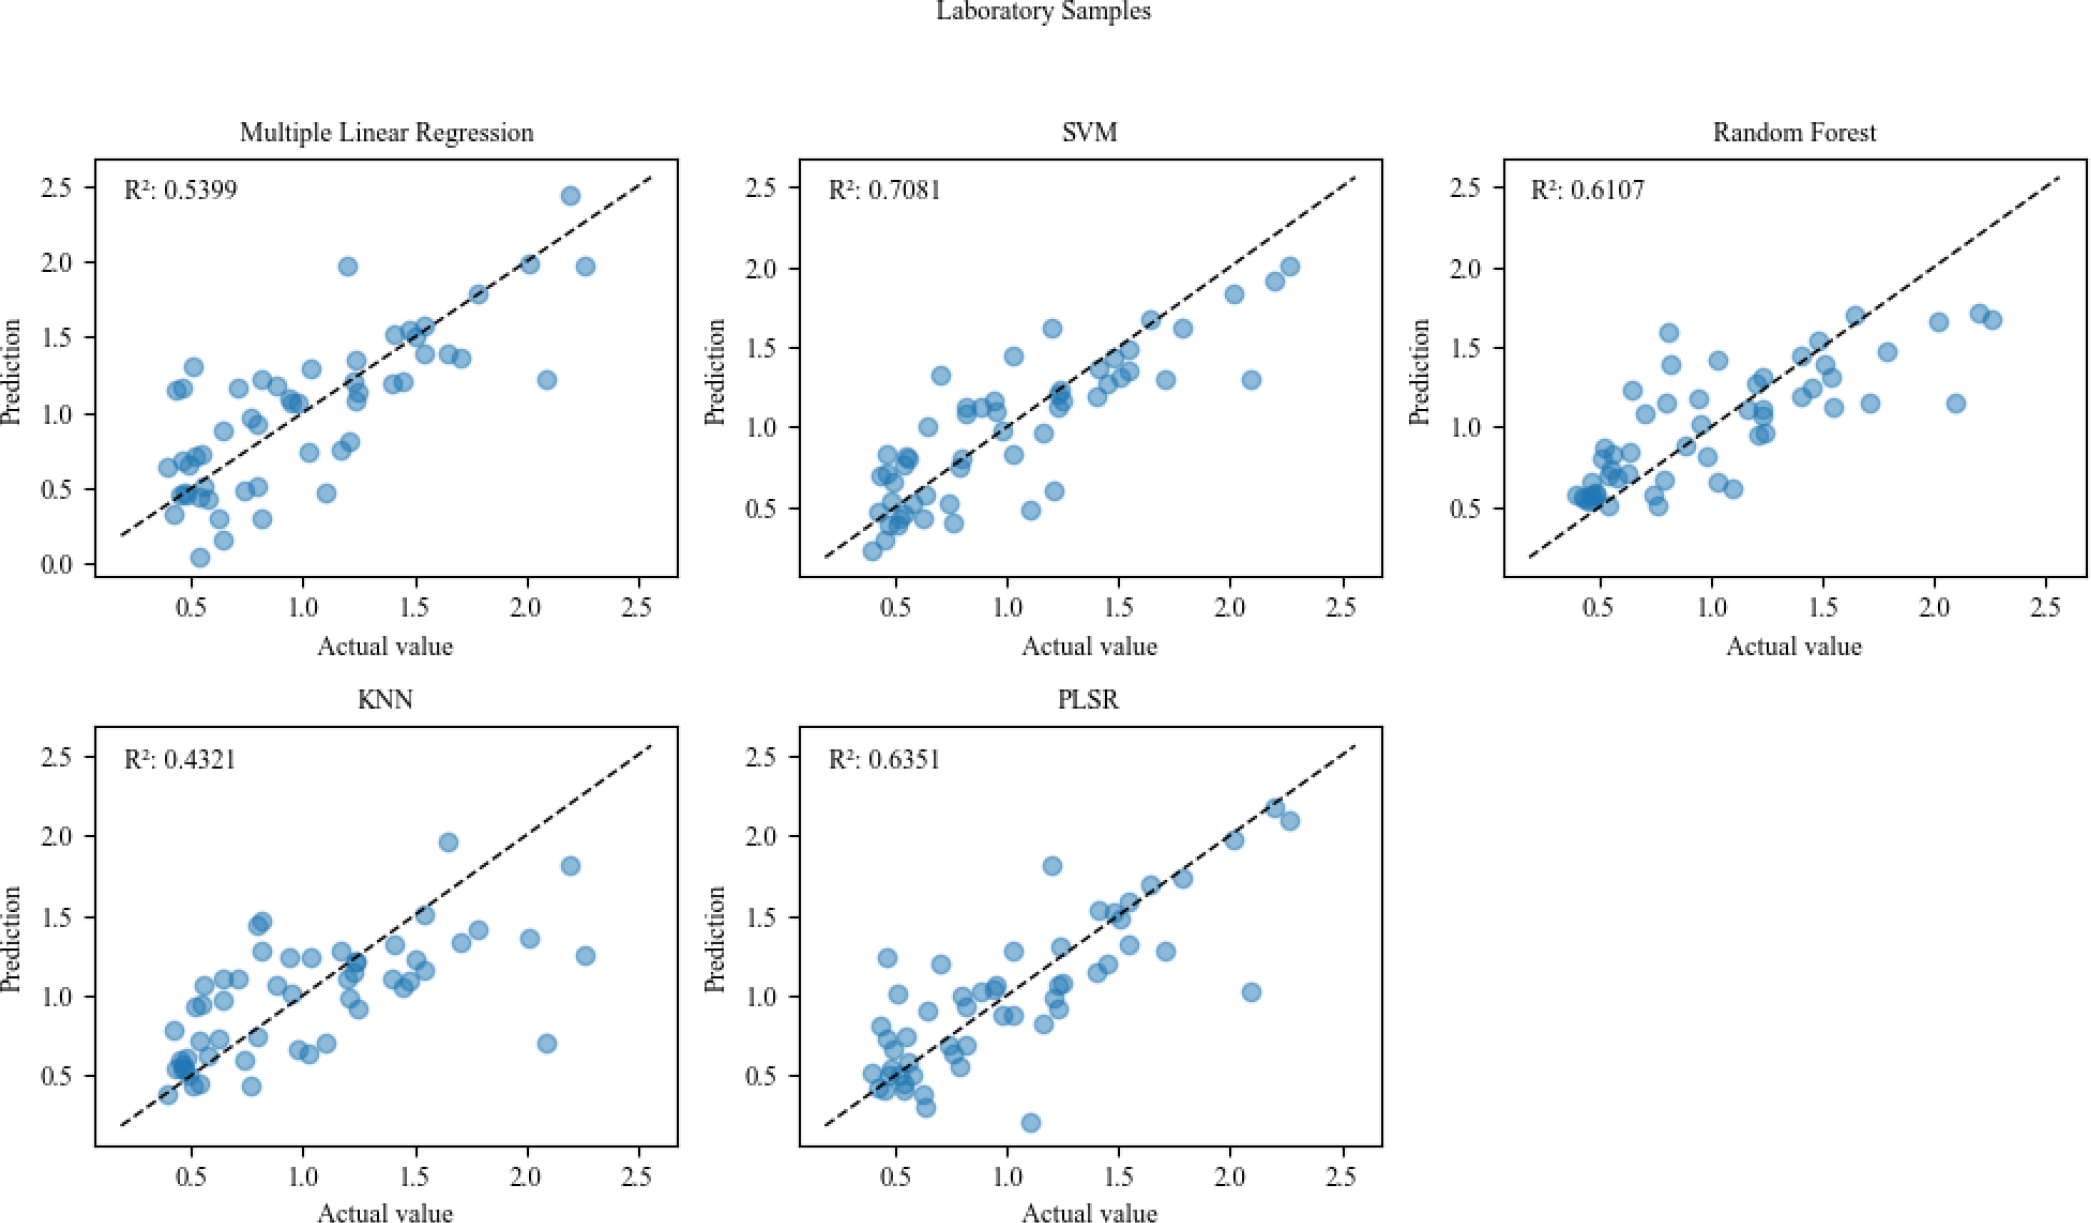 R2 - Coefficient of determination; SVM - Support Vector Machine; KNN - K-Nearest Neighbors and PLSR - Partial Least Squares Regression
 R2 - Coefficient of Determination; MSE - Mean Squared Error; MAE - Mean Absolute Error; RER - Range Error Ratio and RPD - Ratio of Performance to Deviation
 R2 - Coefficient of Determination; MSE - Mean Squared Error; MAE - Mean Absolute Error; RER - Range Error Ratio and RPD - Ratio of Performance to Deviation