 Assessing climate change impacts on irrigation water potential and demand for Vietnamese Mekong Delta1
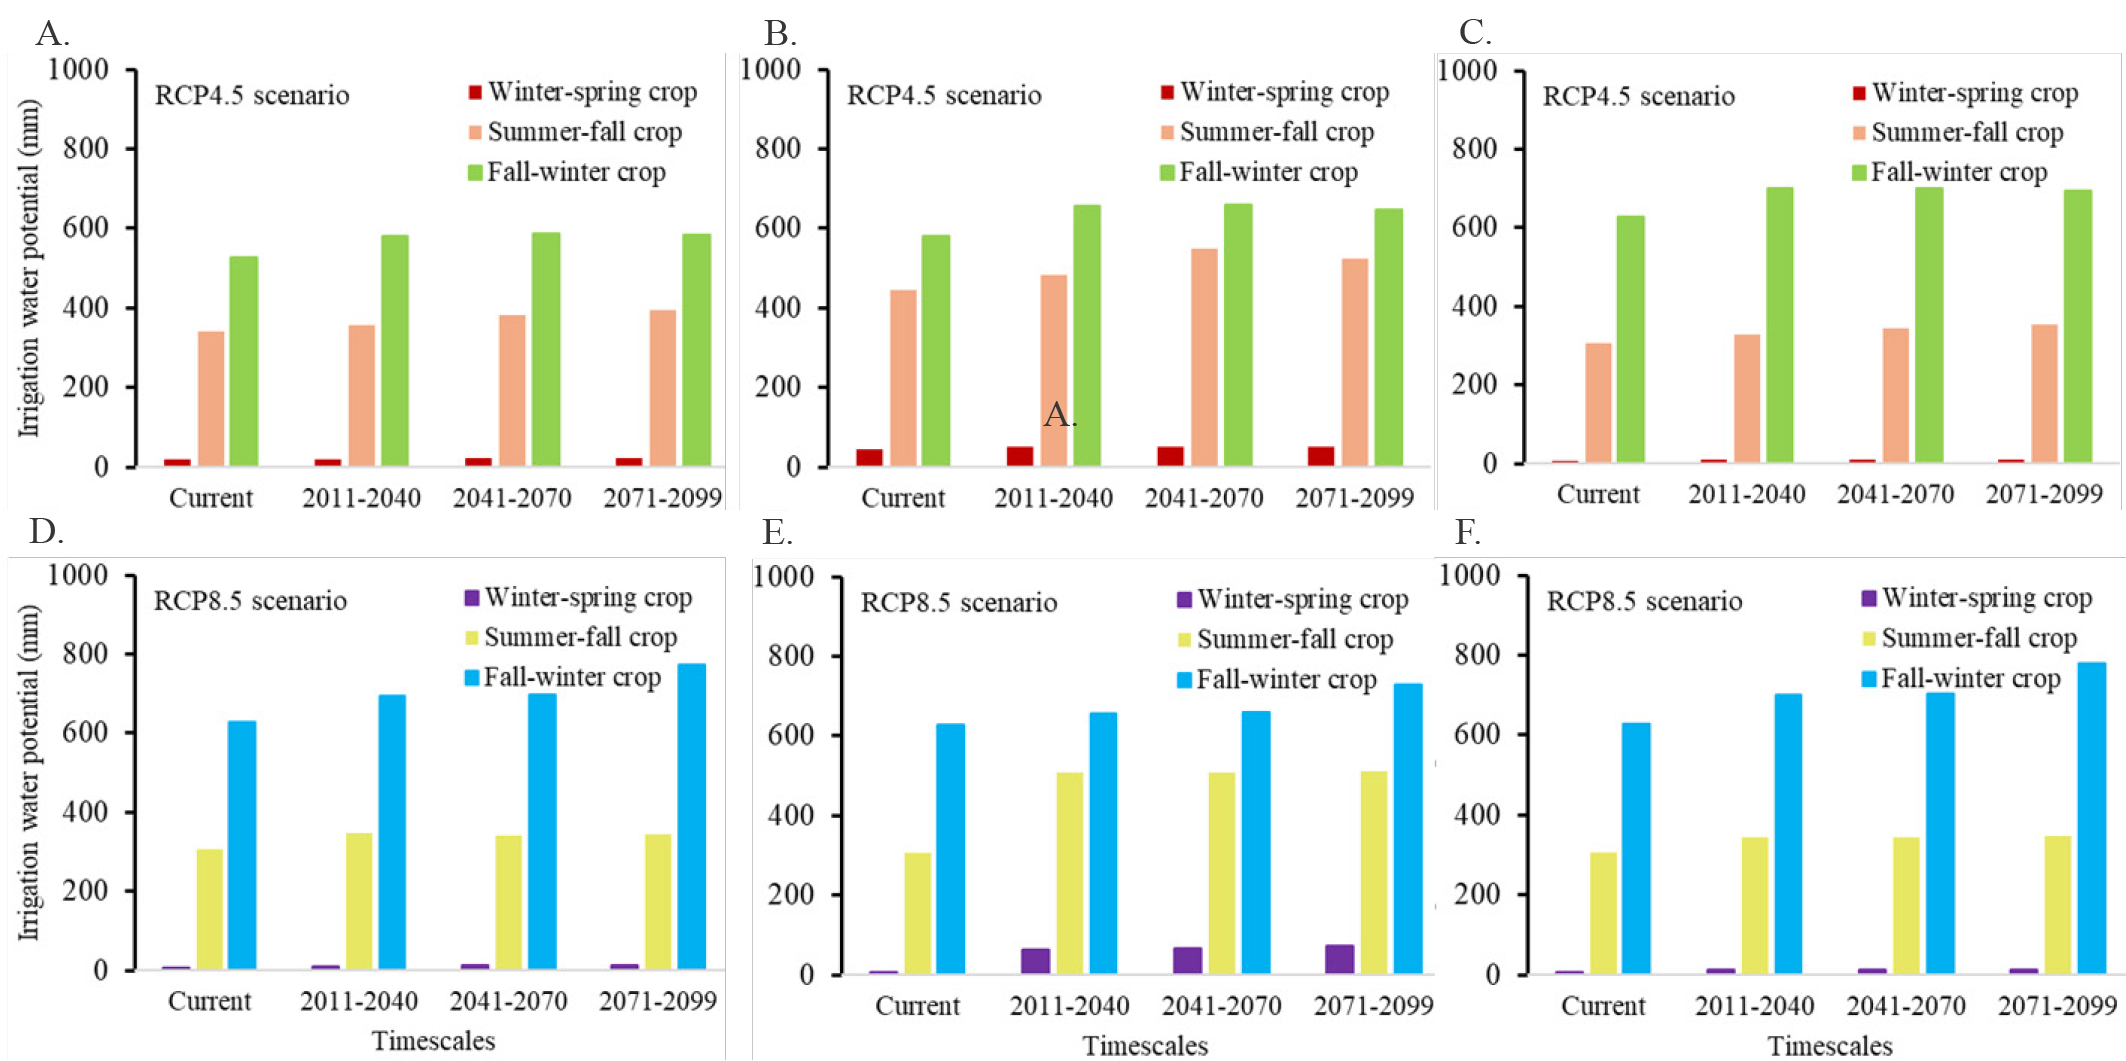
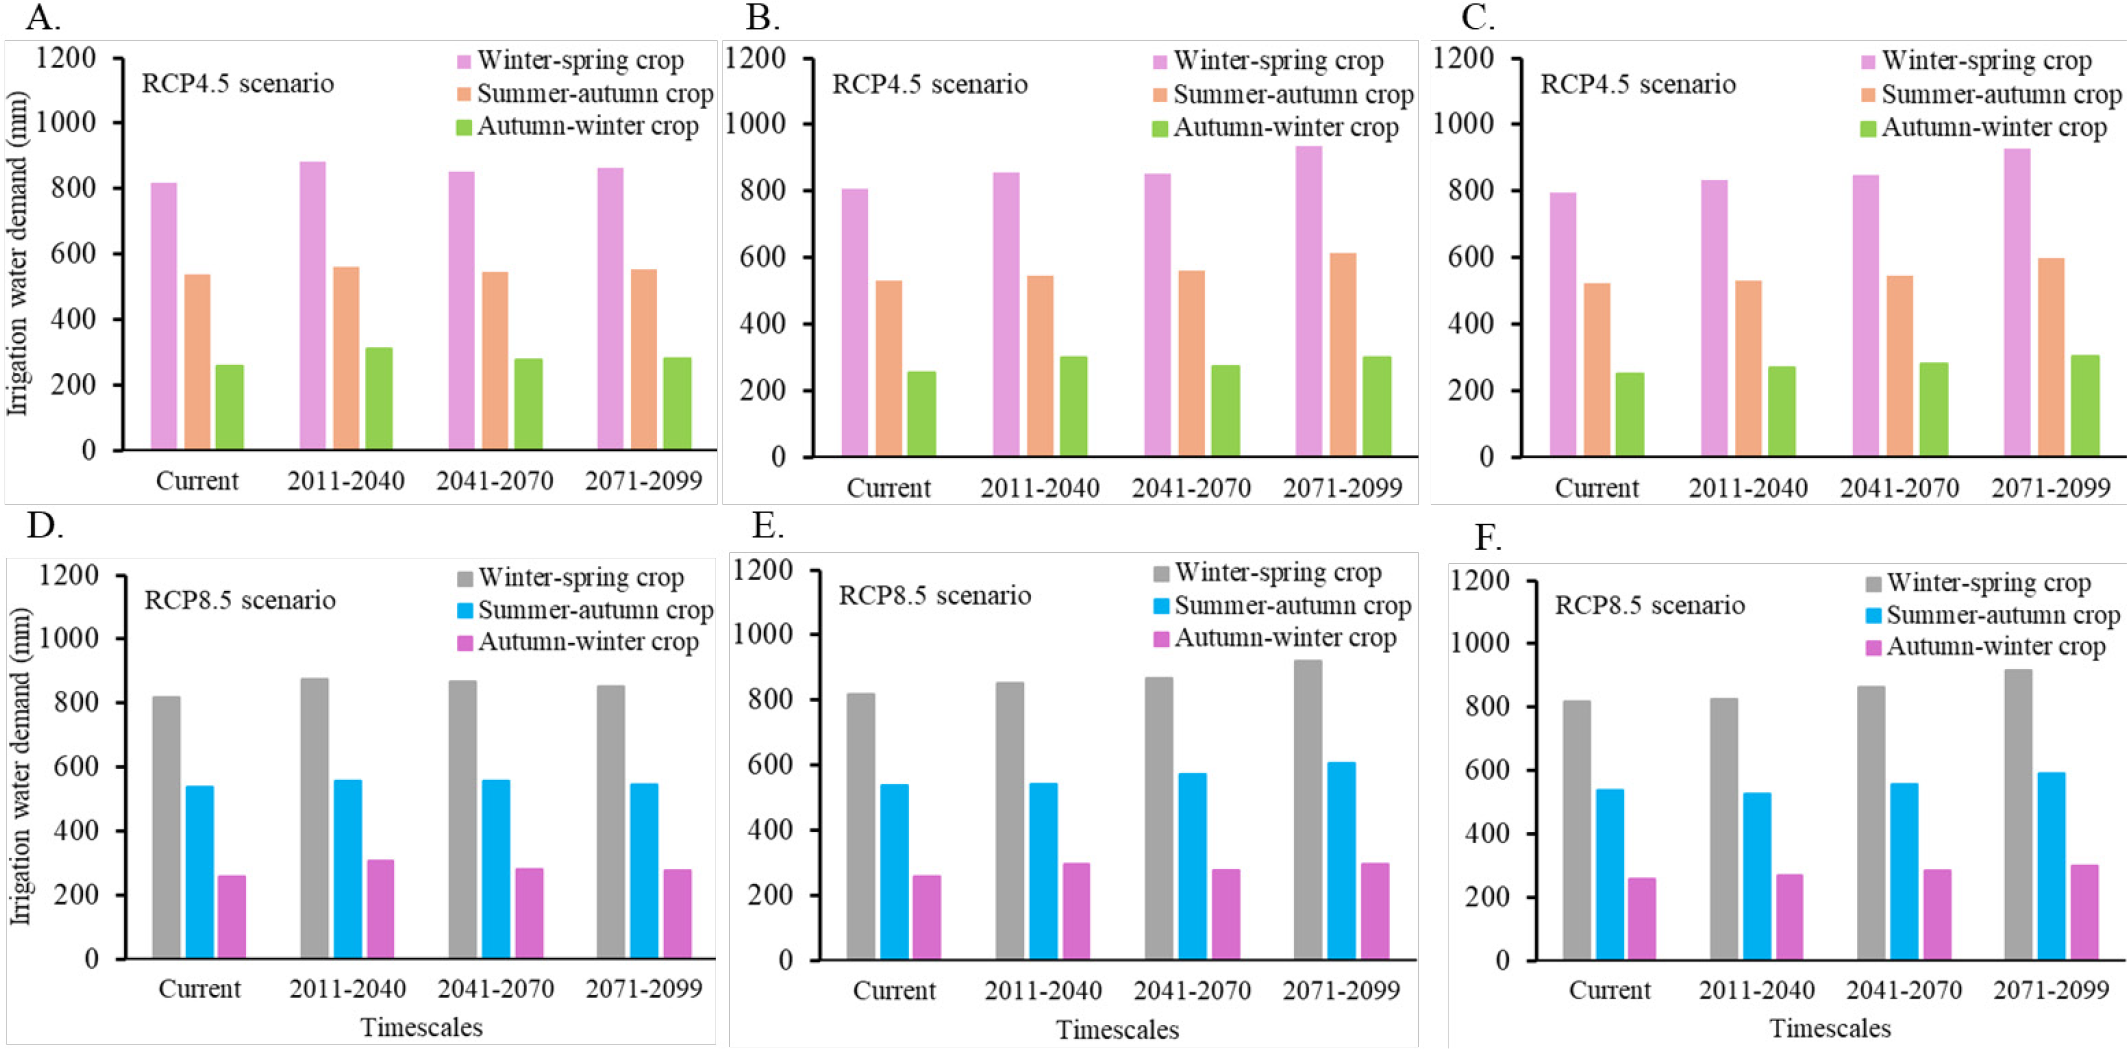
The Vietnamese Mekong Delta (VMD), a crucial region for rice cultivation, faces challenges from climate variability, including altered rainfall patterns, rising temperatures, and droughts, which pose risks of rain-fed water deficits. This study investigated the impacts of global climate change on irrigation water potential and irrigation water demand for rice paddies in the Plain of Reeds. The study applied the FAO-AquaCrop model to simulate irrigation water potential and irrigation water demand for the winter-spring, summer-fall, and fall-winter seasons under current climatic conditions (baseline) and future Representative Concentration Pathways - RCP4.5 and RCP8.5 scenarios for 2011-2040 (2025s), 2041-2070 (2055s), and 2071-2099 (2085s). The model was calibrated and validated against observed yield data from 2002-2023. The results indicate a general increase in irrigation water potential across seasons and sub-areas, with the winter-spring crop showing the most substantial rise (up to 65.7% by 2071-2099 under RCP8.5). Irrigation water demand also generally increased, particularly for the winter-spring crop, though RCP8.5 did not always result in higher demand than RCP4.5, suggesting complex climate-irrigation interactions. These findings highlight the need for adaptive water management and the potential of adjusting sowing schedules to mitigate increased irrigation water demand.
Key words:
climate change; irrigation water potential; FAO-AquaCrop; Oryza sativa; RCP scenarios
Climate variability enhances the rain-fed irrigation water potential across the Vietnamese Mekong Delta.
The winter-spring crop faces a potential increase in irrigation water deficits during the 2011-2040 time window.
Shifting sowing schedules can leverage increased rain-fed water potential amid complex climate-irrigation interactions.
 Thumbnail
 Thumbnail
 Thumbnail
 Thumbnail
 Thumbnail
 Thumbnail
 Thumbnail
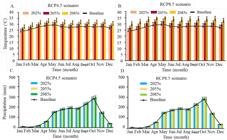
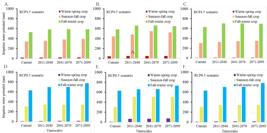
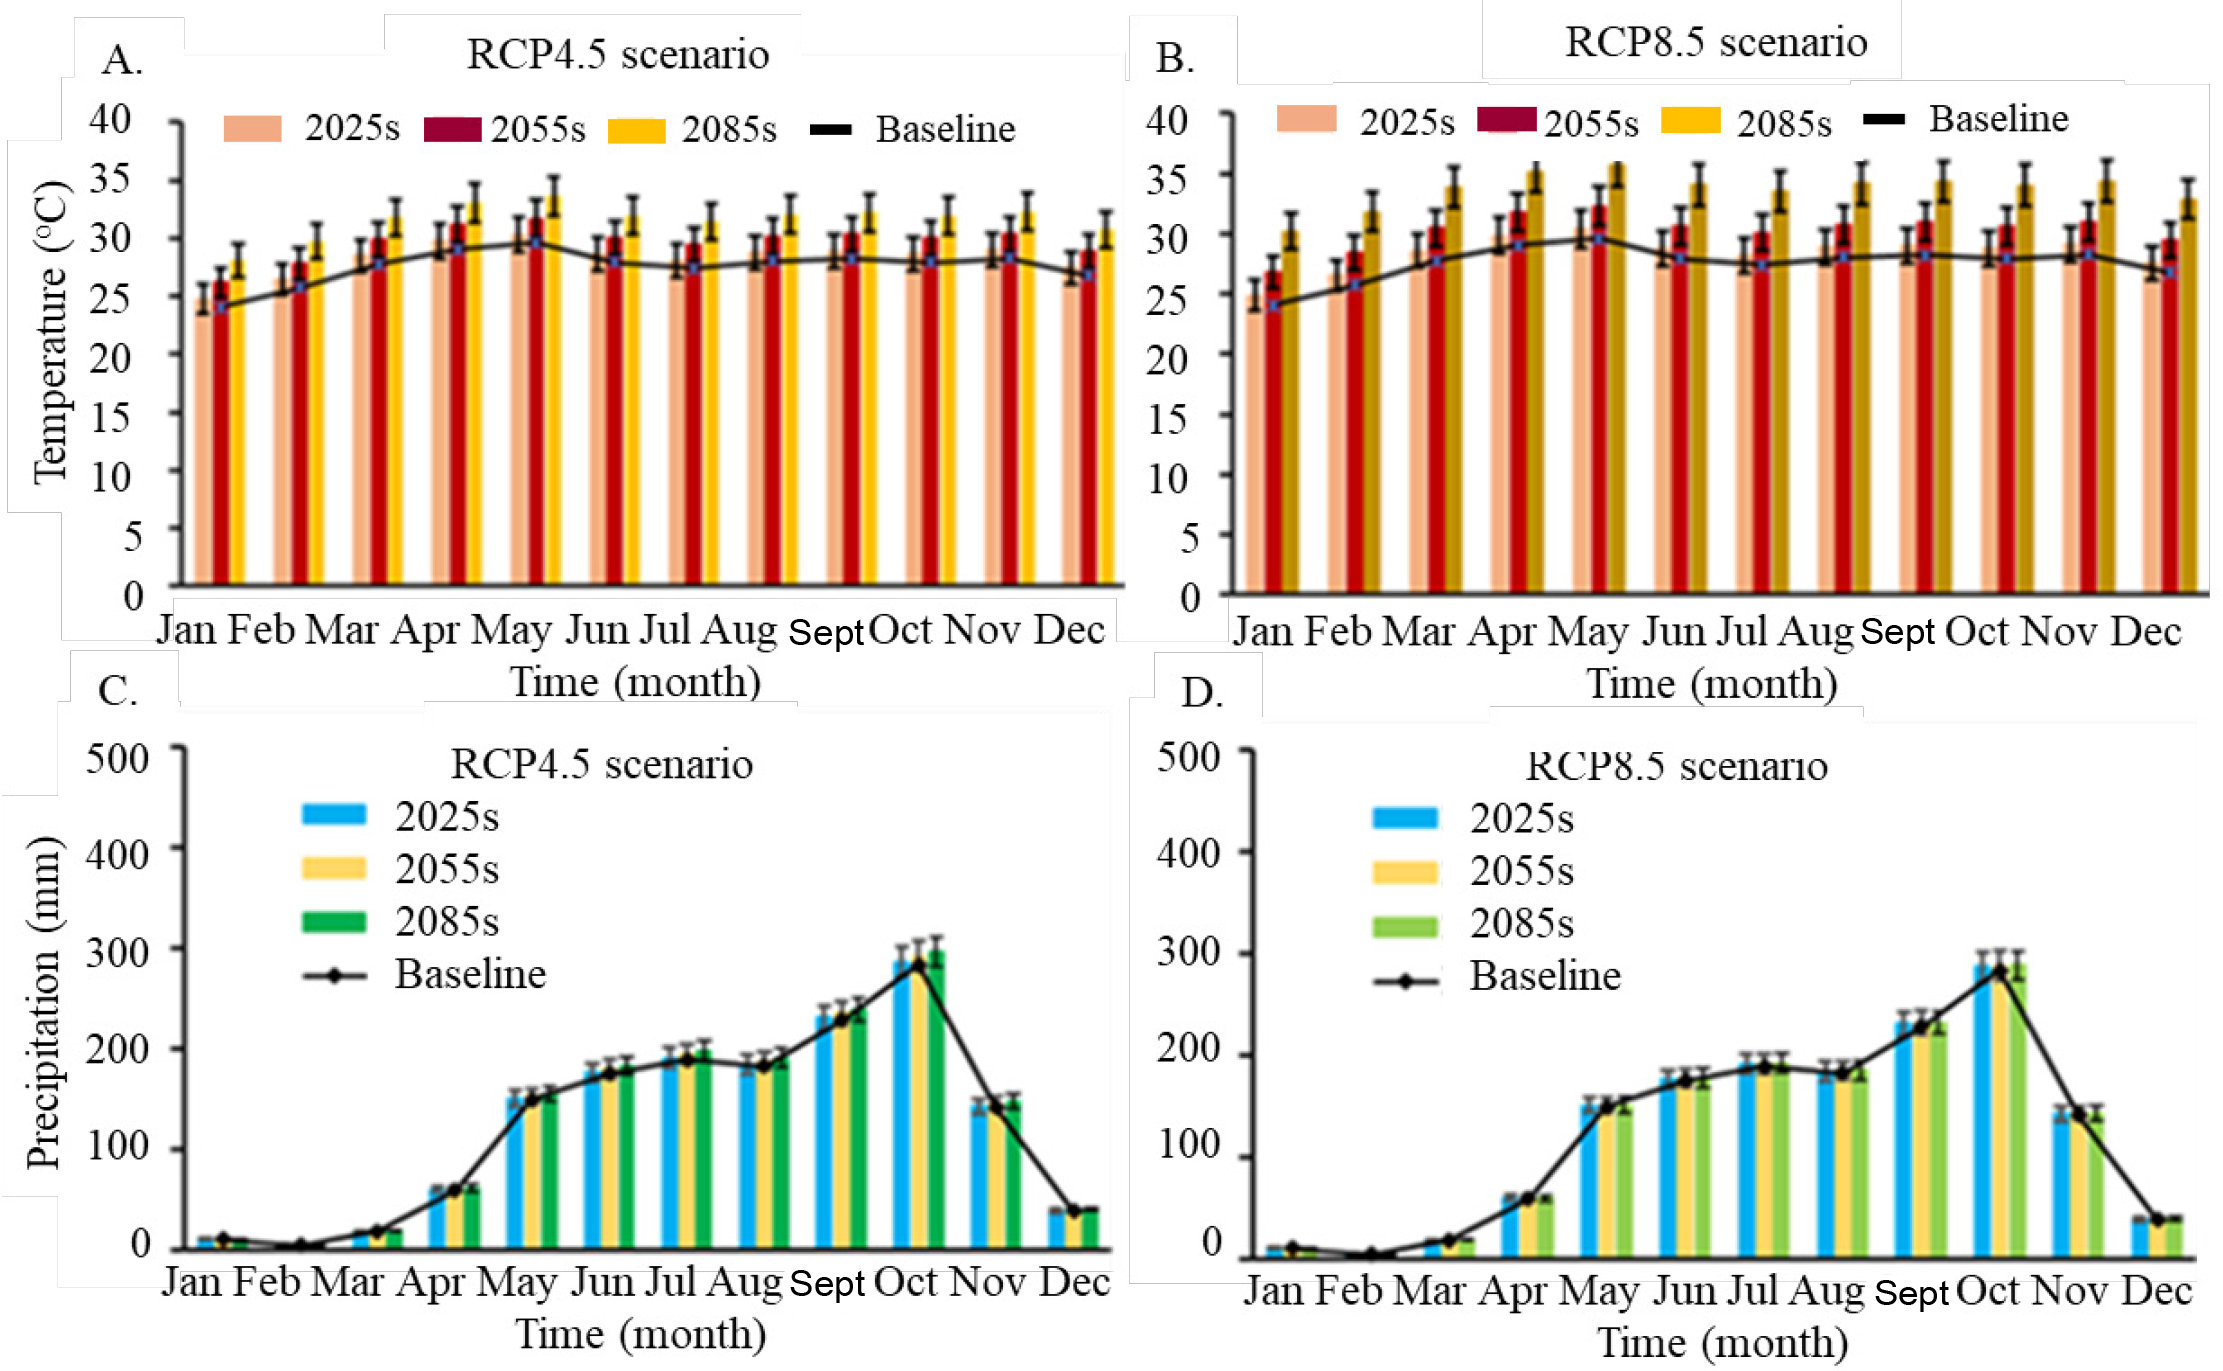 Error bars represent standard errors from the ensemble of Global Circulation Models (GCMs); RCP - Representative Concentration Pathways
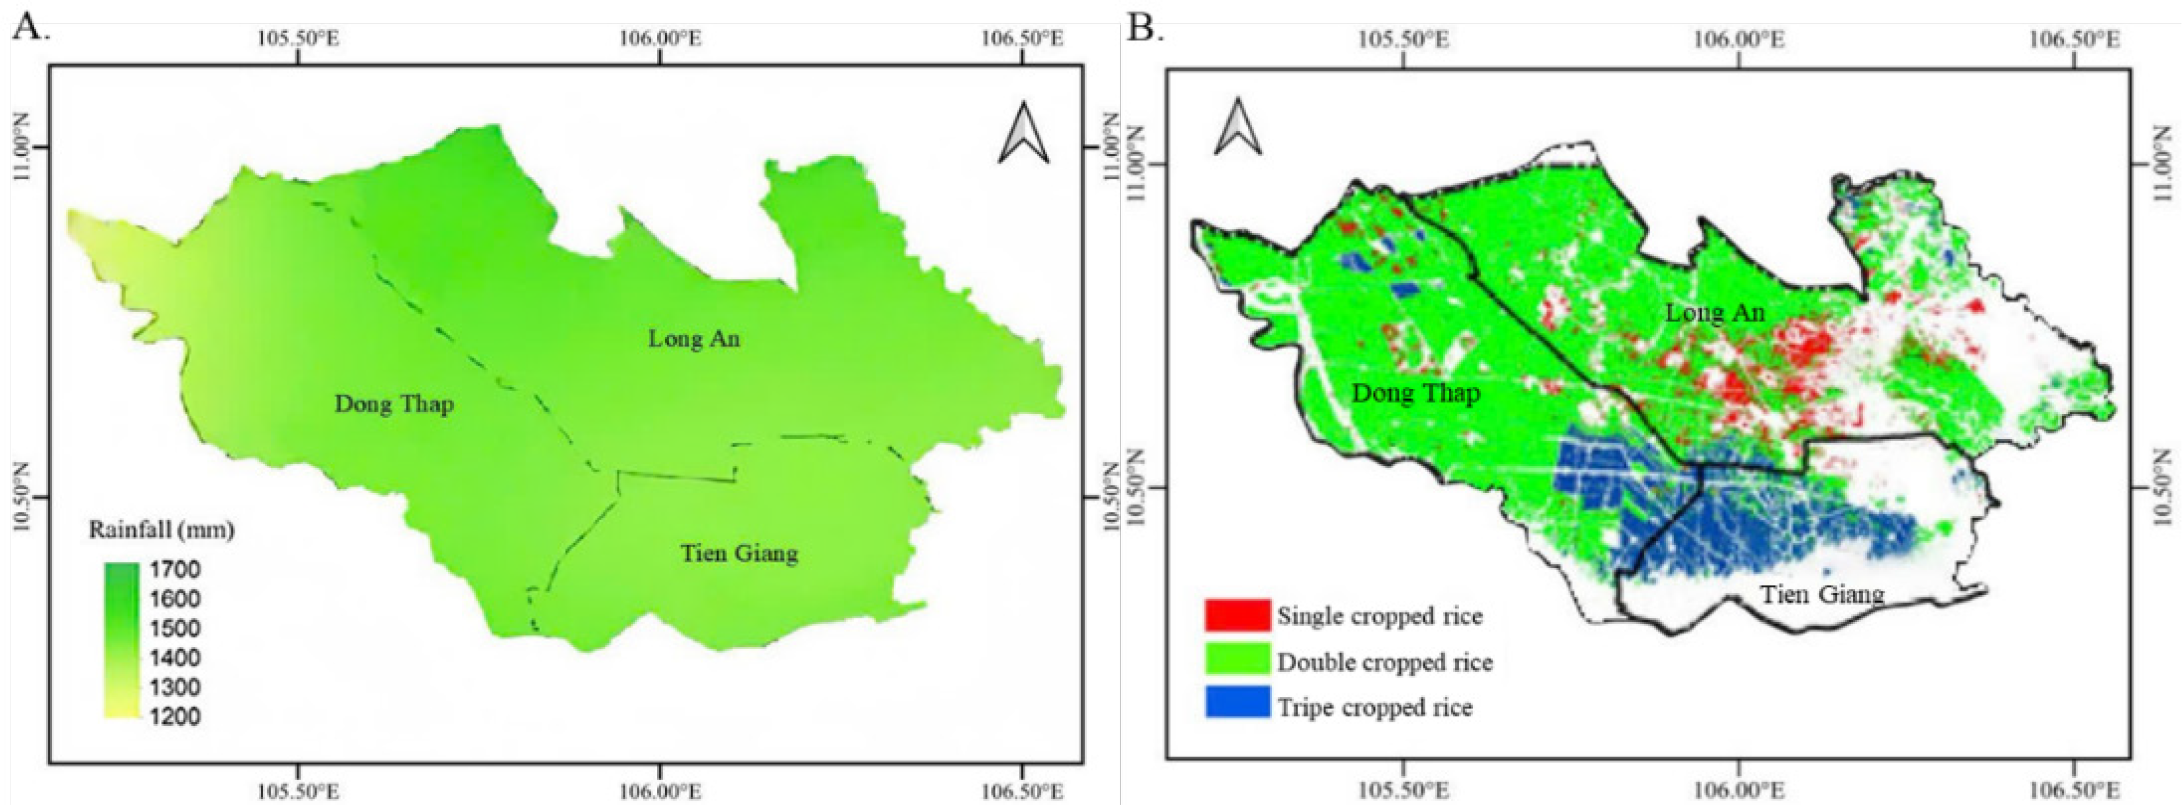 (Source: Adapted from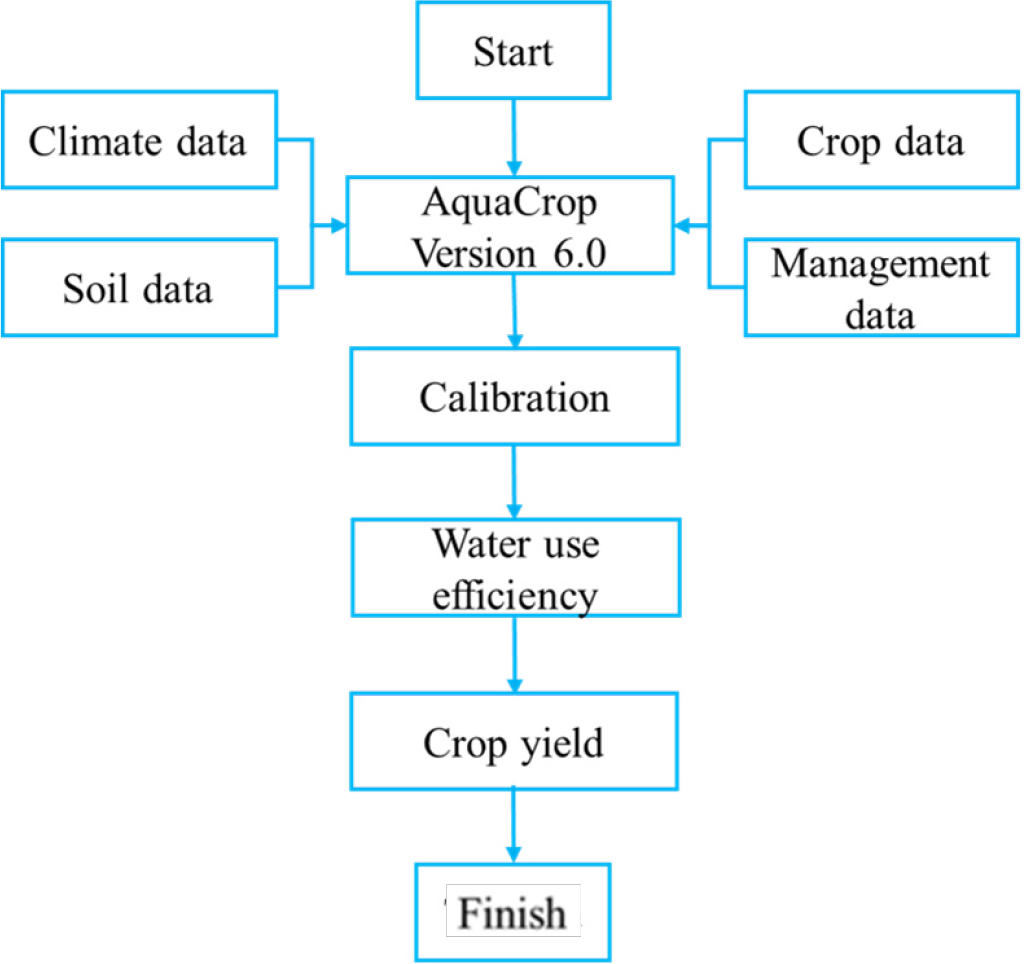
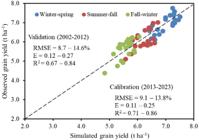
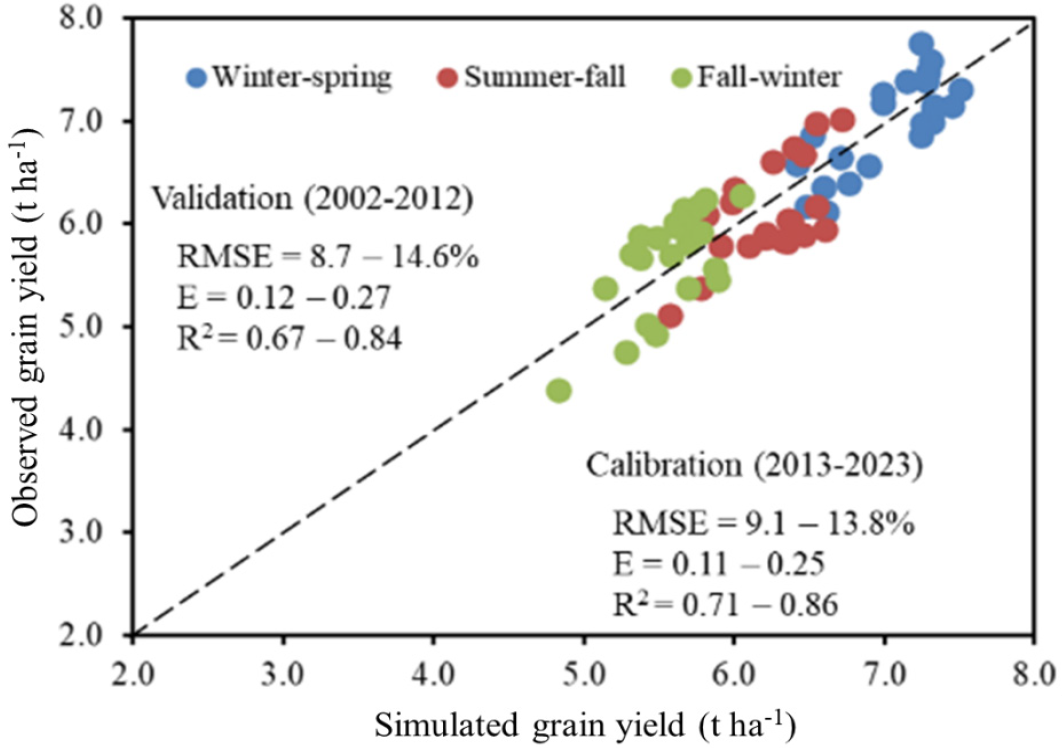 The dashed line is the 1:1 line. Inset text shows root mean square error (RMSE) (% of mean observed yield), Index of Agreement (E), and R2 for calibration (2013-2023) and validation (2002-2012) periods