 Assessing climate change impacts on irrigation water potential and demand for Vietnamese Mekong Delta1
ABSTRACT
The Vietnamese Mekong Delta (VMD), a crucial region for rice cultivation, faces challenges from climate variability, including altered rainfall patterns, rising temperatures, and droughts, which pose risks of rain-fed water deficits. This study investigated the impacts of global climate change on irrigation water potential and irrigation water demand for rice paddies in the Plain of Reeds. The study applied the FAO-AquaCrop model to simulate irrigation water potential and irrigation water demand for the winter-spring, summer-fall, and fall-winter seasons under current climatic conditions (baseline) and future Representative Concentration Pathways - RCP4.5 and RCP8.5 scenarios for 2011-2040 (2025s), 2041-2070 (2055s), and 2071-2099 (2085s). The model was calibrated and validated against observed yield data from 2002-2023. The results indicate a general increase in irrigation water potential across seasons and sub-areas, with the winter-spring crop showing the most substantial rise (up to 65.7% by 2071-2099 under RCP8.5). Irrigation water demand also generally increased, particularly for the winter-spring crop, though RCP8.5 did not always result in higher demand than RCP4.5, suggesting complex climate-irrigation interactions. These findings highlight the need for adaptive water management and the potential of adjusting sowing schedules to mitigate increased irrigation water demand.
Key words:
climate change; irrigation water potential; FAO-AquaCrop; Oryza sativa; RCP scenarios
HIGHLIGHTS:
Climate variability enhances the rain-fed irrigation water potential across the Vietnamese Mekong Delta.
The winter-spring crop faces a potential increase in irrigation water deficits during the 2011-2040 time window.
Shifting sowing schedules can leverage increased rain-fed water potential amid complex climate-irrigation interactions.
RESUMO
O Delta do Mekong vietnamita, uma região crucial para o cultivo de arroz, enfrenta desafios decorrentes da variabilidade climática, incluindo alterações nas chuvas, aumento das temperaturas e secas, que representam riscos de déficits hídricos em lavouras de sequeiro devido às mudanças climáticas globais. Neste estudo foi investigado os impactos das mudanças climáticas globais no potencial de água para irrigação e na demanda de água para irrigação em arrozais na Planície dos Juncos. O estudo aplicou o modelo FAO-AquaCrop para simular o potencial e a demanda de água para irrigação para as safras de inverno-primavera, verão-outono e outono-inverno sob as condições climáticas atuais (cenário base) e cenários futuros Vias de concentração representativas RCP4.5 e RCP8.5 para os períodos de 2011-2040 (2025s), 2041-2070 (2055s) e 2071-2099 (2085s). O modelo foi calibrado e validado com base em dados de produtividade observados de 2002 a 2023. Os resultados indicam um aumento geral no potencial de água para irrigação em todas as safras e subáreas, com a safra de inverno-primavera apresentando o aumento mais substancial (até 65,7% até 2071-2099 sob o cenário RCP8.5). A demanda de água para irrigação também apresentou um aumento geral, particularmente para a safra de inverno-primavera, embora o cenário RCP8.5 nem sempre tenha resultado em uma demanda maior que o RCP4.5, o que sugere interações complexas entre clima e irrigação. Estes resultados destacam a necessidade de uma gestão adaptativa dos recursos hídricos e o potencial do ajuste nos calendários de semeadura para mitigar o aumento da demanda de água para irrigação.
Palavras-chave:
mudanças climáticas; potencial hídrico para irrigação; FAO-AquaCrop; Oryza sativa; cenários RCP
INTRODUCTION
The Vietnamese Mekong Delta (VMD) is one of the two key rice cultivation regions in Vietnam (Lee & Dang, 2020; Dang, 2021). In recent years, agricultural production in this area has faced escalating challenges, including more frequent heatwaves, rising mean temperatures, increased drought occurrences, and unpredictable fluctuations in rain-fed water availability (Mainuddin et al., 2013; Dang, 2021). These factors pose significant risks of water deficits for irrigation (Aggarwal & Singh, 2010; Ansari et al., 2021). Furthermore, direct water resources from primary irrigation channels have been diminishing due to a combination of global climate change (GCC) impacts and unsustainable anthropogenic activities (UAAs) (Dang et al., 2021; Nguyen et al., 2022). GCC is a primary driver of increased irrigation water demands (IWDs) and variability in irrigation water potential (IWP), significantly affecting agricultural irrigation (Aggarwal & Singh, 2010; Gupta & Mishra, 2019). The decline in water availability from main irrigation channels, influenced by UAAs, further exacerbates these IWDs (Dang, 2021).
The VMD is recognized as one of five key deltas globally that are highly vulnerable to GCC (Lee & Dang, 2020), with the Plain of Reeds being a major agricultural zone within it (Dang, 2021; Dinh & Dang, 2022). A report by the Ministry of Natural Resources and Environment (2016) confirmed that the VMD is projected to experience significant temperature increases and sharp changes in precipitation patterns due to GCC (Ansari et al., 2021; Gentilucci & D‘Aprile, 2021). These climatic shifts are expected to adversely affect rice growth and development (Gentilucci & D‘Aprile, 2021), as rice cultivation is particularly sensitive to variations in temperature and precipitation (Ansari et al., 2021). Consequently, studies on IWD and IWP are crucial for ensuring sustainable crop production, especially in rain-fed regions (Boonwichai et al., 2019; Alejo, 2021). While GCC is anticipated to reduce water availability in many regions (Deryng et al., 2014), with Asia projected to face severe consequences throughout the 21st century (Lee & Dang, 2020; Nguyen et al., 2022), understanding region-specific impacts is vital. Studies have indicated that irrigation water from rain-fed sources may decrease due to rising temperatures and altered precipitation under GCC (Gupta & Mishra, 2019).
In this context, the risk of experiencing IWDs in agricultural production is persistent, primarily due to diminishing water availability (Alejo, 2021; Dang et al., 2021). To address these challenges, various crop models, such as ALMANAC, APSIM, AMS-AgrometShell, AquaCrop, CropSyst, DSSAT-CERES-Rice, SWAP, ORYZA, and SUCROS, are recognized as effective decision-support tools (Kroes et al., 2019; Pazhanivelan et al., 2022). For instance, Alejo (2021) used the DSSAT-CERES-Rice model in the Philippines to show that GCC could reduce aerobic rice yield improvements from 83 to 53% by the end of the 21st century. Shrestha et al. (2014) studied GCC impacts on IWD and rice yield in rain-fed areas of Nepal. In Myanmar, a study using the FAO-AquaCrop model showed an increasing trend in rice yield in rain-fed areas under future climate scenarios (Shrestha et al., 2014). In Vietnam, Dang (2021) used FAO-AquaCrop to assess GCC impacts on rice yield and determine optimal sowing periods in the Plain of Reeds, finding significant yield improvements with adjusted sowing. While the study by Dang (2021) primarily addressed yield optimization, there remains a need for a comprehensive evaluation of both IWP and IWD across diverse future scenarios and cropping seasons in the Plain of Reeds, employing a robust modeling framework such as AquaCrop.
Therefore, to provide valuable insights for developing adaptive water management strategies, this study aims to estimate IWP and IWD in rice-growing areas of the Mekong Delta, Vietnam, using the FAO-AquaCrop model with detailed crop, soil, and climate data, along with current and projected crop management practices under different climate change scenarios.
MATERIAL AND METHODS
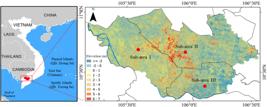
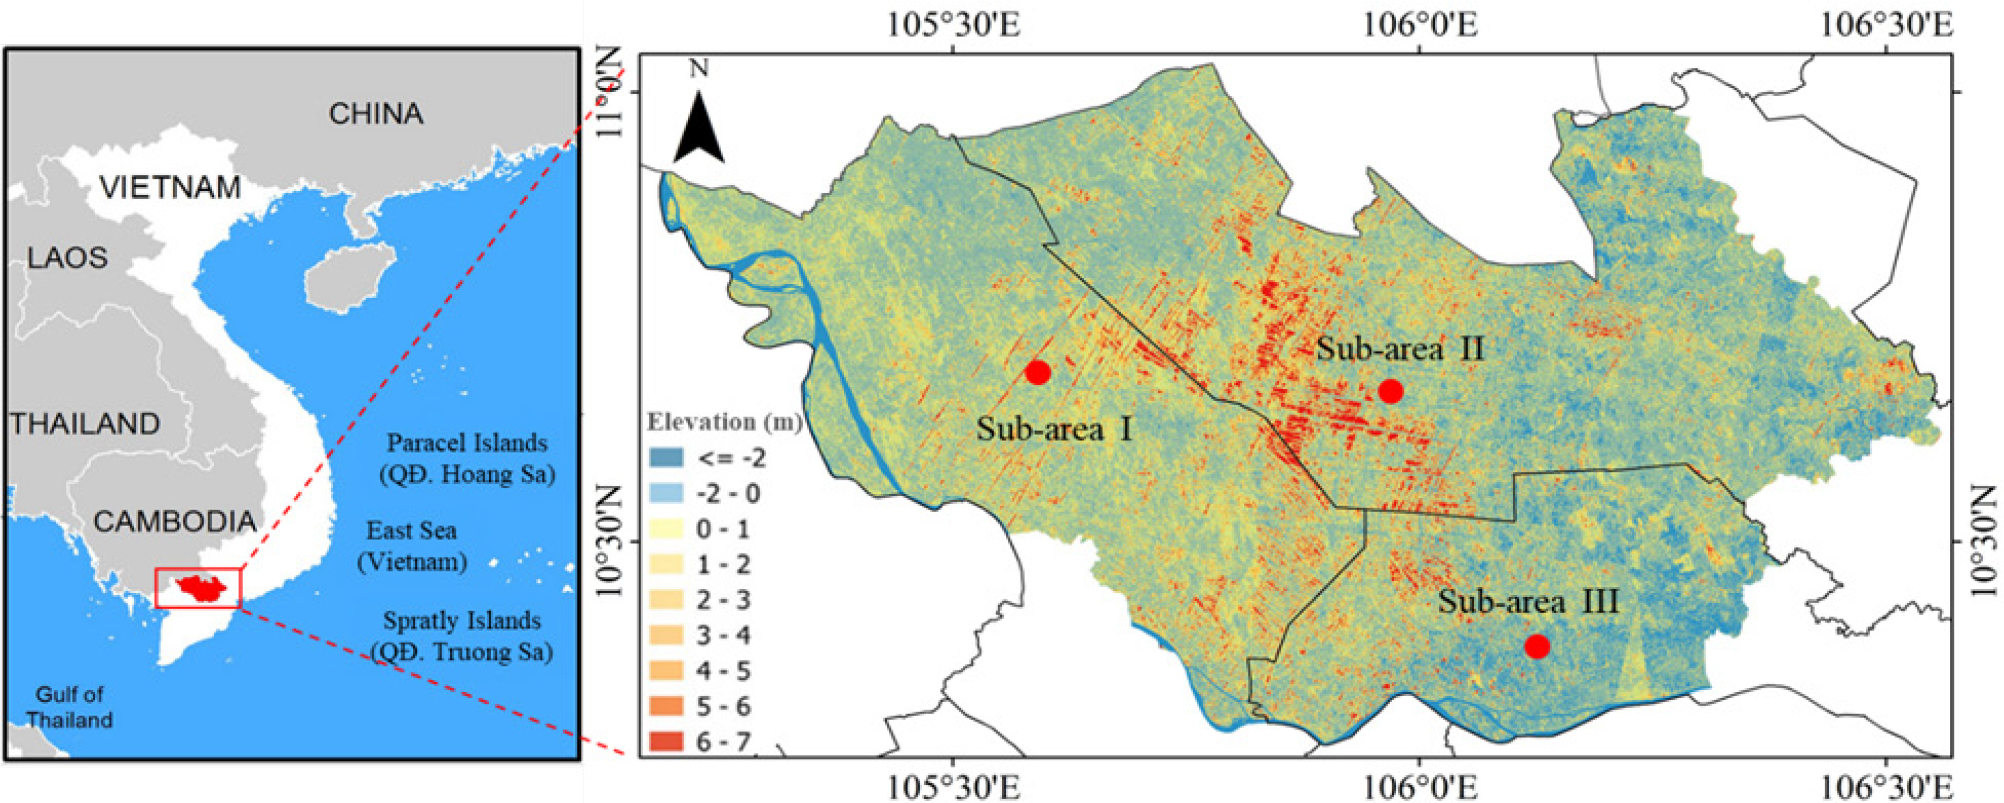
The Plain of Reeds, situated between 10° 04' 56" and 11° 00' N latitude, and from 105° 03' 15" to 106° 09' 33" E longitude, is a floodplain region encompassing parts of Dong Thap, Tien Giang, and Long An Provinces in the VMD, Vietnam (Deb et al., 2016; Dang, 2021). The region has a total rice-growing area of approximately 697,000 hectares (Figure 1).
Located in the northwestern VMD, its climate is influenced by the East Asian monsoon (rainy season: May-November) and the Siberian high-pressure system (dry season: December-April) (Lee & Dang, 2020; Dang, 2021). The Plain of Reeds has a relatively high mean annual temperature of around 27 °C with minimal fluctuation, high humidity (nearly 80%), and annual mean precipitation of about 1500 mm (Dinh & Dang, 2021; Nguyen et al., 2022). Irrigation water for rice cultivation primarily originates from the Mekong River system and local precipitation (Nguyen et al., 2022). Due to its flat and low-lying topography, the region exhibits high vulnerability to climate change impacts, particularly with respect to changes in rain-fed water availability (Dang, 2020; Nguyen et al., 2022).
Precipitation patterns vary across the region. The northeastern part (Long An province) has the highest annual rainfall (1650.8 mm); the southwestern area (Dong Thap province) has the lowest (1367.4 mm); and the southeastern area (Tien Giang province) has an average of 1450 mm (Lee & Dang, 2020; Nguyen et al., 2022). These variations were accounted for by dividing the area into three sub-areas based on topography and IWP characteristics (Figure 1).
Baseline climate data (2001-2022), including sunshine duration, relative humidity, wind speed, temperature, and rainfall, were obtained from Hydrometeorological Forecasting Stations in Dong Thap, Long An, and Tien Giang provinces, representing the three sub-areas (Table 1).
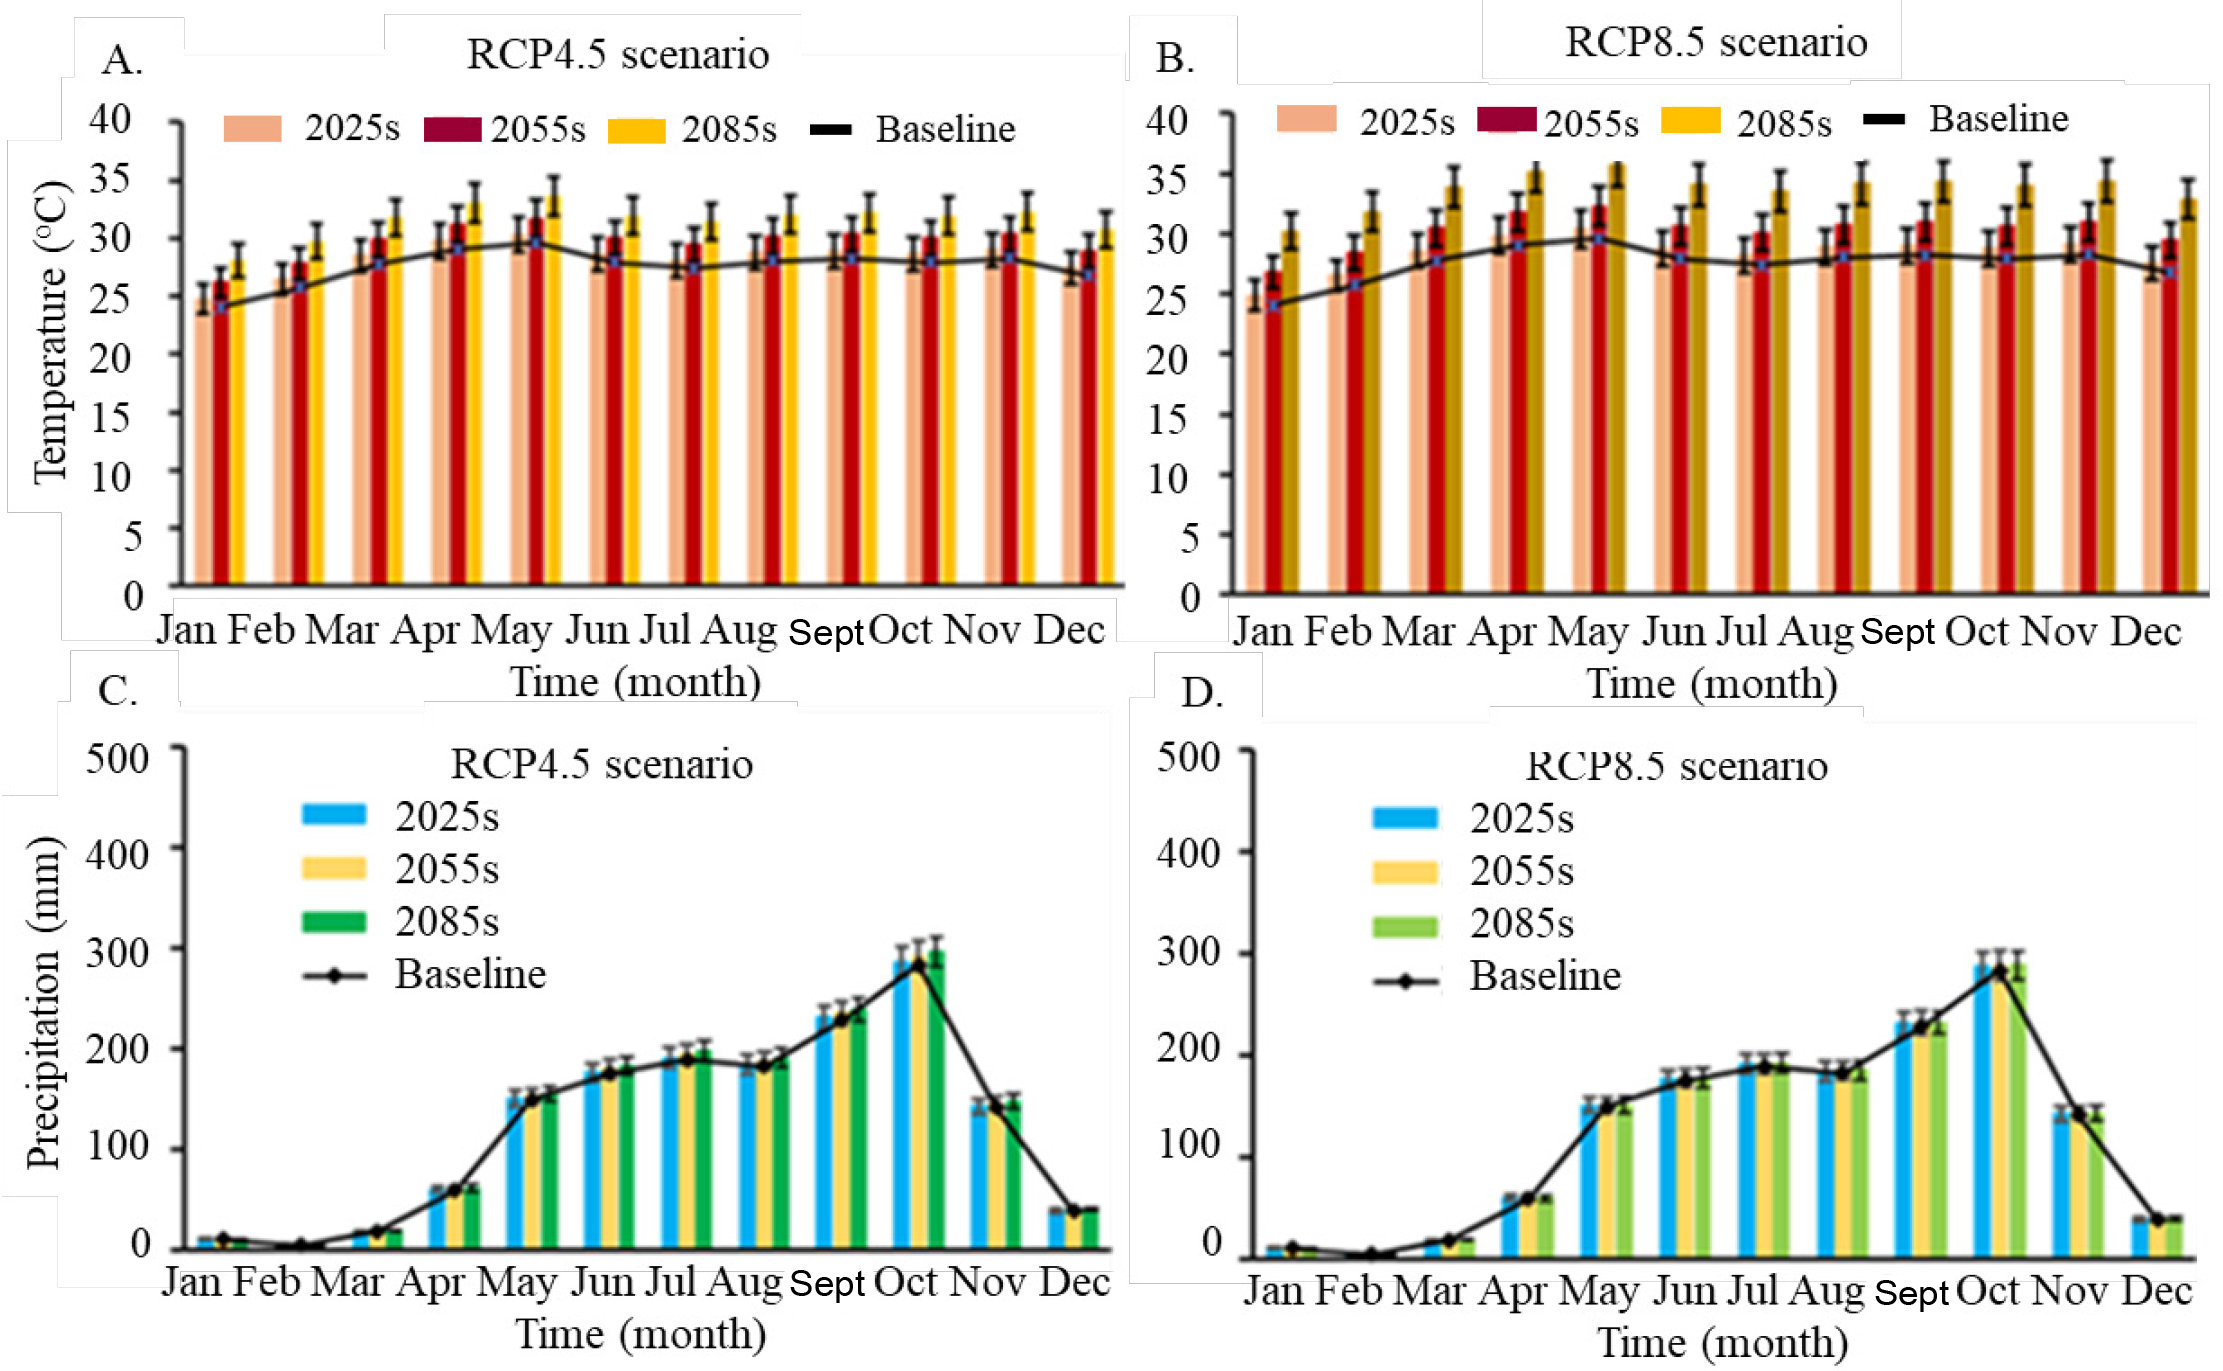
Baseline (2001-2022) climate and projected future changes in mean temperature and precipitation across the Plain of Reeds under RCP4.5 and RCP8.5 scenarios. Standard errors indicate the uncertainty range from using multiple GCMs
Future climate data for Representative Concentration Pathways (RCPs) RCP4.5 (baseline emissions scenario) and RCP8.5 (high-emissions scenario) were derived from downscaled climate projections of five Global Circulation Models (GCMs). These GCMs (Table 2) were selected for their ability to provide data for simulating both IWP and IWD, as well as their previous use in Vietnamese agricultural research (Mainuddin et al., 2013; Lee & Dang, 2019; Phung & Dang, 2023). The future periods analyzed were 2011-2040 (centered on 2025), 2041-2070 (centered on 2055), and 2071-2099 (centered on 2085). Projected changes in temperature and precipitation for these periods are summarized in Table 1 and visualized in Figure 2. The GCMs used were based on global-scale climate variables under different emission scenarios, as reported by the Ministry of Natural Resources and Environment (MNRE) (Table 2).
Global Circulation Models (GCMs) used in this study, as identified in a report by the Ministry of Natural Resources and Environment (MNRE), Vietnam
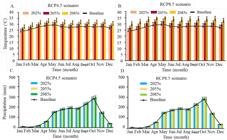
Baseline and future timescales (2025s, 2055s, and 2085s) of monthly mean temperature (°C) under RCP4.5 scenario (A) and RCP8.5 scenario (B); and precipitation (mm) under RCP4.5 scenario (C) and RCP8.5 scenario (D) for the Plain of Reeds
Accordingly, the GCMs were designed based on global-scale climate variables, which were hypothesized for different emission scenarios. Although their representativeness, spatial resolution, and quality are facing different opinions. However, the study admitted five common GCMs to identify the impacts of GCC on local climate features (Table 2).
Soil samples were collected from representative locations within the three sub-areas (I, II, and III as seen in Figure 1). Physicochemical properties, including particle size distribution (sand, silt, clay), volumetric soil water content at saturation (SAT), field capacity (FC), permanent wilting point (PWP), total available water (TAW = FC-PWP), bulk density (BD), and soil pH, were determined through laboratory analysis. Soil textural classes were identified using USDA-United States Department of Agriculture software. These properties are presented in Table 3.
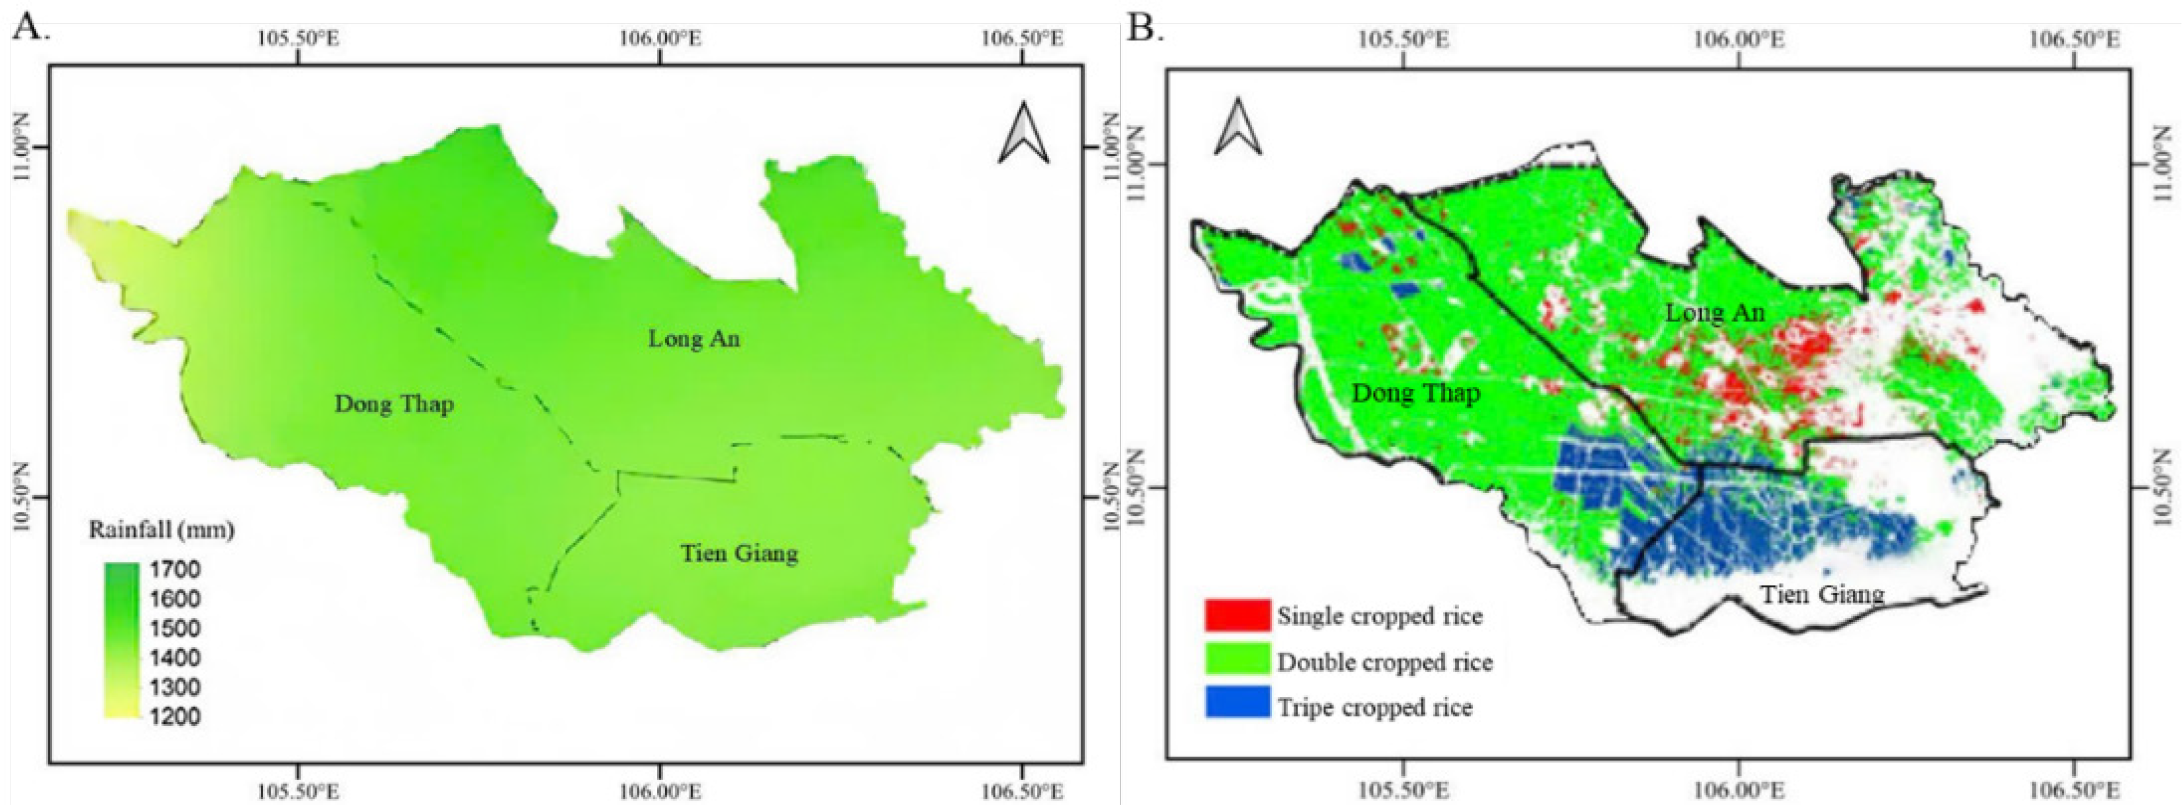
Crop cultivation data were collected from the Departments of Agriculture and Rural Development of Dong Thap, Tien Giang, and Long An provinces, including sowing, transplanting, flowering, maturity, and harvesting dates, rice yields, and management practices from 2014 to 2023. Commonly cultivated rice (Oryza sativa) varieties in the study area include OM18, OM4900, OM5451, ĐTM 17-1, ĐTM 1-122, ĐTM 13-8, and ĐTM 14-285 (Dang, 2021; Le & Chieko, 2022). The ĐT8 variety, known for its sturdy plants, minimal lodging, good tillering, resistance to diseases, and tolerance to drought and salinity, with a growth cycle of 85-90 days and an average yield of 7-8 t ha⁻1, was selected as the representative variety for simulations (Le & Chieko, 2022). Farmers in the Plain of Reeds typically engage in double or triple rice cropping per year (Figure 3A), including winter-spring (WS), summer-fall (SF), and fall-winter (FW) seasons (Dinh & Dang, 2021). Specific crop cultivation cycles (CCC) and mean annual rainfall (MAR) amounts vary by sub-area and season (Figure 3B). For example, for the WS season (starting around the 343rd Julian day), sub-area I has a MAR of 1656.7 mm and a crop growth cycle (CGC) of 95 days; sub-area II has a MAR of 1385.4 mm and a CGC of 90 days; and sub-area III has a MAR of 1537.8 mm and a CGC of 100 days.
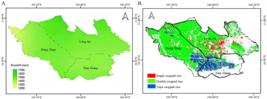
Spatial distribution of mean annual rainfall (mm) (A) and rice sowing seasonality (B) across the Plain of Reeds, Vietnam
The selection and performance of rice cultivars are predominantly governed by local agroecological conditions, including soil characteristics, topography, and the quality, availability, and management of irrigation water (Dang, 2021; Dinh & Dang, 2021). For the winter-spring crop season, the CCC was determined to start from the 343rd Julian day of the year. Sub-area I has a MAR of 1656.7 mm, with a crop growing cycle (CGC) of 95 days. Sub-area II has a MAR of 1385.4 mm (Figure 3A), with a CGC of 90 days. Lastly, sub-area III has a MAR of 1537.8 mm, with a CGC of 100 days (Figure 3B).
The FAO-AquaCrop model (Version 6.0) was used to simulate IWP and IWD. AquaCrop is a water-driven crop growth model that simulates achievable yields under various irrigation conditions (e.g., full, supplemental, deficit, rainfed) (Houma et al., 2021). It requires relatively few parameters and integrates climate, soil, crop, and management modules (Dang et al., 2021). Its ability to capture the impact of water availability on yield makes it suitable for real-world agricultural challenges (Amiri, 2016). The model has been successfully applied in Asia and Vietnam for similar assessments (Greaves & Wang, 2016; Kontgis et al., 2019; Dang et al., 2021; Phung & Dang, 2023). A flowchart of the simulation process is shown in Figure 4.
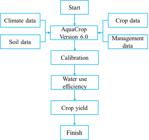
Flow chart of the FAO-AquaCrop model simulation process for estimating irrigation water potential and demand
Simulation scenarios involved varying sowing dates at three-day intervals for each sub-area. Atmospheric CO₂ concentrations were set at 449 ppm (2025s), 541 ppm (2055s), and 850 ppm (2085s) for the future periods, corresponding to RCP4.5 and RCP8.5 pathway assumptions. Given that rice cultivation areas in the Plain of Reeds are predominantly irrigated and fertilized without significant limitations, simulations were performed assuming unrestricted irrigation water (to determine IWD) and non-limiting soil fertility. IWP was defined as the amount of water available for irrigation derived from rainfall within the model’s water balance.
The AquaCrop model was calibrated using observed rice yield data from 2013-2023 and validated using data from 2002-2012 for the three representative sub-areas. Model performance was assessed using the coefficient of determination (R2) (Eq. 1), index of agreement (E) (Eq. 2), and root mean square error (RMSE) (Eq. 3):
The index of agreement (E) is designed as follows:
Where:
Si and Oi - represent the model outputs and observed data, respectively; and,
- is the average value of Oi, while n denotes the total number of data points.
The RMSE (Eq. 3) serves as a valuable metric for quantifying the absolute discrepancy between the simulated output and observed data. The RMSE can be defined as follows.
Where:
i - represents the specific variable; and,
n - corresponds to the count of available data points.
RESULTS AND DISCUSSION
The performance of the FAO-AquaCrop model in simulating rice yields was evaluated for both calibration and validation periods (Figure 5). For the validation period (2002-2012), R2 values ranged from 0.67 to 0.84, while the RMSE was between 8.7 and 14.6% of the mean observed yield. For the calibration period (2013-2023), RMSE ranged between 9.1 and 13.8%, index of agreement (E) between 0.11 and 0.25, and R2 between 0.71 and 0.86. The R2 values indicate that the model satisfactorily explained a significant portion (67-86%) of the observed yield variability, demonstrating a strong ability to capture yield trends across seasons.
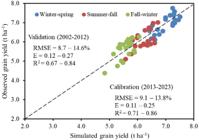
Performance of the FAO-AquaCrop model in simulating rice grain yield for winter-spring, summer-fall, and fall-winter crop seasons compared to observed data (2002-2023)
Furthermore, the RMSE values fall within an acceptable range for crop modeling, signifying a solid level of predictive accuracy. The E values, from 0.11 to 0.27, were relatively low. The E statistic evaluates the model’s performance relative to the observed mean, where a value of 1 indicates a perfect fit. While the high R2 values confirm the model’s capacity to replicate the linear relationship and trends in the data, the lower E values suggest the presence of systematic bias or that the magnitude of errors is notable compared to the observed variability. However, considering the strong performance indicated by both R2 and RMSE, the model is deemed satisfactory for assessing yield responses in this study. This combination of statistics suggests the model is robust in predicting yield variance, which is crucial for evaluating climate change impacts.
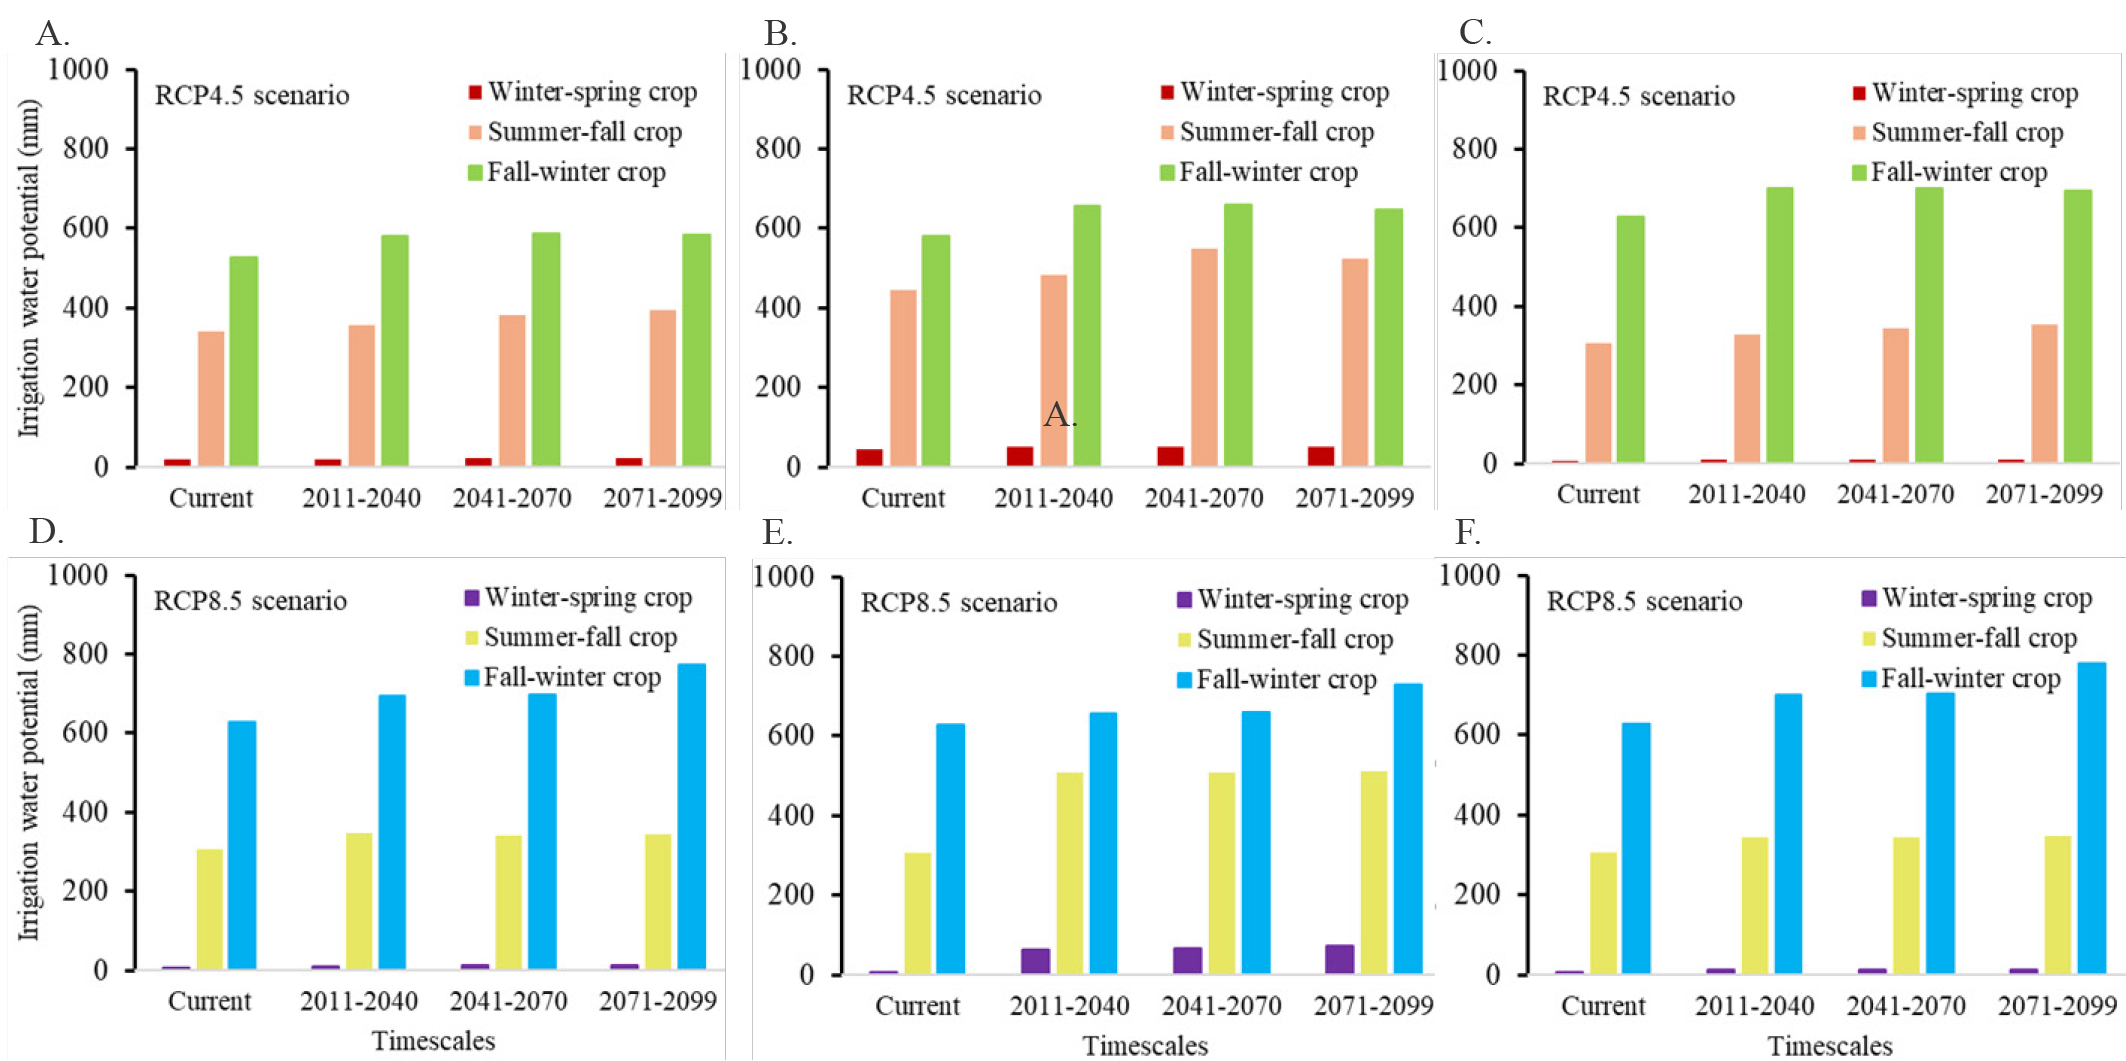
Simulated IWP from rain-fed sources showed considerable variation across crop seasons, sub-areas, and future climate scenarios (Table 4, Figure 6). A substantial increase in IWP was projected for the WS season across all sub-areas and scenarios compared to the baseline. Under RCP4.5, IWP increases ranged from 13.7% (Sub-area I, 2071-2099) to 17.3% (Sub-area I, 2041-2070). The RCP8.5 scenario projected even more significant increases, ranging from 62.8% (Sub-area III) to 65.7% (Sub-area I) by 2071-2099. For example, in Sub-area I, the baseline IWP was 18.6 mm; this increased to 21.4 mm (RCP4.5) and 30.3 mm (RCP8.5) by 2071-2099.
Simulated irrigation water potential (IWP, mm) from rainfall in the baseline period and for future periods under RCP4.5 and RCP8.5 scenarios across the Plain of Reeds, Vietnam
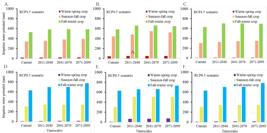
Simulated irrigation water potential (IWP, mm) in the baseline and future periods for different crop seasons: under the RCP4.5 scenario at the sub-areas I (A), II (B), and III (C); and under the RCP8.5 scenario at the sub-areas I (D), II (E), and III (F) across the Plain of Reeds, Vietnam
During the Summer-Fall (SF) cropping season, intermediate increases in IWP were observed. Under RCP4.5, Sub-area II had the largest increase (23.1% by 2041-2070), while Sub-area I had a 13.5% increase by 2011-2040. Increases under the RCP8.5 scenario were lower than those under RCP4.5 in some periods of SF; for instance, in Sub-area I, IWP increased by 13.5% (2011-2040, RCP8.5) versus 15.7% (2071-2099, RCP4.5). The Fall-Winter (FW) season had consistent increases in IWP across all sub-areas and scenarios. Under the RCP4.5 scenario, increases ranged from 10.6% (Sub-area I, 2071-2099) to 13.9% (Sub-area II, 2011-2040). RCP8.5 projected larger increases by 2071-2099, from 23.3% (Sub-area II) to 25.6% (Sub-area III). The RCP8.5 scenario consistently resulted in higher IWP than RCP4.5, particularly in the long term (2071-2099).
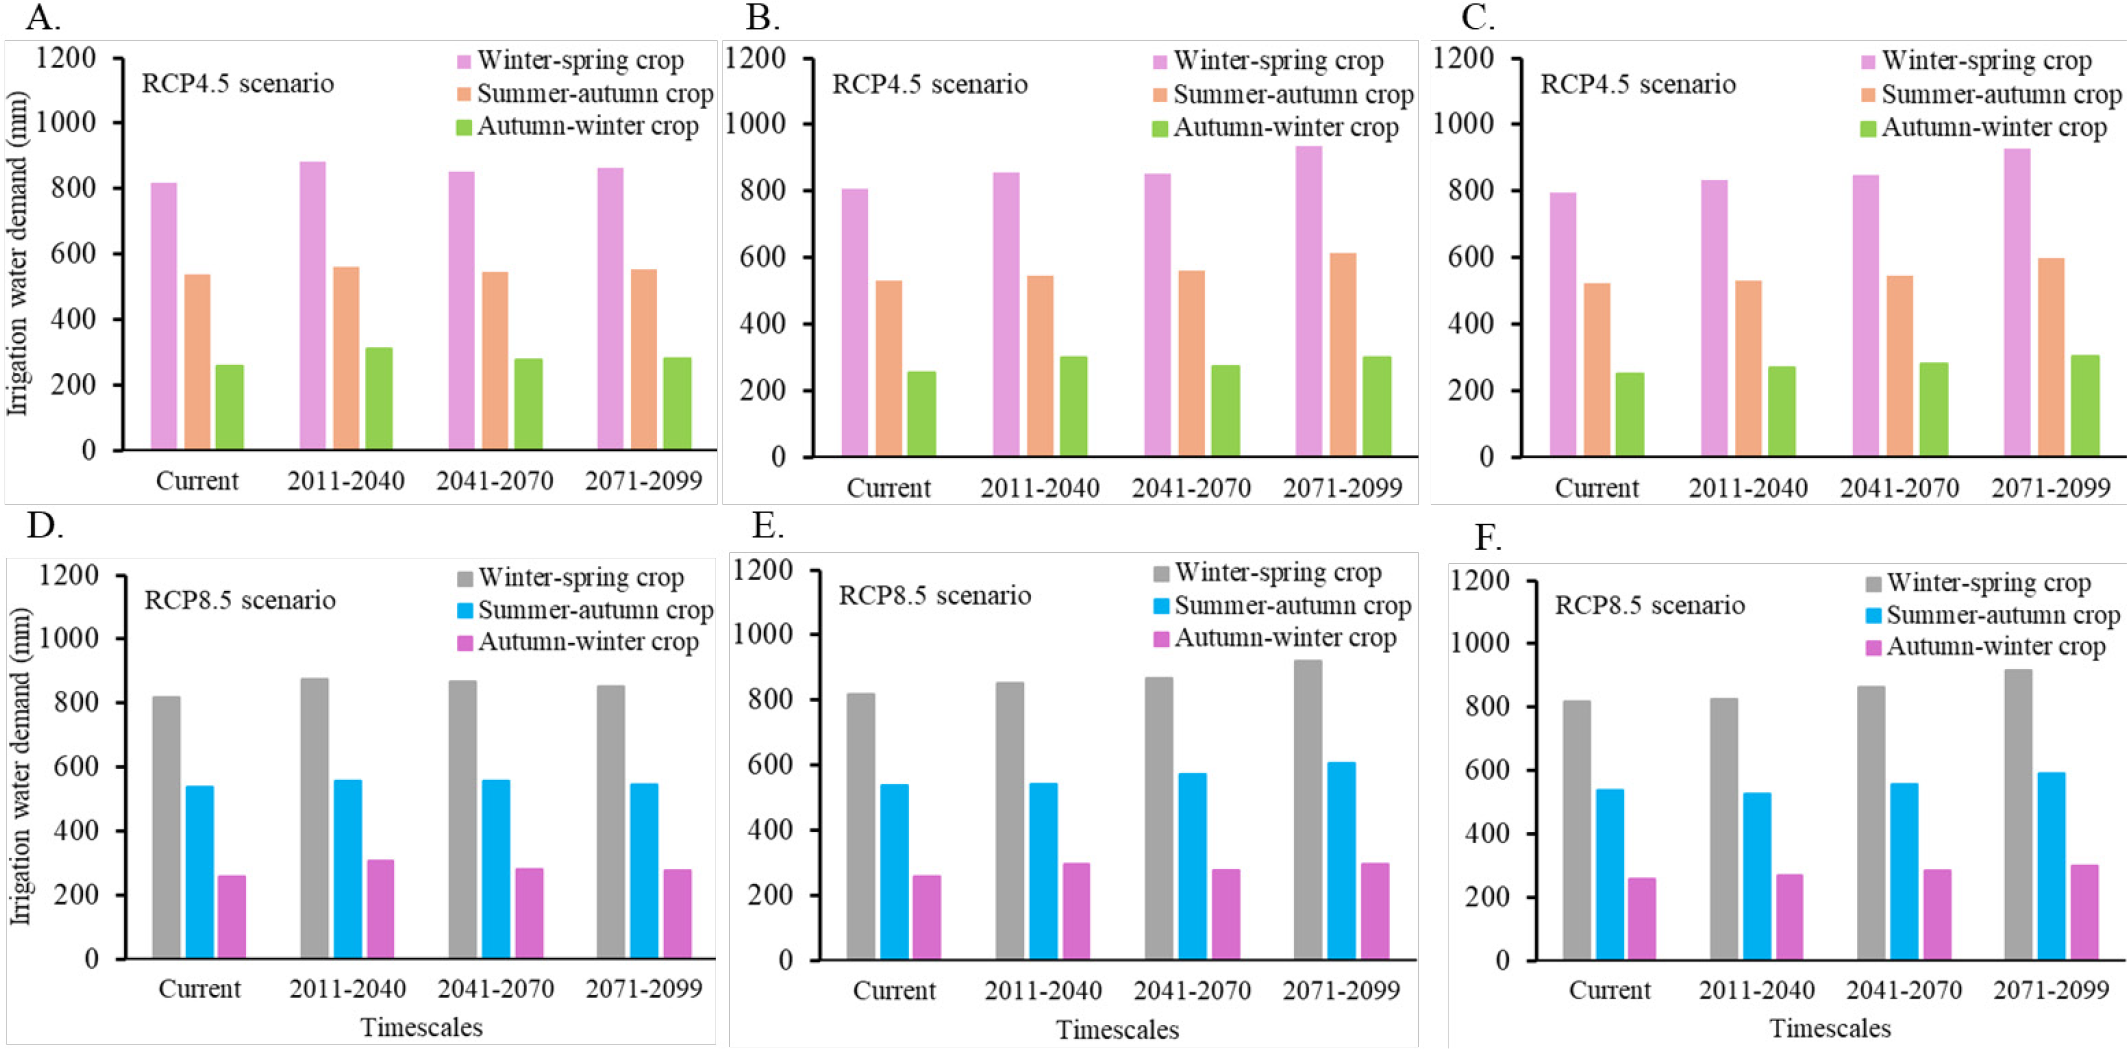
Simulated IWD also showed significant variations across seasons, sub-areas, and climate scenarios (Figure 7). An increasing trend in IWD was observed for the WS season compared to baseline levels for all sub-areas. Under RCP4.5, Sub-area I showed the highest initial increase (7.9% for 2011-2040), while Sub-area III had the most substantial long-term rise (16.8% for 2071-2099). The RCP8.5 scenario showed similar increasing patterns but with slightly lower increases in some cases compared to RCP4.5 for the same period. In Sub-area I, IWD increased to 880.7 mm (RCP4.5, 2011-2040) and 874.5 mm (RCP8.5, 2011-2040) from a baseline of 816.2 mm.
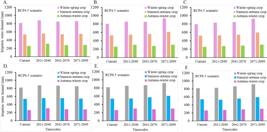
Simulated irrigation water demand (IWD, mm) in the baseline and future periods for different crop seasons under (A-C) RCP4.5 scenario and (D-F) RCP8.5 scenario, for Sub-area I (A, D), Sub-area II (B, E), and Sub-area III (C, F) across the Plain of Reeds, Vietnam
IWD for the SF season displayed moderate increases. Sub-area II showed the highest long-term growth under both scenarios (15.8% for RCP4.5 and 14.2% for RCP8.5 by 2071-2099). Sub-area I had the smallest long-term increase (3.2% for RCP4.5 and 1.8% for RCP8.5 by 2071-2099). The FW season demonstrated the most dramatic IWD changes. Sub-area I showed a substantial initial increase (20.1% for 2011-2040 under RCP4.5), which moderated in later periods. Sub-area III, however, exhibited a steady rise, reaching 20.9% (RCP4.5) and 19.2% (RCP8.5) increases by 2071-2099.
Notably, the RCP8.5 scenario does not always result in higher water demand than the RCP4.5 scenario, particularly in 2011-2040. This suggests complex interactions between climate variables affecting irrigation demands. Overall, these results indicate a trend of increasing irrigation water demand across all seasons and sub-areas, with significant variations in magnitude. This underscores the need for adaptive water management strategies in the Plain of Reeds to address future climate change impacts.
After calibration and validation, the FAO-AquaCrop model proved to be a reliable tool for assessing IWP and IWD for rice cultivation in the Plain of Reeds, consistent with its application in other studies (Shrestha et al., 2013; Dang, 2021). Despite the observed values for R2, E, and RMSE indicating a need for refinement in E interpretation, they generally support the model’s capability to simulate crop responses to environmental conditions.
The projected general increase in IWP, particularly for the WS season under RCP8.5 (up to 65.7% by 2085, Table 4), suggests enhanced water availability from rainfall during this period. This increase can be attributed to projected rises in overall precipitation (Table 1), although changes in rainfall intensity and distribution patterns, not just total amount, also play a crucial role (Ansari et al., 2021). The more severe RCP8.5 scenario often led to higher IWP, especially in the long term, aligning with expectations of greater climatic shifts under higher emission pathways. However, the SF season showed more moderate or even slightly lower IWP increases under RCP8.5 compared to RCP4.5 in some instances, indicating that seasonal rainfall distribution changes might sometimes be less favorable under higher emission scenarios for this specific crop timing. The FW season consistently showed IWP increases, benefiting from end-of-rainy-season precipitation, which is projected to increase.
Despite the potential increase in IWP from rainfall, the rice IWD is also projected to generally increase across all seasons and sub-areas (Figure 7). This is primarily driven by rising temperatures (Table 1), which increase crop evapotranspiration (ETc) (Zeleke et al., 2011). Despite the WS crop season benefiting from increased IWP, it also shows substantial IWD increases (e.g., up to 16.8% in Sub-area III by 2085, under RCP4.5), highlighting that rising temperatures can offset some gains from increased rainfall. The most dramatic IWD increases for the FW crop season in the initial future period (e.g., 20.1% in Sub-area I under RCP4.5 for 2011-2040) suggest a growing dependence on irrigation during the drier parts of this season.
The finding that the RCP8.5 scenario does not always result in higher IWD than RCP4.5, particularly in the earlier future period (2011-2040), is noteworthy. This suggests complex interactions between various climatic factors. For instance, while RCP8.5 generally projects higher temperatures (leading to higher ETc), associated changes in rainfall patterns (timing, intensity), solar radiation (due to cloud cover changes), and humidity, as well as potential CO₂ fertilization effects on stomatal conductance (which AquaCrop can simulate), might interact non-linearly to influence net IWD (Deryng et al., 2014; Boonwichai et al., 2019). The CO₂ concentrations used (449, 541, 850 ppm) would influence transpiration, and this effect might differ in magnitude relative to temperature-driven ETc increases between RCP4.5 and RCP8.5.
The dual trend of increasing IWP from rainfall in some seasons and generally increasing IWD poses complex challenges and opportunities for water management in the Plain of Reeds. The enhanced IWP during the WS season could potentially reduce reliance on external irrigation sources if managed effectively. However, the concurrent rise in IWD, especially for WS and FW crops, underscores the growing pressure on water resources.
These findings strongly support the conclusion that adjusting crop sowing schedules is a viable adaptation strategy (Dang, 2021). By shifting sowing dates, farmers might better align critical crop growth stages with periods of higher rainfall and potentially avoid peak temperature periods that drive up IWD. For instance, if the WS season shows significant IWP increases, slight adjustments in planting could maximize rain-fed water utilization.
Other adaptive measures, such as investing in water-saving irrigation technologies (e.g., alternate wetting and drying), developing and promoting rice varieties more tolerant to heat and drought beyond ĐT8, and improving on-farm water management practices, will be crucial (Aggarwal & Singh, 2010; Lee & Dang, 2019).
This study, while comprehensive, has limitations. GCM projections inherently carry uncertainties. The AquaCrop model, though robust, relies on parameters that may have local specificities not fully captured. The study assumed non-limiting soil fertility and did not incorporate socio-economic factors that influence farmers’ adaptation decisions. Future research could explore the combined impacts of climate change and upstream dam development on water availability, integrate socio-economic analyses to assess the feasibility of adaptation options, and utilize a broader ensemble of GCMs and RCMs for more refined regional projections. Further investigation into the specific physiological responses of different rice varieties to combined temperature and CO₂ changes would also be beneficial.
CONCLUSIONS
-
1. Future climate change is projected to significantly increase irrigation water potential from rainfall for rice cultivation in the Vietnamese Mekong Delta, particularly during the winter-spring crop season, with up to a 65.7% increase under the RCP8.5 scenario by 2071-2099.
-
2. Irrigation water demand for rice is also projected to increase across most seasons and sub-areas, primarily driven by rising temperatures. The winter-spring and fall-winter crop seasons show notable increases, with the fall-winter crop facing up to a 20.9% rise in demand by 2071-2099 under RCP4.5 in certain areas.
-
3. The RCP8.5 scenario does not invariably lead to higher irrigation water demand than RCP4.5, especially in shorter timeframes, indicating complex interactions between temperature, precipitation, and CO₂ effects on crop water use.
-
4. Adjusting crop sowing schedules, alongside other on-farm water management improvements, presents a viable adaptation strategy to mitigate the challenges of increased water demand and capitalize on periods of enhanced rain-fed water potential in the face of climate change.
-
1
Research developed at Faculty of Social Sciences Education, Cao Lanh City 81000, Vietnam.
-
Declaration of funding:
This research is supported by the project B2024-SPD-10. In addition, the authors would like to extend sincere gratitude to the Departments of Agriculture and Rural Development of Dong Thap and Tay Ninh provinces for providing valuable data from the region, which facilitated the completion of this research.
-
• Ref 297546
Acknowledgements:
The authors would like to sincerely thank the reviewers as well as the editorial board for reviewing and providing feedback to help improve the manuscript.
Data Availability Statement:
Data is available from the corresponding author upon reasonable request.
LITERATURE CITED
-
Aggarwal, P. K.; Singh, A. K. Implications of global climatic change on water and food security. Water Resources Development and Management, v.1, p.49-63, 2010. https://doi.org/10.1007/978-3-642-04615-5_3
» https://doi.org/10.1007/978-3-642-04615-5_3 -
Alejo, L. A. Assessing the impacts of climate change on aerobic rice production using the DSSAT-CERES-Rice model. Journal of Water and Climate Change, v.12, p.696-708, 2021. https://doi.org/10.2166/wcc.2020.286
» https://doi.org/10.2166/wcc.2020.286 -
Amiri, E. Calibration and testing of the Aquacrop model for rice under water and nitrogen management. Communications in Soil Science and Plant Analysis, v.47, p.387-403, 2016. https://doi.org/10.1080/00103624.2015.1123719
» https://doi.org/10.1080/00103624.2015.1123719 -
Ansari, A. et al. Evaluating and adapting climate change impacts on rice production in Indonesia: A case study of the Keduang Subwatershed, Central Java. Environments, v.8, 117, 2021. https://doi.org/10.3390/environments8110117
» https://doi.org/10.3390/environments8110117 -
Boonwichai, S. et al. Evaluation of climate change impacts and adaptation strategies on rainfed rice production in Songkhram River Basin, Thailand. Science of the Total Environment, v.652, p.189-201, 2019. https://doi.org/10.1016/j.scitotenv.2018.10.201
» https://doi.org/10.1016/j.scitotenv.2018.10.201 -
Dang, T. A. Grain yield optimization in the Plain of Reeds in the context of climate variability. Revista Brasileira de Engenharia Agrícola e Ambiental, v.25, p.591-596, 2021. https://doi.org/10.1590/1807-1929/agriambi.v25n9p591-596
» https://doi.org/10.1590/1807-1929/agriambi.v25n9p591-596 -
Dang, T. A. et al. Utilizing rainfed supply and irrigation as a climate variability adaptation solution for coastal lowland areas in Vietnam. Agriculture and Natural Resources, v.55, p.485-495, 2021. https://li01.tci-thaijo.org/index.php/anres/article/view/251805
» https://li01.tci-thaijo.org/index.php/anres/article/view/251805 -
Deb, P. et al. Assessment of the impacts of climate change and brackish irrigation water on rice productivity and evaluation of adaptation measures in Ca Mau province, Vietnam. Theoretical and Applied Climatology, v.125, p.641-656, 2016. https://doi.org/10.1007/s00704-015-1525-8
» https://doi.org/10.1007/s00704-015-1525-8 -
Deryng, D. et al. Global crop yield response to extreme heat stress under multiple climate change futures. Environmental Research Letters, v.9, p.1-13, 2014. https://iopscience.iop.org/article/10.1088/1748-9326/9/3/034011/meta
» https://iopscience.iop.org/article/10.1088/1748-9326/9/3/034011/meta -
Dinh, T. K. H.; Dang, T. A. Potential risks of climate variability on rice cultivation regions in the Mekong Delta, Vietnam. Brazilian Journal of Agricultural and Environmental Engineering, v.26, p.348-355, 2022. http://dx.doi.org/10.1590/1807-1929/agriambi.v26n5p348-355
» http://dx.doi.org/10.1590/1807-1929/agriambi.v26n5p348-355 -
Fita, L. et al. CORDEX-WRF v1.3: Development of a module for the Weather Research and Forecasting (WRF) model to support the CORDEX community. Geoscientific Model Development, v.12, p.1029-1066, 2019. https://doi.org/10.5194/gmd-12-1029-2019
» https://doi.org/10.5194/gmd-12-1029-2019 -
Gentilucci, M.; D’Aprile, F. Variations in trends of temperature and its influence on tree growth in the Tuscan Apennines. Arabian Journal of Geosciences, v.14, p.1-20, 2021. https://doi.org/10.1007/s12517-021-07546-w
» https://doi.org/10.1007/s12517-021-07546-w -
Greaves, G. E.; Wang, Y. M. Assessment of FAO AquaCrop model for simulating maize growth and productivity under deficit irrigation in a tropical environment. Water, v.8, p.2-18, 2016. https://doi.org/10.3390/w8120557
» https://doi.org/10.3390/w8120557 -
Gupta, R.; Mishra, A. Climate change induced impact and uncertainty of rice yield of agro-ecological zones of India. Agricultural Systems, v.173, p.1-11, 2019. https://doi.org/10.1016/j.agsy.2019.01.009
» https://doi.org/10.1016/j.agsy.2019.01.009 -
Houma, A. A. et al. Predicting climate change impact on water productivity of irrigated rice in Malaysia using FAO-AquaCrop model. Application. Science, v.11, 11253, 2021. https://doi.org/10.3390/app112311253
» https://doi.org/10.3390/app112311253 -
Kontgis, C. et al. Climate change impacts on rice productivity in the Mekong River Delta. Applied Geography, v.102, p.71-83, 2019. https://doi.org/10.1016/j.apgeog.2018.12.004
» https://doi.org/10.1016/j.apgeog.2018.12.004 -
Kroes, J. et al. Agrohydrological analysis of groundwater recharge and land use changes in the Pampas of Argentina. Agricultural Water Management, v.213, p.843-857, 2019. https://doi.org/10.1016/j.agwat.2018.12.008
» https://doi.org/10.1016/j.agwat.2018.12.008 -
Le, C. B. T.; Chieko, U. Rice variety and sustainable farming: A case study in the Mekong Delta, Vietnam. Environmental Challenges, v.8, 100532, 2022. https://doi.org/10.1016/j.envc.2022.100532
» https://doi.org/10.1016/j.envc.2022.100532 -
Lee, S. K.; Dang, T. A. Extreme rainfall trends over the Mekong Delta under the impacts of climate change. International Journal of Climate Change Strategies and Management, v.12, p.639-652, 2020. https://doi.org/10.1108/IJCCSM-04-2020-0032
» https://doi.org/10.1108/IJCCSM-04-2020-0032 -
Lee, S. K.; Dang, T. A. Predicting the water use-demand as a climate change adaptation strategy for rice planting crops in the Long Xuyen Quadrangle Delta. Paddy Water Environmental, v.17, p.561-570, 2019. https://doi.org/10.1007/s10333-018-00686-y
» https://doi.org/10.1007/s10333-018-00686-y -
Lincoln, M. A.; José, M. Assessment of regional seasonal predictability using the PRECIS regional climate modeling system over South America. Theoretical and Applied Climatology, v.100, p.337-350, 2010. https://doi.org/10.1007/s00704-009-0165-2
» https://doi.org/10.1007/s00704-009-0165-2 -
Mainuddin, M.et al. Impact of climate change on rainfed rice and options for adaptation in the lower Mekong Basin. Natural Hazards, v.66, p.905-938, 2013. https://doi.org/10.1007/s11069-012-0526-5
» https://doi.org/10.1007/s11069-012-0526-5 - Nellie, E. et al. Regional Climate Model RegCM Reference Manual Version 4.7. January 2017, 49p.
-
Nguyen, D. B. et al. Mapping rice seasonality in the Mekong Delta with multi-year Envisat ASAR WSM data. Remote Sensing, v.7, p.15868-15893, 2017. https://doi.org/10.3390/rs71215808
» https://doi.org/10.3390/rs71215808 -
Nguyen, T. T. T. et al. Climate variability induced drought across the coastal fringes of the Mekong Delta, Vietnam. Mausam, v.73, p.525-36, 2022. https://doi.org/10.54302/mausam.v73i3.5373
» https://doi.org/10.54302/mausam.v73i3.5373 -
Nosaka, M. et al. Scalability of future climate changes across Japan examined with large-ensemble simulations at +1.5K, +2K, and +4K global warming levels. Progress in Earth and Planetary Science, v.7, 27, 2020. https://doi.org/10.1186/s40645-020-00341-3
» https://doi.org/10.1186/s40645-020-00341-3 -
Pazhanivelan, S. et al. Spatial rice yield estimation using multiple linear regression analysis, semi-physical approach and assimilating SAR satellite-derived products with DSSAT crop simulation model. Agronomy, v.12, 2008, 2022. https://doi.org/10.3390/agronomy12092008
» https://doi.org/10.3390/agronomy12092008 -
Phung, T. D.; Dang, T. A. Adapting to climate variability for rice cultivation paddies in the lowland coastal regions of Kien Giang Province, Vietnam. Die Bodenkultur: Journal of Land Management, Food and Environment, v.74, p.27-34, 2023. https://doi.org/10.2478/boku-2023-0003
» https://doi.org/10.2478/boku-2023-0003 -
Rice, H. E. et al. Congenital cystic adenomatoid malformation: a sheep model of fetal hydrops. Journal of Pediatric Surgery, v.29, p.692-696, 1994. https://doi.org/10.1016/0022-3468(94)90743-9
» https://doi.org/10.1016/0022-3468(94)90743-9 -
Shrestha, S. et al. Assessment of climate change impacts on irrigation water requirement and rice yield for Ngamoeyeik irrigation project in Myanmar. Journal of Water and Climate Change, v.5, p.427-442, 2014. https://doi.org/10.2166/wcc.2014.114
» https://doi.org/10.2166/wcc.2014.114 -
Zeleke, K. T. et al. Calibration and testing of the FAO AquaCrop model for canola. Agronomy Journal, v.103, p.1610-1618, 2011. https://doi.org/10.2134/agronj2011.0150
» https://doi.org/10.2134/agronj2011.0150
Edited by
-
Editors:
Toshik Iarley da Silva & Hans Raj Gheyi

 Error bars represent standard errors from the ensemble of Global Circulation Models (GCMs); RCP - Representative Concentration Pathways
 (Source: Adapted from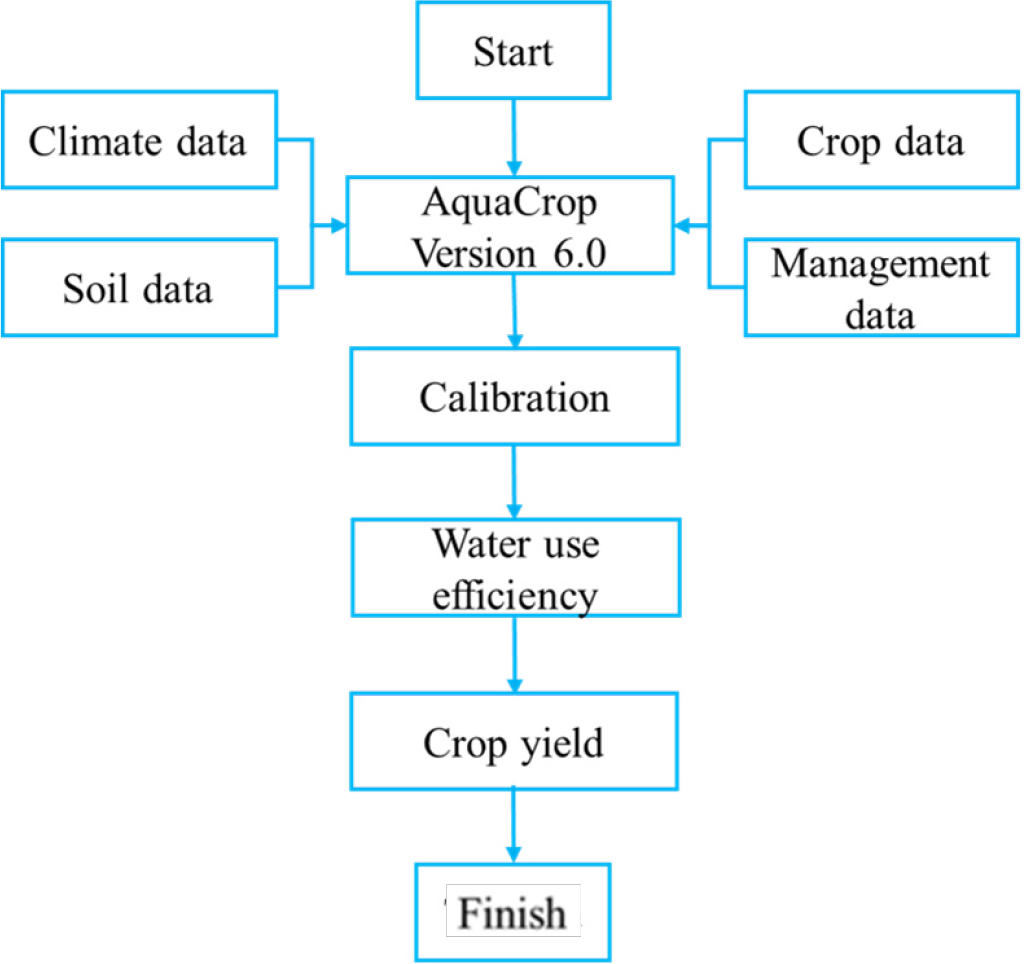
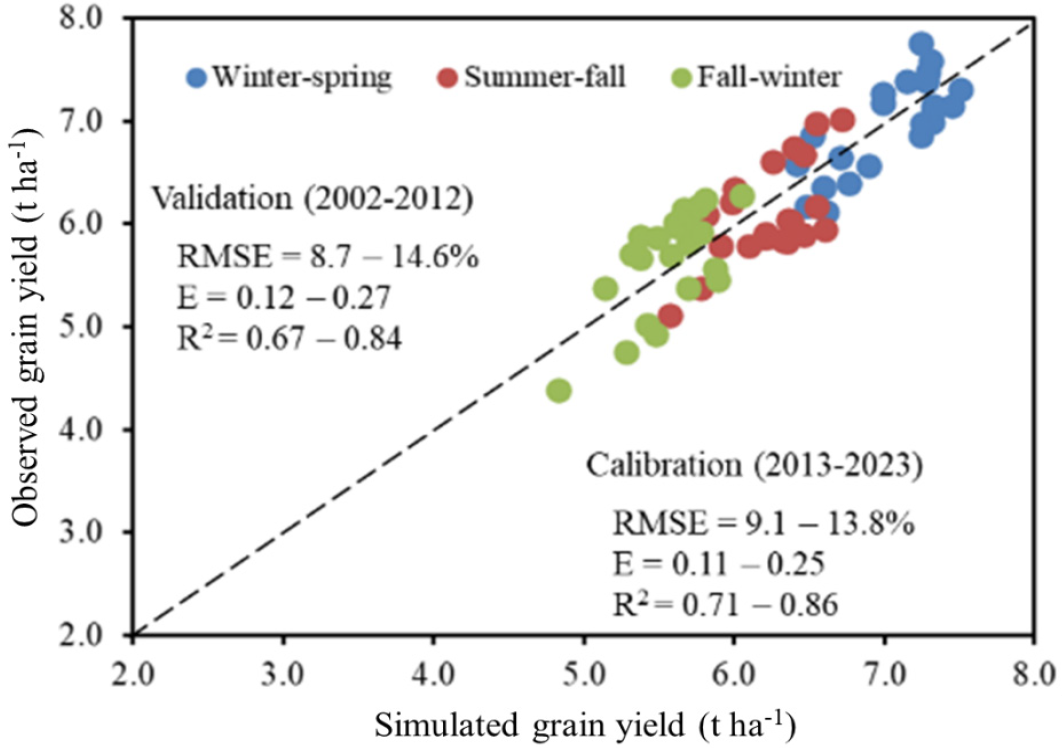 The dashed line is the 1:1 line. Inset text shows root mean square error (RMSE) (% of mean observed yield), Index of Agreement (E), and R2 for calibration (2013-2023) and validation (2002-2012) periods