 Carbon storage response to land use changes under multi-scenario simulations in the Jinan Metropolitan area, in China
ABSTRACT
To optimize land use and achieve carbon peaking and carbon neutrality targets, in this study, we investigated the spatial and temporal patterns of land use and land cover change (LUCC) and carbon storage (CS) in the Jinan Metropolitan Area from 2010 to 2030. Using land use data from 2010 to 2020, the PLUS model was employed to simulate land use patterns for 2030 under four development scenarios: Natural Development Scenario (NDS), Ecological Protection Scenario (EPS), Cropland Protection Scenario (CPS) and Urban Development Scenario (UDS). The InVEST model was then used to calculate CS under these scenarios. Between 2010 and 2020, the most significant reduction was in cropland, with a decrease of 3.34 %, while the most significant increase was in construction land, with an increase of 3.13 %. Total CS showed a decreasing trend. By 2030, CS is projected to increase exclusively under the EPS, with an increase of 873015.30 Mg, while other scenarios demonstrate varying degrees of decrease. Crucially, the expansion of construction land is identified as the dominant factor driving CS depletion in the Jinan Metropolitan Area. Mount Tai and the Yimeng Mountains are significant carbon sinks in this region. In contrast, the urban area of Jinan, as well as the Zhangqiu district and Zichuan district of Zibo, are the primary areas of CS loss. Strengthening the protection of ecological land in the Jinan Metropolitan Area, along with implementing carbon reduction and sequestration measures in construction land and cropland is crucial for enhancing regional CS capacity, optimizing future land management decisions, and ultimately achieving carbon peaking and carbon neutrality targets.
Keywords
dual carbon target; transfer matrix; PLUS model; InVEST model
INTRODUCTION
Terrestrial ecosystems, as one of the most vital global carbon sinks, not only offer essential habitats and resource bases for humans but also provide a range of ecological services such as water purification, soil conservation and carbon storage (CS) (Li and Ma, 2017). Land use and cover change (LUCC), a key driver of the carbon cycle in terrestrial ecosystems, directly or indirectly influences the CS capacity of ecosystem services by altering the composition and function of ecosystems. Related researches have shown that carbon emissions resulting from LUCC have emerged as the second-largest source of greenhouse gas emissions, following fossil fuel combustion (Cai et al., 2019, 2023). Furthermore, the efficient management of land resources is considered the most cost-effective approach for improving CS (Fu et al., 2024). Land use changes directly affect the CS capacity of vegetation, while indirectly influencing soil CS through modifications to soil properties and the redistribution of plant residues within the soil environment (Aneva et al., 2020). Therefore, timely and effective assessments of CS potential, based on land use dynamics, are essential. Such evaluations are crucial for advancing regional CS, informing climate change mitigation strategies, and achieving sustainable development goals.
Currently, researchers are actively engaged in investigating LUCC and CS across various scales, including provincial, municipal, and county levels, as well as urban agglomerations and watershed scales. The primary focus of these studies is to examine the impact of LUCC on CS and to simulate regional CS spatiotemporal change trends using coupled models. Several models, such as CLUE-S (Zhao et al., 2024a), FLUS (Hou et al., 2024), and CA-Markov (Li et al., 2024a), are utilized to predict land use patterns and demonstrate spatiotemporal dynamic changes. Markov transition matrix is currently the most widely used model for analyzing quantitative land-use change processes. It has been extensively applied in both domestic and international studies to reveal the patterns and dynamics of land-use transitions. PLUS model integrates the Markov approach for quantitative land-use demand prediction, ensuring the dynamic coupling between total amount control and spatial pattern optimization in LUCC simulations. Compared to these models, the PLUS model exhibits higher accuracy in simulating LUCC (Liang et al., 2021). Furthermore, InVEST model is employed to simulate and estimate CS. The InVEST model is advantageous due to its ability to overcome the complex data, high costs, and poor visibility associated with traditional models, making it more scientific in studying the impact of LUCC on CS.
Several researchers, including Zeng and Sun (2024), Duan et al. (2024), and Pang et al. (2024), had utilized the PLUS and InVEST models to explore the changes in land use and CS in the Yellow River Basin. These studies revealed CS distribution is directly related to regional land use type, and there is a significant negative correlation between regional CS and the intensity of land use. Additionally, Wang et al. (2025) and Tang et al. (2025) employed the PLUS-InVEST model to simulate the spatiotemporal change patterns of CS under different development scenarios in the future. Their results indicate that the rate of net CS loss is greatly influenced by land use pattern and resource allocation. Moreover, relative studies (Jia and Hu, 2024a; Shi et al., 2024; Jia et al., 2025) analyzed the factors influencing the spatial variation of CS, considering both natural environmental and socio-economic factors. These studies concluded that there are significant spatial variations in the driving forces of affecting CS across different regions and spatial scales.
Jinan Metropolitan Area (JMA) plays a pivotal role in China Yellow River Strategy, prioritizing ecological protection and high-quality development. As the most recently established metropolitan area in China, JMA is responsible for shaping a new development model and becoming a major economic growth hub in northern China. However, JMA encounters several challenges, including uneven development among its cities, unsustainable land use practices, and significant conflicts between economic growth and ecological preservation. In the context of China carbon peaking and carbon neutrality goals, advancing research on the impact of land use on CS, and optimizing land use patterns accordingly, is essential for the sustainable development of JMA. We conducted a comprehensive analysis of the LUCC and its spatiotemporal distribution in the JMA from 2010 to 2020. Furthermore, we projected land use patterns under multiple scenarios for 2030 and evaluated their potential impacts on CS. This study aimed to support the balancing of regional carbon sinks, the adjustment of spatial development strategies, the optimization of land use patterns, and the promotion of sustainable development of JMA.
MATERIALS AND METHODS
Study area
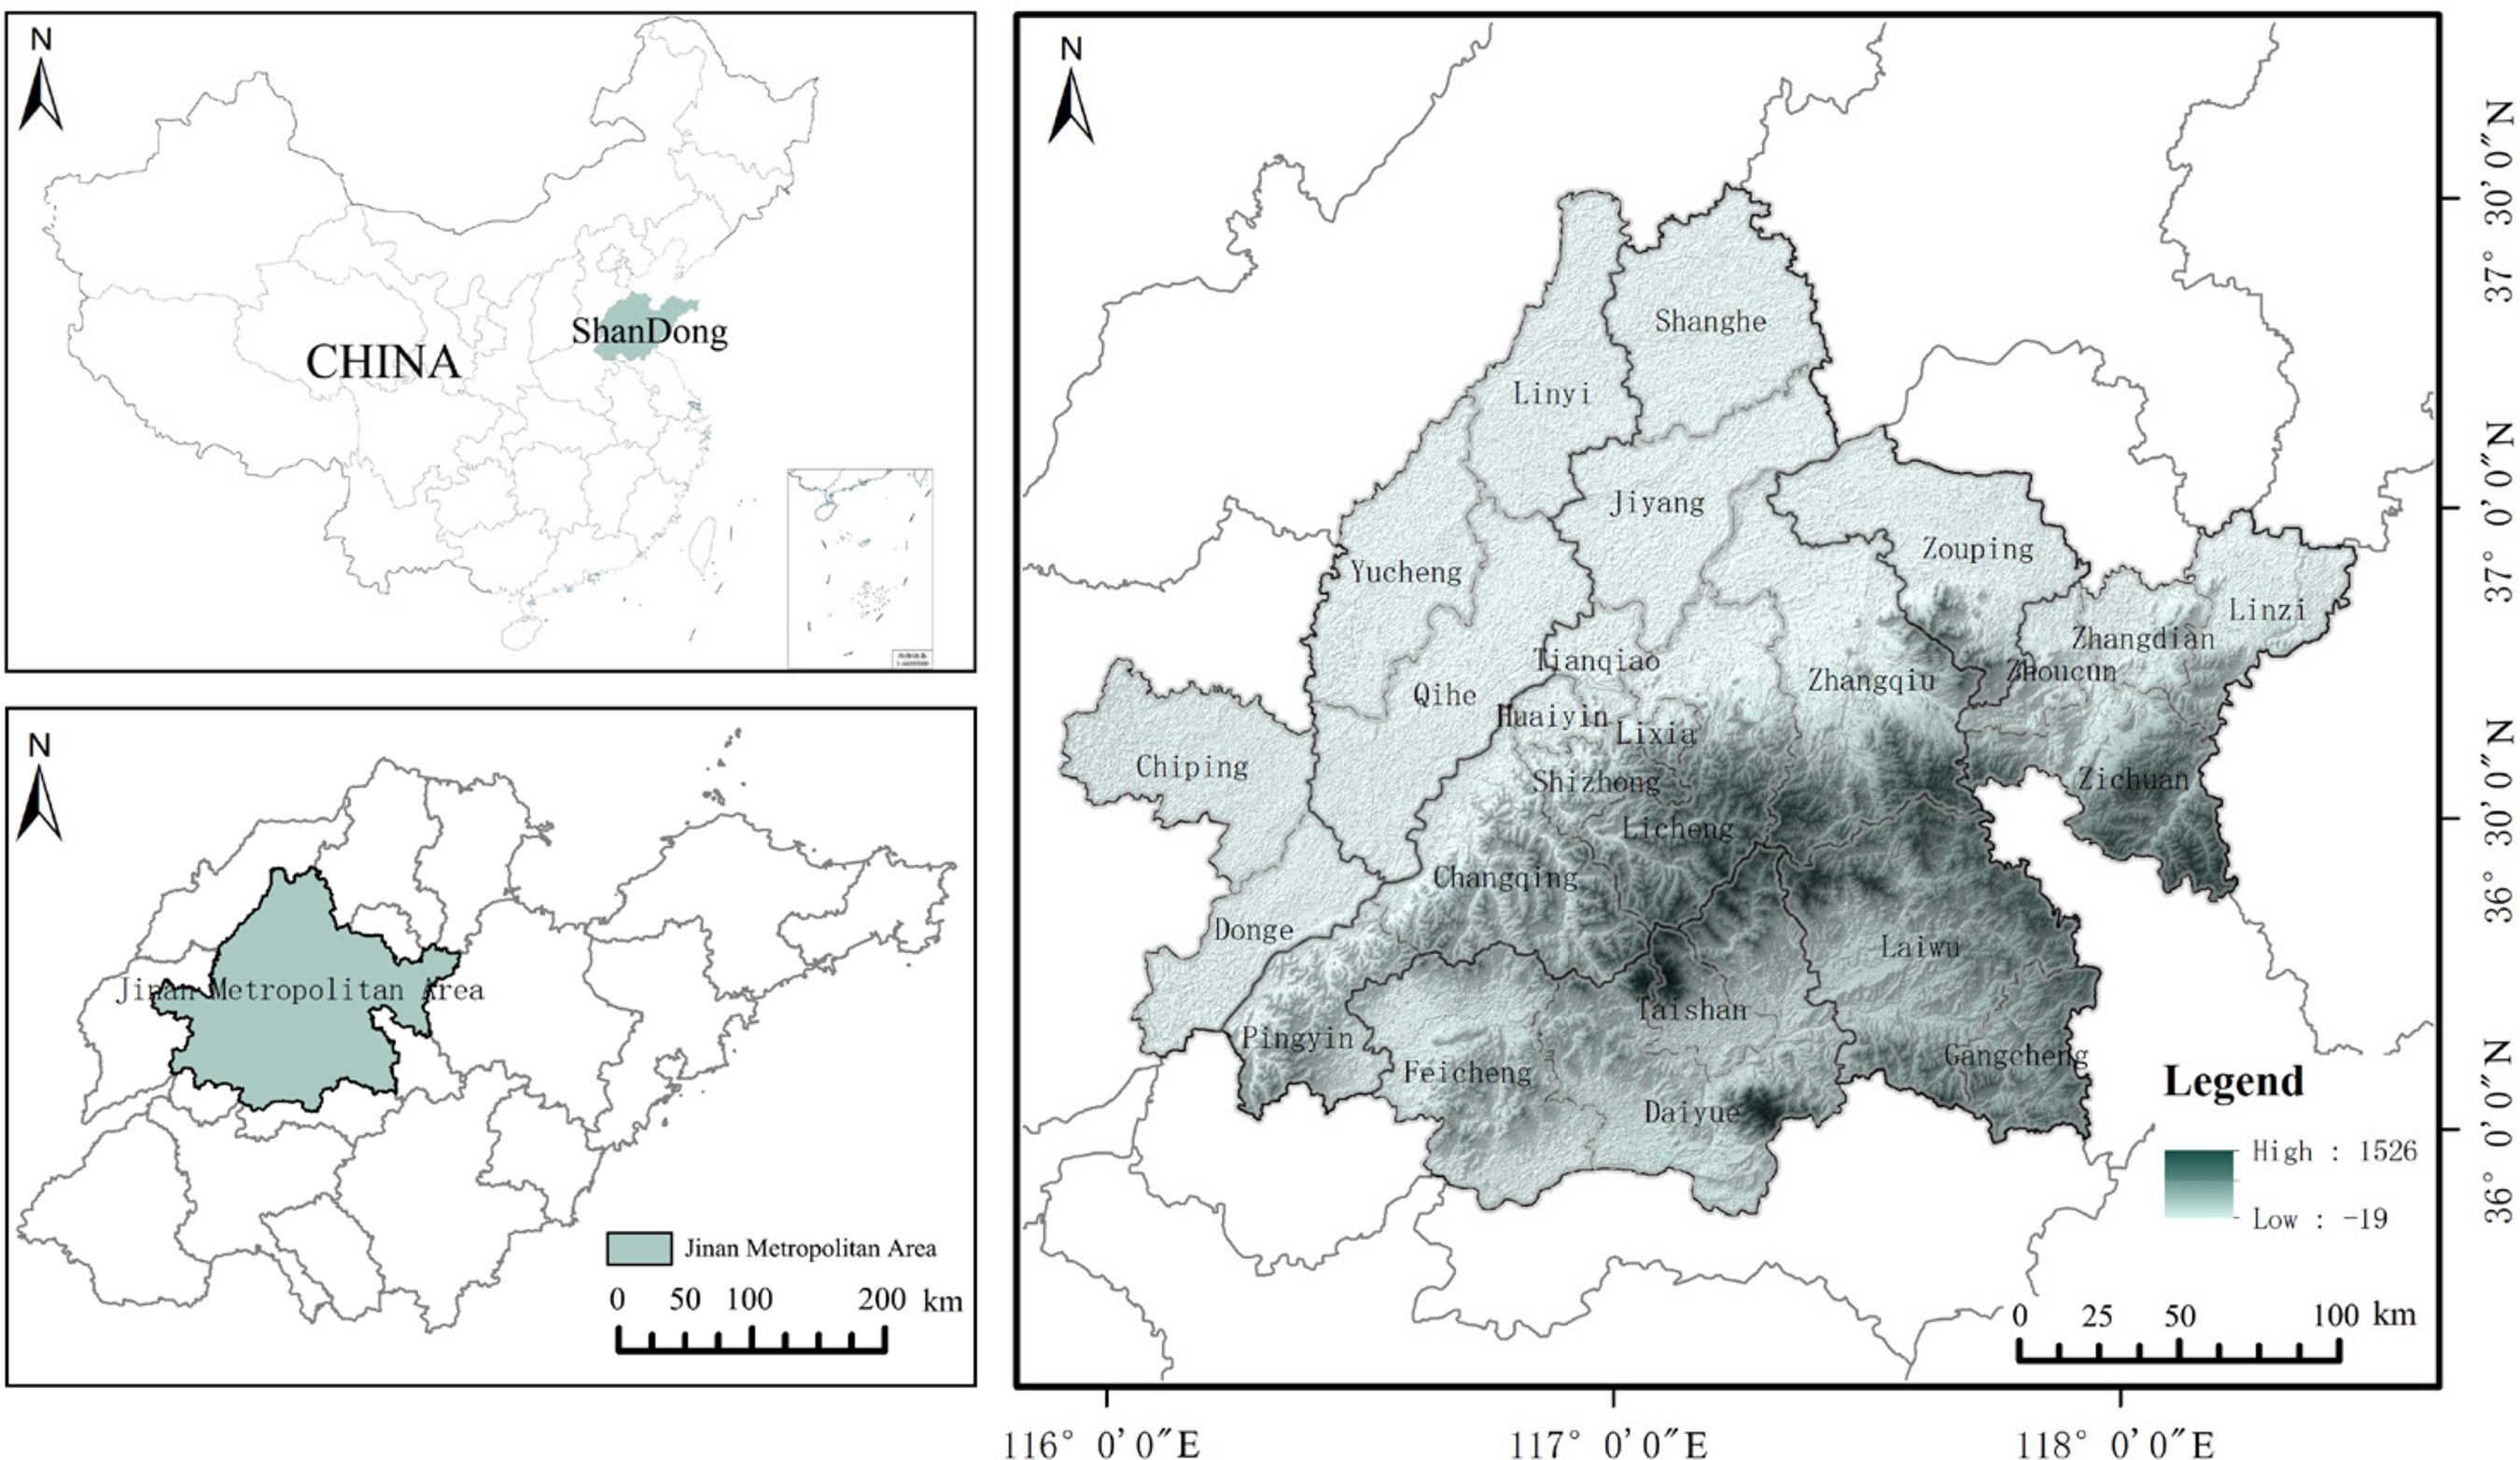
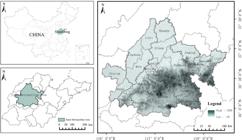
Jinan Metropolitan Area is located in the lower reaches of the Yellow River and in the central-western region of Shandong Province (35° 52' - 37° 20' N, 115° 54' - 118° 30' E; Figure 1). It plays a critical role in the ecological protection and high-quality development strategy of the Yellow River basin. Centered around Jinan City, JMA encompasses the entirety of Jinan, as well as districts and counties from Zibo, Tai’an, Dezhou, Liaocheng, and Binzhou. It encompasses 25 counties (districts) across six cities. Covering approximately 2.23 × 10⁴ km2 and a permanent population of 18.1 million. The terrain of JMA is predominantly mountains and plains, with elevations ranging from 100 to 1600 m. The region is characterized by a temperate monsoon climate, featuring an average annual precipitation of 671 mm.
Data sources
Land use data were selected for three periods: 2010, 2015, and 2020, including seven land categories such as cropland, forest, shrubland, grassland, water body, bare land, and construction land (Yang and Huang, 2021). Considering there is no bare land within JMA, the shrubland areas can be ignored. We have conducted a reclassification, which was divided into five land categories: cropland, forest, grassland, water body, and construction land. Generally, the driving factors of LUCC are divided into two categories: socio-economic and natural environmental factors (Gong et al., 2023). Taking into account the availability of land use data and the statistical data in JMA, 14 factors were selected as the driving factors for studying LUCC, including digital elevation model (DEM) (X1), slope (X2), distance to rivers (X3), soil type (X4), average annual precipitation (X5), average annual temperature (X6), distance to city center (X7), population density (X8), gross domestic product (GDP) (X9), railway distance (X10), distance to highway (X11), distance to primary road (X12), distance to secondary road (X13), and distance to branch road (X14). The data types and sources are presented in table 1, among which data for X3, X7 and traffic data were obtained by calculating Euclidean distances. The resolution of land use data and driving factor data was resampled to 30 × 30 m, and a unified projection coordinate system (WGS_1984_UTM_Zone_39N) was adopted.
Research methods
PLUS Model
The PLUS (Patch-generating Land Use Simulation Model) (Liang et al., 2021) is a cellular automaton (CA) based on raster data for simulating LUCC at the patch scale. This model integrates a rule-based method based on the Land Expansion Analysis Strategy (LEAS) and a CA model based on a multi-type random patch seed mechanism (CARS). It is capable of exploring the driving factors of land use expansion and landscape changes, and uses the Random Forest algorithm (RF) to obtain the development probabilities of various land use types, predicting future land use under multiple scenarios. We utilized the PLUS model, employed the LEAS method to extract LUCC data (Gong et al., 2023), and applied the RF algorithm (Min et al., 2024) to analyze the relationship between 14 driving factors and LUCC.
Multi-scenario settings
In accordance with "Shandong Province Territorial Spatial Planning (2021-2035)", "Yellow River Basin Ecological Protection and High-Quality Development Plan", "Jinan Metropolitan Area Development Plan (2024-2030)", and with reference to relevant literature (Ou Yang et al., 2020; Huang et al., 2023; Jia and Hu, 2024b), we considered the current developmental status of the JMA and its prospective socio-economic development plans. To simulate LUCC under four scenarios (Ma et al., 2023), namely the natural development scenario (NDS), ecological protection scenario (EPS), urban development scenario (UDS), and cropland protection scenario (CPS) (Table 2). We employed a methodology that integrated the land use transition matrix with neighborhood weight settings. This approach enabled us to conduct a comprehensive analysis of LUCC in the JMA.
NDS: This scenario assumes no change in land use transition probabilities, forecasts land use demand based on 2010-2020 trends. Employing a 10-year time step and utilizing the Markov Chain within the PLUS model, we predict the land use demand for 2030 under the NDS. This prediction is a foundational basis for simulating land use demand under the other scenarios considered in our analysis.
EPS: To promote carbon sequestration, this scenario involves reducing the expansion of construction land and enhancing transitions to forest, grassland, and water bodies. Specifically, we have decreased the probabilities of cropland, forest, grassland, and water bodies transitioning to construction land by 40 %, while increasing the probabilities of construction land transitioning to cropland, grassland, and forest by 40 %.
UDS: To promote urban development, we increased the expansion rate of construction land, resulting in a 30 % increase in the probability of various types of land being converted to construction land. Conversely, the probability of construction land being converted to other types of land was reduced by 20 %.
CPS: To uphold China agricultural land red line and enhance the protection of cropland, we adjusted the transition probabilities to favor its conservation. Specifically, we increased the conversion probabilities of various types of land to cropland by 20 %, while reducing the probability of cropland converting to other types by 30 %.
Weight calculation
Neighborhood weight parameter refers to the intensity of land use expansion, with values ranging between 0 and 1. A higher value indicates stronger land use expansion capability, while a lower value indicates weaker expansion capability (Ren et al., 2023). The complexity of the relationship between driving factors and changes in various types of land use makes it challenging to quantify the expansion intensity of each land type (Wang et al., 2019). We use the changes in the number and area of land use patches under different scenarios (Liu et al., 2021) as the basis for calculating neighborhood weights, thereby indicating the expansion intensity of each land use type (Table 3).
in which: TAi represents the change in area of the i-th land type; TAmin indicates the minimum conversion area among all land types; TAmax indicates the maximum conversion area among all land types; and Wi is the neighborhood weight parameter for a specific land type i.
Accuracy validation
In model accuracy evaluation, the PLUS model often uses the Kappa coefficient as a measurement standard. Kappa coefficient ranges from -1 to 1, and a value greater than 0.75 indicates that the model has high simulation accuracy. To ensure the reliability of the simulation results, this study used land use data from 2010 to simulate the land use situation for 2020. Subsequently, the simulation results were compared and analyzed with the observed data from 2020. The comparison between the simulation results and observed data shows that the Kappa coefficient reached 0.82, indicating that the model accuracy meets the simulation requirements. This demonstrates that the PLUS model is suitable for simulating land use changes in the Jinan Metropolitan Area.
Carbon storage calculation
InVEST model (Ou Yang et al., 2020) carbon storage and sequestration module is utilized to assess the CS in the study area. Carbon storage and sequestration module encompasses four carbon pools: aboveground carbon, belowground carbon, soil carbon, and dead organic carbon. It accounts for the varying capabilities of soil to absorb and store carbon compounds across different regions and land use types (Wang et al., 2024a), referencing the revised carbon density data (Hou et al., 2022; Liu et al., 2023; Wang et al., 2024b). Carbon density values were derived from published studies in China and the Yellow River Basin, climatically adjusted based on global patterns: positive correlations with annual precipitation but weak associations with mean annual temperature. We applied the formula for precipitation calibration that was proposed by Alam et al. (2013), combined with the methods for temperature-biomass corrections and integrated regional climate parameters proposed by Giardina et al. (2000) and Chen et al. (2007) to generate the finalized carbon density data for the Jinan Metropolitan Area (Table 4). Based on this, we predict the changes in the quantity and spatial pattern of CS caused by LUCC under various future development scenarios.
in which: CSi represents the carbon density of each land use type; Cabove is the aboveground carbon density; Cbelow is the belowground carbon density; Csoil is the soil carbon density; Cdead is the dead organic carbon density; Ai is the area of the i-th land type.
RESULTS
Land use dynamics from 2010 to 2020
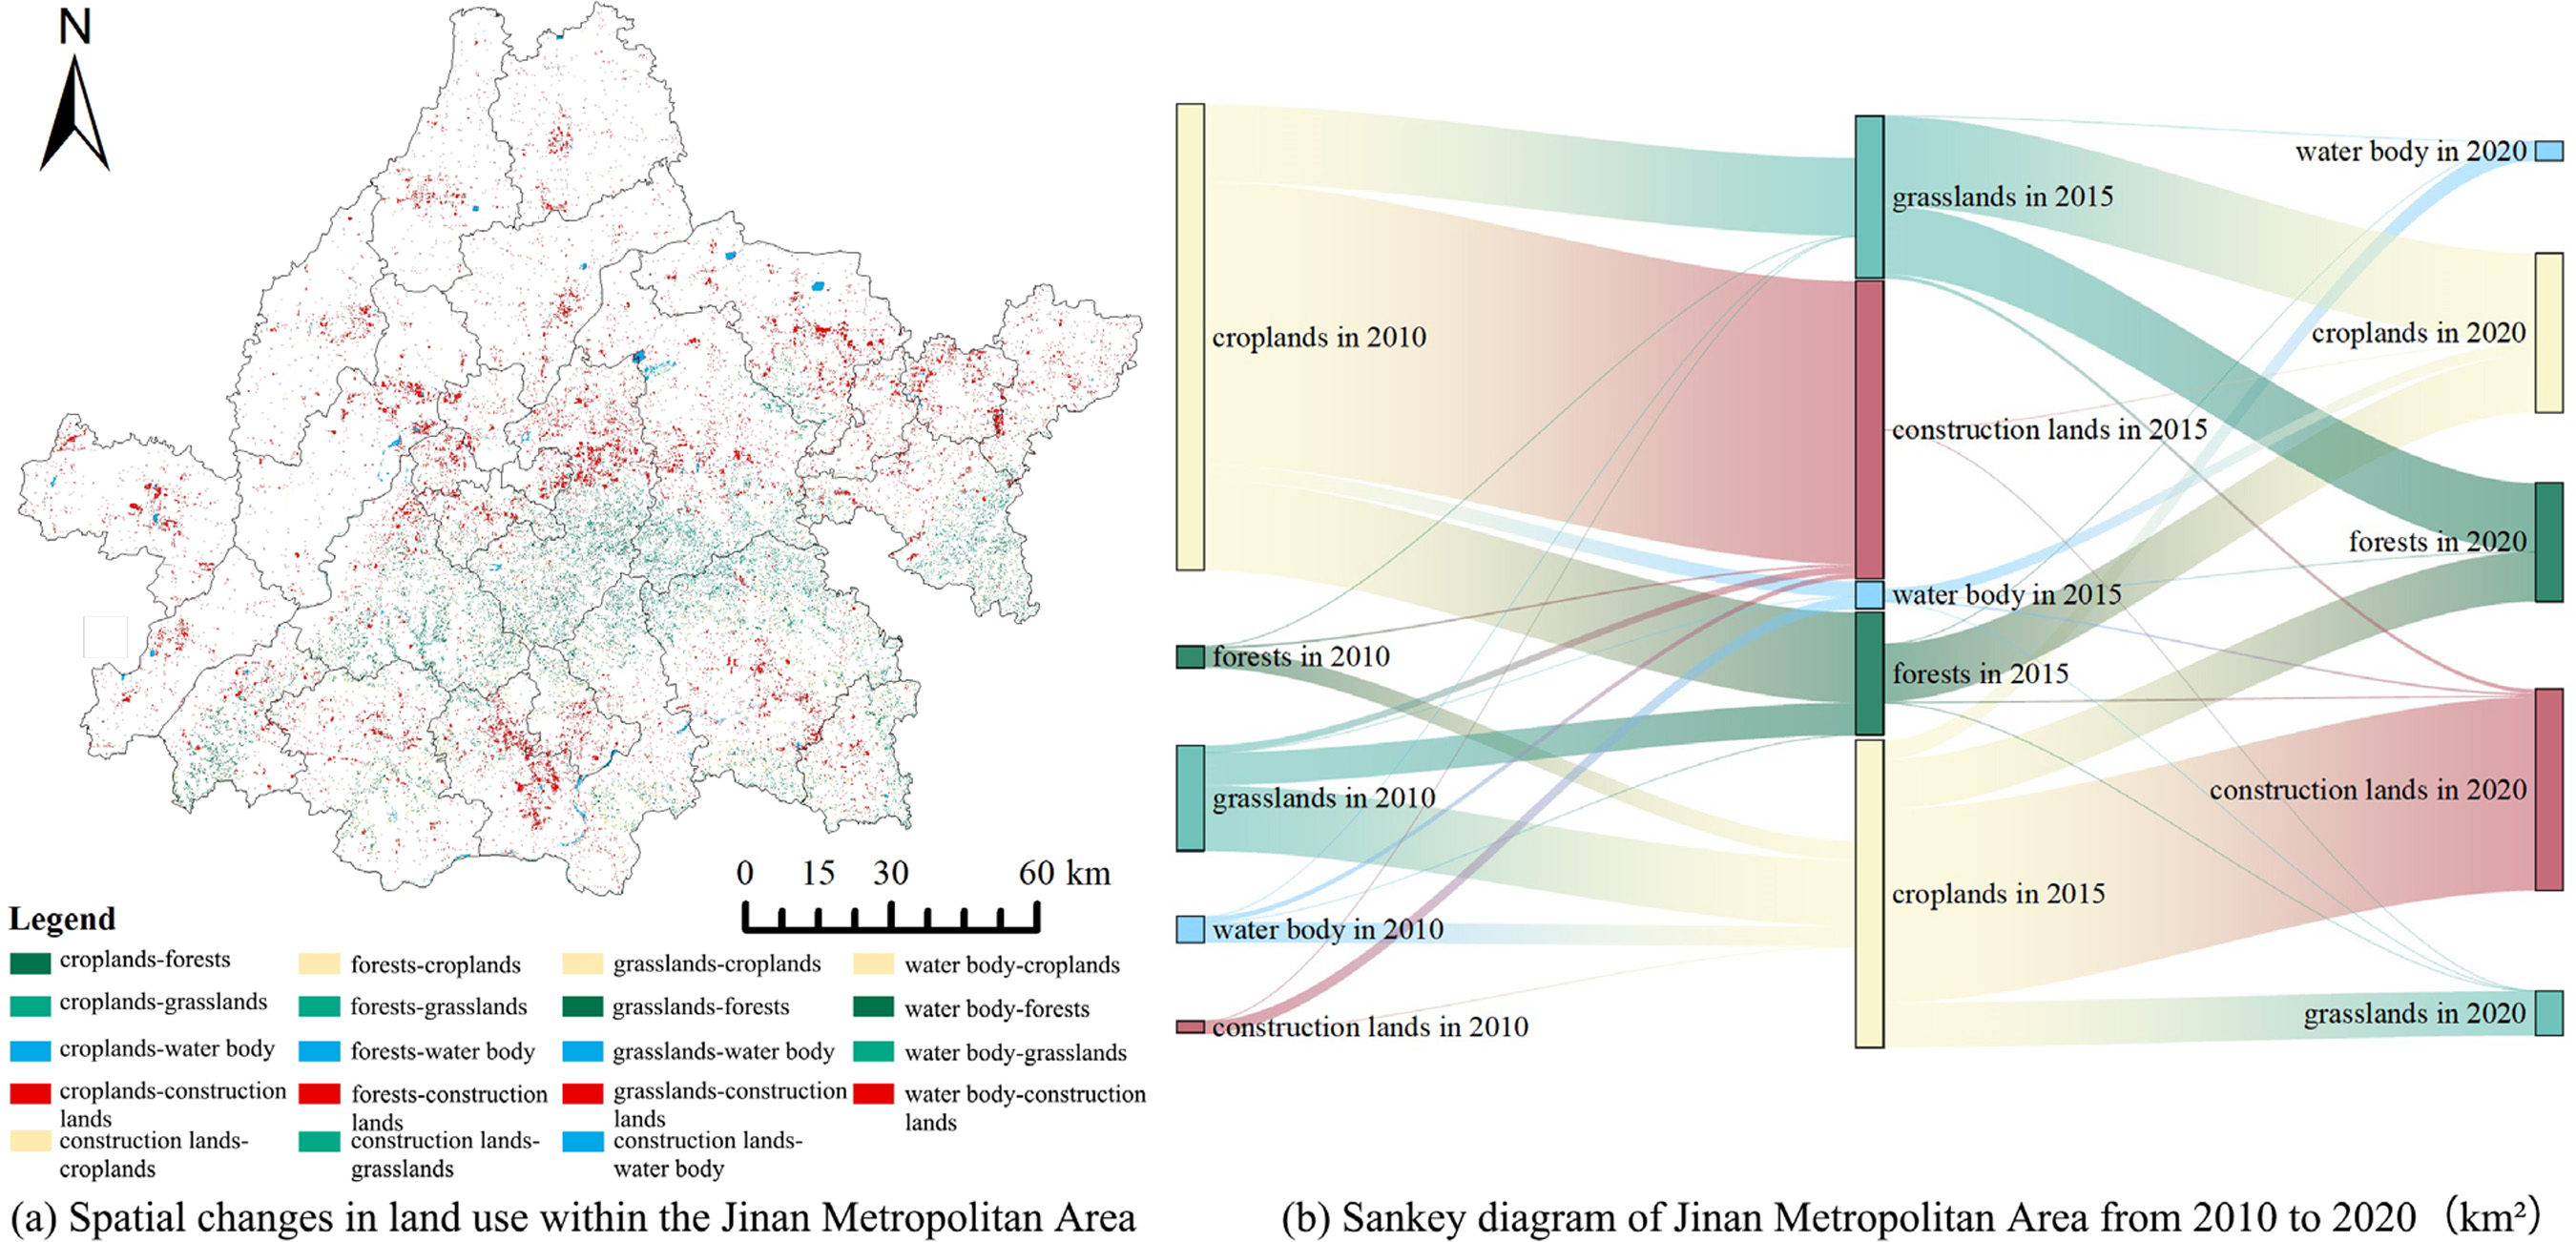
Results of land use changes in JMA from 2010 to 2020 (Table 5) reveal that the predominant land use types are cropland and construction land, accounting for over 60 and 20 % of the total area. During this period, the areas of croplands and grasslands experienced a decline, with reductions of 743.52 and 211.69 km², corresponding to decreases of 5.03 and 23.88 %, respectively. In contrast, the areas of forests, water bodies, and construction land exhibited an increase, with gains of 234.56, 22.14, and 698.51 km², representing proportional increases of 13.84, 9.25, and 14.95 %, respectively, compared to the levels in 2010.
In terms of land transition probabilities (Figure 2), croplands (67.81 %) and grasslands (22.06 %) exhibit the greatest potential for conversion, highlighting their vulnerability and relatively lower stability. Conversely, construction land, which is characterized by intensive human activity and management, demonstrates a lower susceptibility to transformation (Wu et al., 2024). Within JMA, significant transition probabilities are observed for croplands (19.45 %), forests (20.86 %), and construction land (47.16 %), suggesting that other land types are more prone to being converted into these categories. Notably, the most significant transitions involve the conversion of croplands to construction land and forests, with areas of 695.23 and 180.35 km2, respectively, accounting for 66.68 and 17.30 % of the total cropland area that has undergone transition. Additionally, forests and grasslands primarily convert to croplands, with respective areas of 79.01 and 182.30 km². Taking into account the spatial change of land use (Figure 2a), the accelerated urbanization process and intensified human activities have triggered cropland encroachment in peri-urban areas. Shandong implements the "Cultivated Land Balance Policy" as a major agricultural province to reclaim ecological lands in remote areas to compensate for cropland loss and safeguard food security and supply. These land-use functional transitions disrupt original ecological structures and agricultural productivity, with natural vegetation removal altering local hydrological cycles and carbon sequestration capacities. This phenomenon aligns with "cropland displacement" (Zuo et al., 2023), reflecting the characteristic complexity of land system responses during China urbanization. This phenomenon corresponds to the "cropland displacement" theorized by Zuo et al. (2023), manifesting the characteristic complexity of land system responses in China urbanization process.

Projected LUCC in Multiple Scenarios for 2030
Using the 2010 land use data as a baseline, the PLUS model was employed to project the spatial distribution of land use changes by 2020. A consistency assessment comparing these projections with the 2020 land use data revealed an overall classification accuracy of 0.90 and a Kappa coefficient of 0.82. These results indicate a high level of accuracy in the classification process, and meet the research requirements, thereby supporting predictions of land use in JMA for 2030.
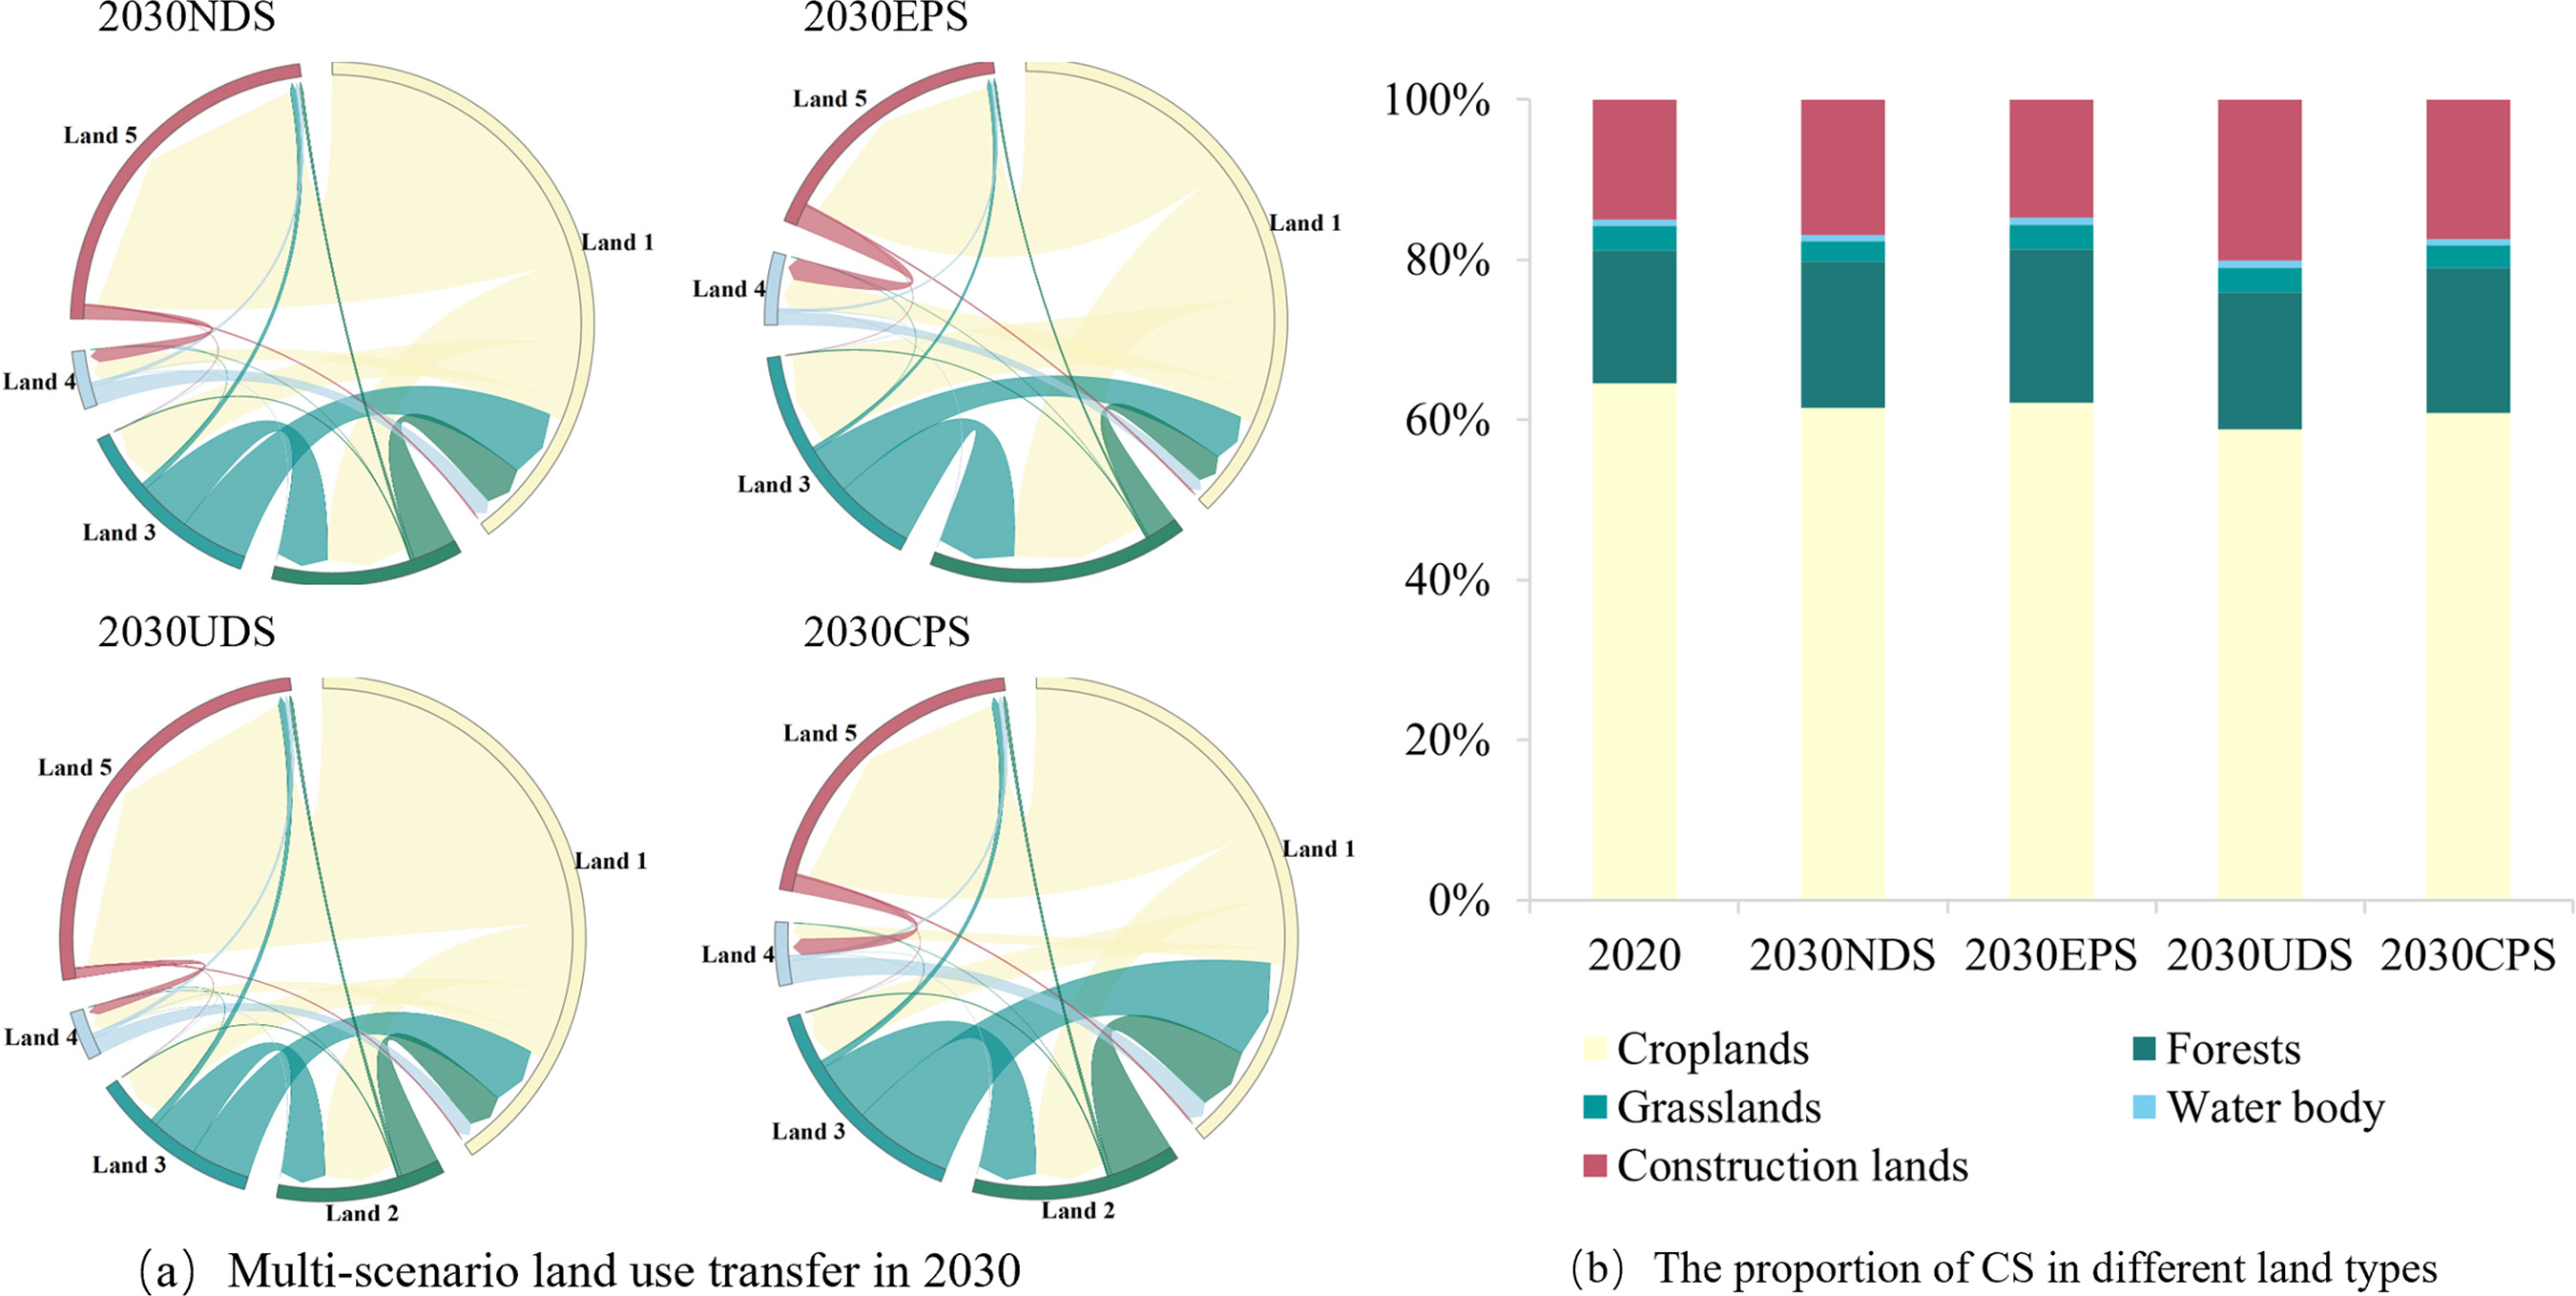
PLUS model projected the spatial distribution of land use under four scenarios for 2030 (Figure 3). Compared to current land use data from 2010 to 2020, the results indicate that the overall spatial distribution in JMA for 2030 is consistent with that of 2020, although variations exist across different scenarios (Table 6).
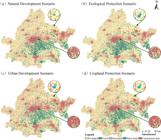
Under the NDS, which follows the LUCC pattern from 2010 to 2020, construction land continues to expand, with an increase of 657.07 km² (12.23 %) compared to 2020. Conversely, croplands and grasslands exhibit declining trends, with reductions of 720.06 and 136.82 km², respectively, representing declines of 5.12 and 20.27 %.
Under the EPS, the conversion of forests, grasslands, and water bodies to other types is restricted. As a results, the area of forests increased the most, by 319.72 km² (16.57 %), while construction land increased by 371.02 km², reflecting a lower increase of 6.91 % compared to the other scenarios. This approach effectively mitigates the expansion of construction land and reduces the declines in cropland and grassland areas to 4.84 and 9.02 %, respectively.
Under the UDS, the probability of various land use types converting to construction land is heightened, resulting in a net increase of 869.46 km² (16.19 %). In this scenario, construction land significantly encroaches upon adjacent croplands, grasslands, and forests, accelerating the reduction of cropland and grassland areas.
Under the CPS, the conversion of croplands to other land types is restricted to mitigate occupation. Compared to the other scenarios, the decrease in croplands is the lowest, at 2.63 %, with a net reduction of 369.00 km². However, while protecting croplands, the loss of grasslands is exacerbated, with the area of grasslands reduced by 194.29 km², a significant decrease of 28.79 %.
Spatiotemporal changes of CS in JMA
Carbon module of InVEST model was employed to quantify CS in JMA for 2010, 2015, and 2020, yielding values of 163.20 × 10⁶ Mg, 162.94 × 10⁶ Mg, and 162.62 × 10⁶ Mg, respectively. The overall trend reveals a gradual decline in CS, with a cumulative reduction of 571,910.79 Mg over the decade. The CS across various land types, ranked in descending order, comprises croplands, forests, construction land, grasslands, and water bodies. From 2010 to 2020, the most significant reductions in CS occurred in croplands (5556309.30 Mg) and grasslands (1575409.60 Mg). In contrast, CS in forests, water bodies, and construction land increased by 3,293,048.21, 104,757.96, and 3,162,001.94 Mg, respectively.
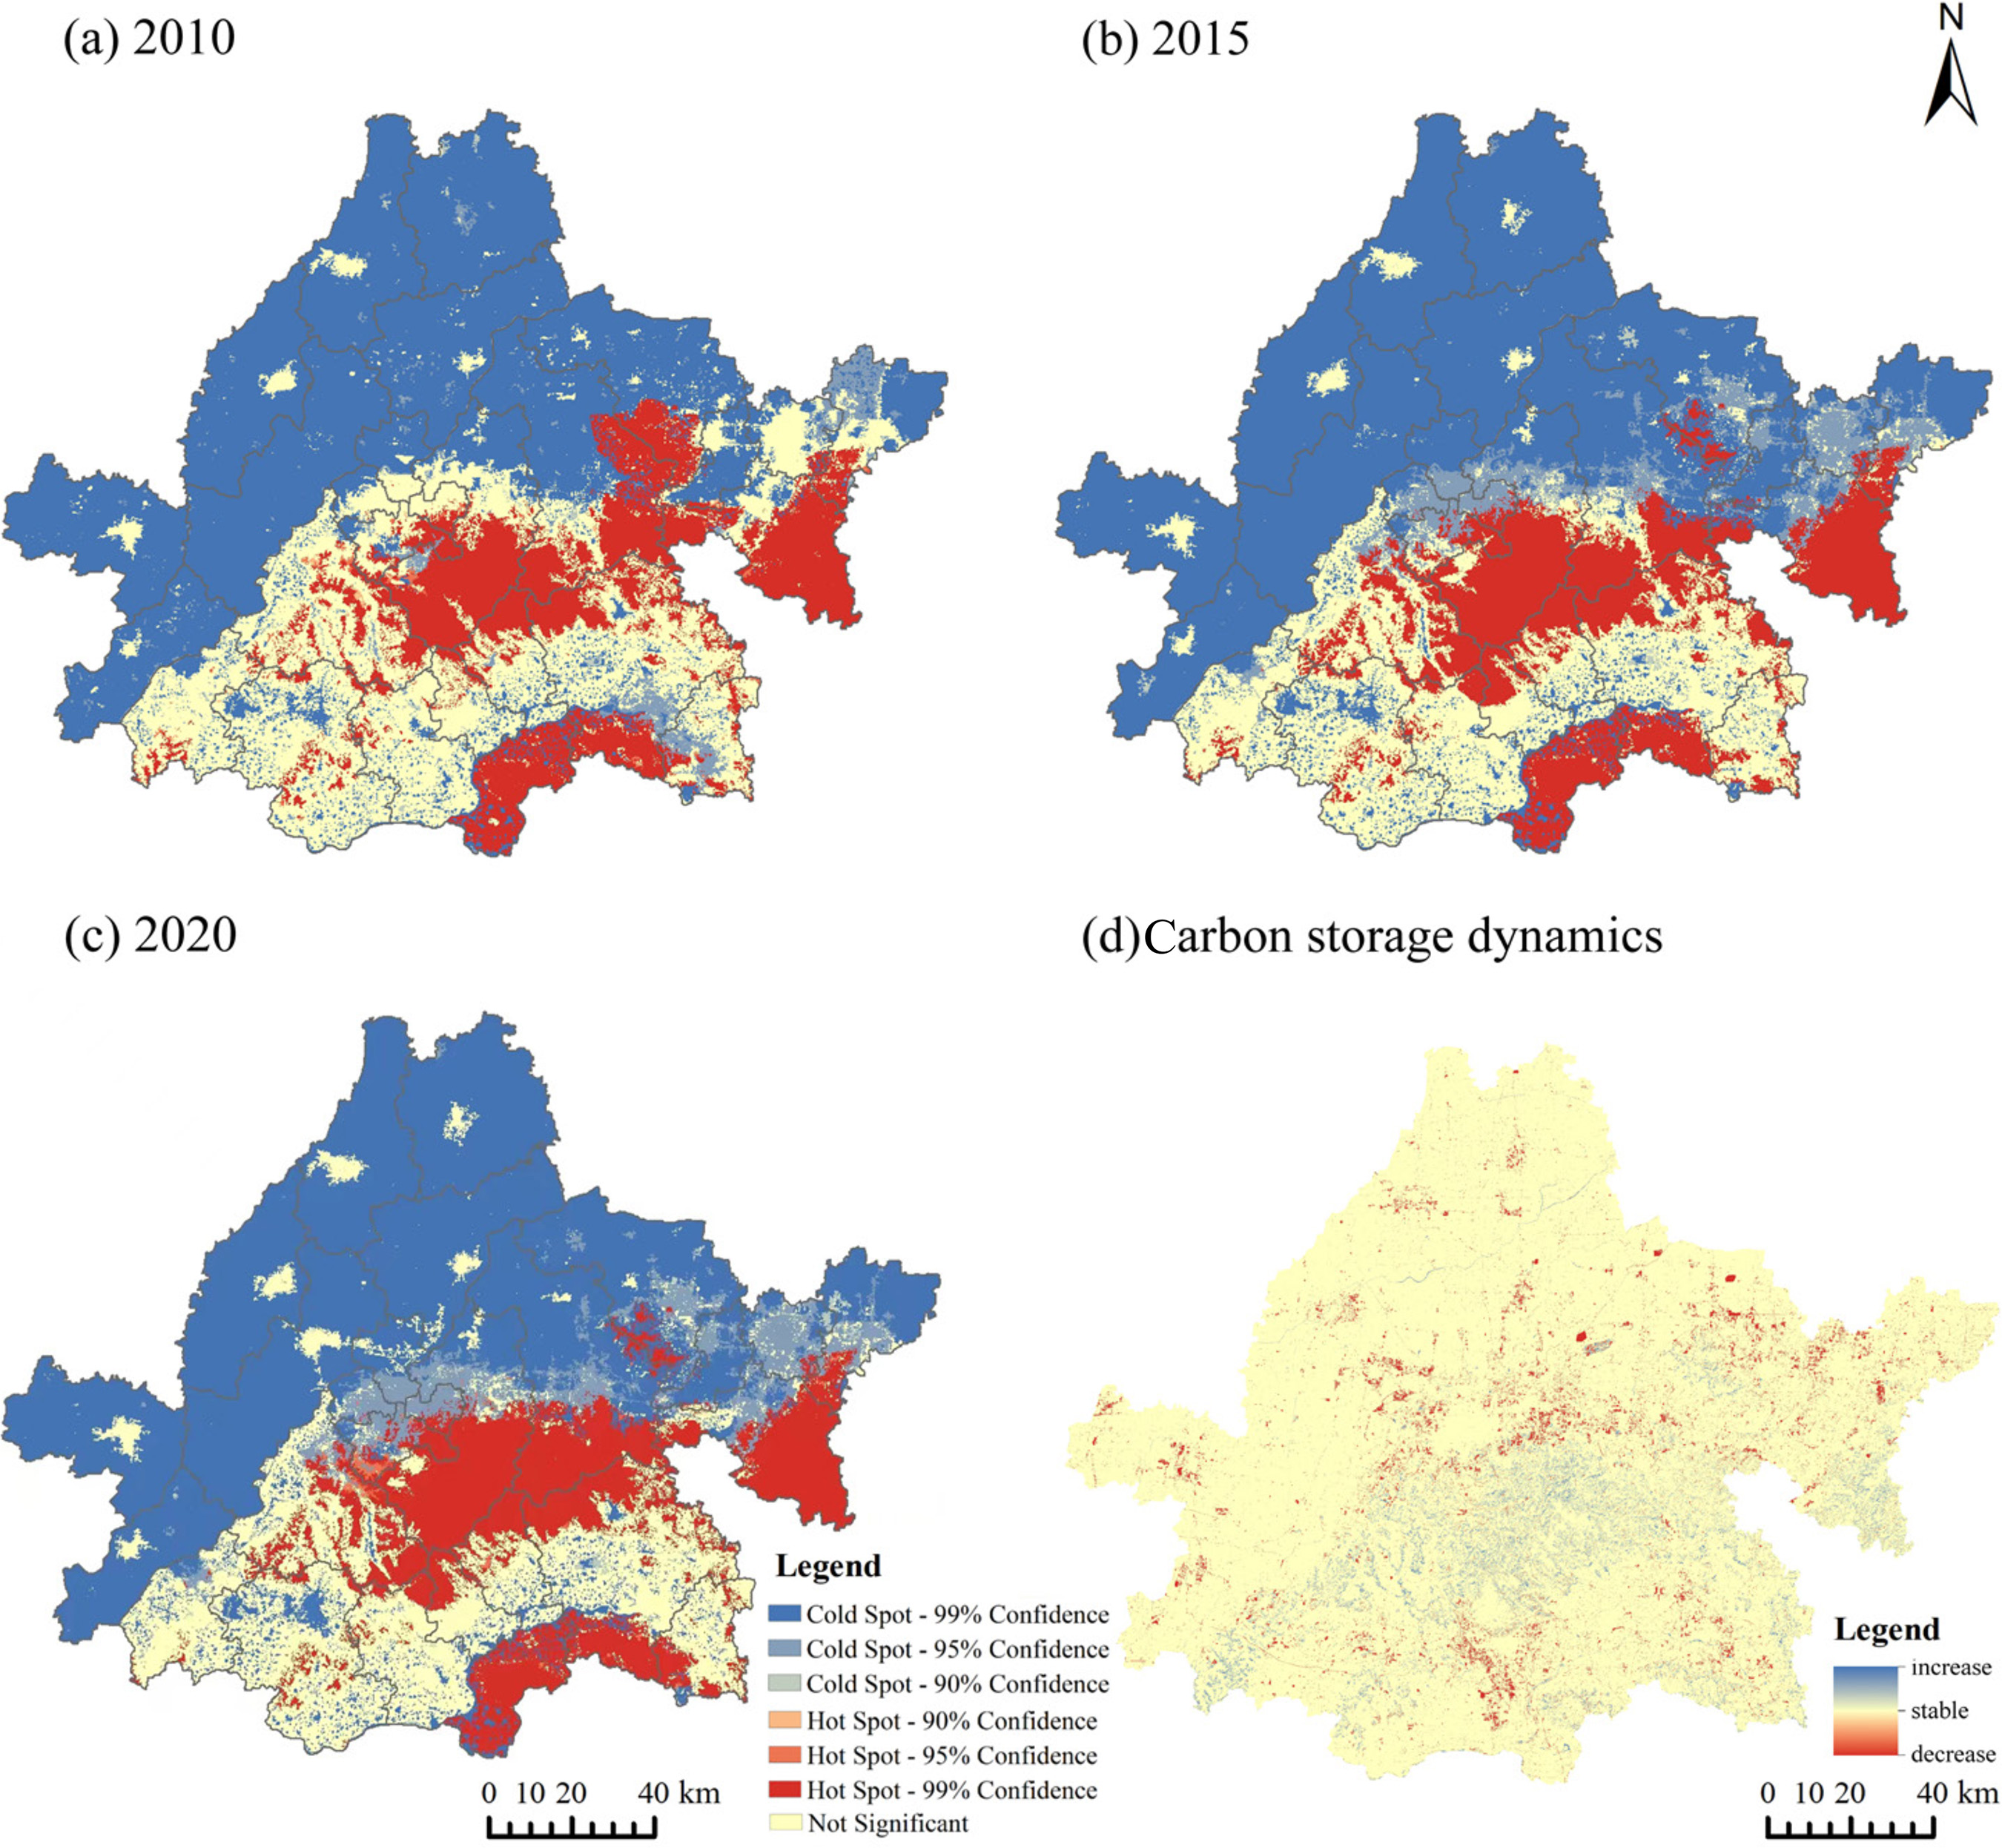
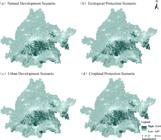
Regarding spatial distribution (Figure 4), CS in JMA demonstrated stability from 2010 to 2020. Southern regions, which include Mount Tai, Yimeng Mountain, and Culai Mountain, were characterized by their high vegetation coverage and emerged as the most concentrated areas of CS, thereby functioning as notable carbon sinks. On the other hand, the northwest extensive plains, characterized by a substantial proportion of croplands and interspersed urban and rural construction land, accounted for the largest proportion of the total CS. Although these plains exhibited a lower carbon density compared to forests, the considerably larger area of croplands within the metropolitan area, relative to other land use types, explained this significant contribution. Moreover, the persistent expansion of construction land, which has invaded other land types with higher carbon density, has led to a continuous decrease in the overall CS.

Over the decade from 2010 to 2020 (Table 7), the process of land use conversion significantly contributed to the enhancement of CS. This enhancement was primarily achieved through the conversion of non-forest land uses into forests. Specifically, the conversion of croplands and grasslands into forests accounted for substantial areas of 180.35 and 140.15 km2. respectively, leading to increases in CS of 1,184,171.75 and 924,579.99 Mg. These conversions accounted for 94.77 % of the overall improvement in CS. Conversely, the reduction in CS was largely attributed to the allocation of land for construction purposes and the reversion of forested areas to alternative uses. Notably, the largest conversion of croplands to construction land, spanning 695.23 km2, resulted in a significant decrease in CS of 2,048,273.85 Mg, accounting for 73.23 % of the total reduction in CS. Thus, the expansion of construction land emerges as the primary direct cause of the decline in CS.
Additionally, converting forests to croplands, encompassing 79.01 km2 or 8.12 % of the total conversion area, led to a decrease in CS of 518750.73 Mg, accounting for 18.55 % of the overall CS reduction. These land-use type shifts are closely linked to dynamic variations in the regional total CS (Cao et al., 2023). Consequently, an increase in land use categories characterized by higher carbon densities (such as forests and grasslands) or a decrease in those with lower carbon densities (such as construction land) can effectively promote the accumulation of regional CS, whereas alternative scenarios result in opposing outcomes (Chen et al., 2021).
Utilizing the PLUS model, we conducted simulations to project land use patterns for 2030 under four distinct scenarios: the Natural Development Scenario (NDS), the Ecological Protection Scenario (EPS), the Urban Development Scenario (UDS), and the Comprehensive Planning Scenario (CPS). The corresponding total CS estimates for these scenarios were calculated to be 161.88 × 10⁶, 163.50 × 10⁶, 161.22 × 10⁶, and 162.11 × 10⁶ Mg, respectively. This analysis provides an assessment of the anticipated CS capacities for each scenario, thereby highlighting the potential impacts of different land use strategies on CS capabilities.
Compared to the baseline year of 2020, the EPS (Figure 5b) led to an increase of 873015.00 Mg. This increase was primarily concentrated in the southeastern Zichuan and Laiwu districts and the southwestern Pingyin County within the JMA region. This rise in CS under the EPS can be attributed to the implementation of restrictions on the conversion of forests, grasslands, and water bodies to other land use types, thereby effectively preventing land be occupied. The high carbon density of forests and grasslands further contributed to the overall rise in CS. In contrast, the remaining scenarios show a decreasing trend in CS. Specifically, under the NDS (Figure 5a), CS decreased by 802,738.29 Mg, primarily occurring in the central Zhangqiu and Licheng districts. The UDS exhibited the largest reduction (Figure 5c), with a decline of 1,438,569.86 Mg, particularly in the northeastern Linzi District, central Zhangqiu District, and southeastern Daiyue and Laiwu districts. Under the CPS (Figure 5d), the decrease in CS was the least pronounced, amounting to 651,613.51 Mg.
DISCUSSION
Impact of land use change on carbon storage in the Jinan Metropolitan Area
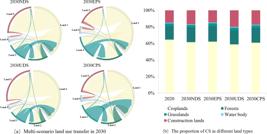
The JMA is currently in its initial development phase, with Jinan City occupying a central position in driving regional growth. Comprehensive planning and optimization of both urban and ecological spaces are critical for promoting high-quality regional development. Analyzing the impact of land use on CS holds strategic significance for territorial spatial planning and supporting national ‘dual-carbon’ goals (Wang et al., 2024c). The LUCC in JMA from 2010 to 2020 significantly decreased overall CS, primarily due to the rapid expansion of construction land. This expansion failed to compensate for the loss of CS caused by reduced forests, grasslands, and other land types. Indeed, the expansion of construction land emerged as the primary factor limiting CS growth in JMA (Wang et al., 2025b), consistent with the findings of Feng et al. (2024) and Zhi (2024), who reported that urban expansion significantly diminishes ecosystem service values. In projections for 2030 under multiple land-use scenarios (Figure 6), construction land is expected to increase across all scenarios. However, under the EPS, this increase is minimal, effectively mitigating the reduction of croplands and grasslands and leading to the only scenario with positive CS growth. This projection aligns with the ecological priorities outlined in the 'Jinan Metropolitan Area Development Plan (2024-2030)', which emphasizes the protection of major carbon sinks — Mount Tai and the Yimeng Mountains — while restricting urban expansion in southern mountainous regions to safeguard water sources and ecological integrity.
Strategies to mitigate the decline in carbon storage
Forests and grasslands, characterized by their high carbon density, exhibit a significant CS capacity. In the context of development planning for the Jinan Metropolitan Area, these ecologically valuable lands should be prioritized for protection through targeted policy interventions. Additionally, it is crucial to address the human-land conflicts and structural shifts in land use driven by rapid economic growth. Construction land and croplands, as fundamental components of the regional land-use system, require effective CS management (Li et al., 2024b) (Figure 6b). The adoption of agricultural practices such as straw mulching and the application of organic manure can significantly enhance the CS potential of croplands. To promote new energy and emerging industries, as well as new productivity of urban industry and development concept, to achieve both carbon reduction and sequestration goals. This includes fostering the convergence of the digital and real economies, accelerating the digital transformation of industries and society (Tan et al., 2024), and promoting green, low-carbon production and lifestyles (Zhao et al., 2024b). These measures are essential for ensuring the sustainable development of JMA and advancing the national goals of carbon peaking and neutrality.
The urbanization of the Jinan Metropolitan Area will persistently drive land use structure optimization. PLUS model simulations demonstrate rigid construction land expansion across all scenarios, encroaching on cultivated and ecological spaces. To address this, we propose implementing a "dual-control" system (total quota and intensity) for construction land, enhancing precision management of cultivated land requisition-compensation balance, and establishing an ecological land elastic reservation mechanism to foster coordinated metropolitan development.
Limitations of this study
This study integrated spatial heterogeneity analysis with the PLUS and InVEST models and multi-dimensional parameter analysis to systematically investigate land use patterns and carbon stock dynamics in the metropolitan area during 2010-2030. While this approach enhanced our understanding of land use changes and carbon storage trends, limitations exist in the InVEST model's carbon stock estimation. Carbon density data derived from the lower Yellow River basin and adjacent regions could not fully account for spatial variations within identical land use types, resulting in uncertainties in spatial distribution simulations. Future studies should focus on refining carbon density data accuracy and validating their temporal validity to enhance model reliability.
CONCLUSIONS
From 2010 to 2020, land use patterns in the Jinan Metropolitan Area exhibited significant transformation, characterized by a 14.95 % expansion of construction land and a 5.03 % reduction in cropland. This land-use transition led to a decline in regional carbon storage by 5.80 million tons, with diminished carbon sink capacity primarily attributed to urban development in core urban zones and forest degradation. Meanwhile, southern mountainous regions-including Mount Tai, the Yi-meng Mountains, and Culai Mountain-served as critical contributors to carbon sequestration, counterbalancing ecological losses in urbanized areas.
Ecological Protection Scenario emerges as the sole pathway achieving a modest carbon storage increase (+0.21 %), mediated through integrated cropland preservation and forest expansion to reconcile development demands. Conversely, the Urban Development Scenario precipitates the highest carbon loss (-0.60 %), underscoring the imperative for stringent regulation of unplanned construction land sprawl to sustain Jinan ecological resilience.
ACKNOWLEDGMENTS
We appreciate the significant contributions made by our collaborators. Special thanks go to the reviewers and editors for their constructive feedback on this manuscript.
DATA AVAILABILITY
The data will be provided upon request.
-
How to cite:
Wang X, Xiao W, Zhang X, Fan Y. Carbon storage response to land use changes under multi-scenario simulations in the Jinan Metropolitan area, in China. Rev Bras Cienc Solo. 2025;49:e0250004. https://doi.org/10.36783/18069657rbcs20250004
-
FUNDING
The People’s Government of Shandong Province: ZR2021ME226, the Ministry of Education of the People’s Republic of China: 21YJCZH024 and Shandong Federation of Social Science: 24BFS146.
REFERENCES
-
Alam SA, Starr M, Clark BJF. Tree biomass and soil organic carbon densities across the Sudanese woodland savannah: A regional carbon sequestration study. J Arid Environ. 2013;89:67-76. https://doi.org/10.1016/j.jaridenv.2012.10.002
» https://doi.org/10.1016/j.jaridenv.2012.10.002 -
Aneva I, Zhelev P, Lukanov S, Peneva M, Vassilev K, Zheljazkov VD. influence of the land use type on the wild plant diversity. Plants. 2020;9:602. https://doi.org/10.3390/plants9050602
» https://doi.org/10.3390/plants9050602 -
Cai BF, Zhu SL, Yu SM, Dong H, Zhang C, Wang C, Zhu J, Gao Q, Fang S, Pan X, Zheng X. The interpretation of 2019 refinement to the 2006 IPCC guidelines for national greenhouse gas inventory. Environ Eng. 2019;37:1-11. https://doi.org/10.13205/j.hjgc.201908001
» https://doi.org/10.13205/j.hjgc.201908001 -
Cai Z, Zhang Z, Zhao F, Guo X, Zhao J, Xu Y, Liu X. Assessment of eco-environmental quality changes and spatial heterogeneity in the Yellow River Delta based on the remote sensing ecological index and geo-detector model. Ecol Inform. 2023;77:102203. https://doi.org/10.1016/j.ecoinf.2023.102203
» https://doi.org/10.1016/j.ecoinf.2023.102203 -
Cao P, Qi X, Yang W, Tong B. Multi scenario simulation and prediction of carbon storage for land use types in Inner Mongolia. J Arid Land Res Environ. 2023;37:83-90. https://doi.org/10.13448/j.cnki.jalre.2023.212
» https://doi.org/10.13448/j.cnki.jalre.2023.212 -
Chen GS, Yang YS, Liu LZ, Li X, Zhao Y, Yuan Y. Research review on total belowground carbon allocation in forest ecosystems. J Subtrop Res Environ. 2007;2:34-42. https://doi.org/10.19687/j.cnki.1673-7105.2007.01.005
» https://doi.org/10.19687/j.cnki.1673-7105.2007.01.005 -
Chen L, Yang X, Li L, Chen L, Zhang Y. The natural and socioeconomic influences on land-use intensity: Evidence from China. Land. 2021;10:1254. https://doi.org/10.3390/land10111254
» https://doi.org/10.3390/land10111254 -
Duan XM, Han M, Kong XL, Sun JX, Zhang HX. Spatiotemporal evolution and simulation prediction of ecosystem carbon storage in the Yellow River Basin before and after the grain for green project. Environ Sci. 2024:5943-56. https://doi.org/10.13227/j.hjkx.202310021
» https://doi.org/10.13227/j.hjkx.202310021 -
Feng YF, Li C, Feng JM. Spatiotemporal response of ecosystem service value in Jinan metropolitan area to urban expansion based on GTWR model. J Beijing For Univ. 2024;46:104-18. https://doi.org/10.12171/j.1000-1522.20220489
» https://doi.org/10.12171/j.1000-1522.20220489 -
Fu KX, Jia GD, Yu XX, Chen LX. Analysis of temporal and spatial carbon stock changes and driving mechanism in Xinjiang region by coupled PLUS-InVEST-Geodector model. Environ Sci. 2024;45:5416-30. https://doi.org/10.13227/j.hjkx.202309230
» https://doi.org/10.13227/j.hjkx.202309230 -
Giardina CP, Ryan MG. Evidence that decomposition rates of organic carbon in mineral soil do not vary with temperature. Nature. 2000;404:858-61. https://doi.org/10.1038/35009076
» https://doi.org/10.1038/35009076 -
Gong SX, Zhang YH, Li YH. Spatio-temporal variation and prediction of carbon storage in Beijing-Tianjin-Hebei region-A PLUS-InVEST model approach. J Arid Land Res Environ. 2023;37:20-8. https://doi.org/10.13448/j.cnki.jalre.2023.133
» https://doi.org/10.13448/j.cnki.jalre.2023.133 -
Hou JK, Cheng JJ, Zhang KQ, Zhoy GQ, You HT, Han XW. Temporal and spatial variation characteristics of carbon storage in the source region of the Yellow River based on InVEST and GeoSoS-FLUS models and its response to different future scenarios. Environ Sci. 2022;43:5253-62. https://doi.org/10.13227/j.hjkx.202201267
» https://doi.org/10.13227/j.hjkx.202201267 -
Hou X, Song B, Zhang X, Wang X, Li D. Multi-scenario simulation and spatial-temporal analysis of LUCC in China’s coastal zone based on coupled SD-FLUS model. Chin Geogr Sci. 2024;34:579-98. https://doi.org/10.1007/s11769-024-1439-4
» https://doi.org/10.1007/s11769-024-1439-4 -
Huang X, Liu J, Peng S, Huang B. The impact of multi-scenario land use change on the water conservation in central Yunnan urban agglomeration, China. Ecol Indic. 2023;147:109922. https://doi.org/10.1016/j.ecolind.2023.109922
» https://doi.org/10.1016/j.ecolind.2023.109922 -
Jia JA, Guo WL, Xu LY, Gao C. Spatio-temporal evolution and driving force analysis of carbon storagein Anhui Province coupled with PLUS-InVEST-GeoDectetor model. Environ Sci. 2025;46:1703-15. https://doi.org/10.13227/j.hjkx.202403132
» https://doi.org/10.13227/j.hjkx.202403132 -
Jia TC, Hu XW. Spatiotemporal dynamic evolution characteristics of land use in China's 'Two Screens and Three Belts' ecological barrier areas from 1985 to 2020. Res Soil Water Conserv. 2024b;31:348-63. https://doi.org/10.13869/j.cnki.rswc.2024.04.038
» https://doi.org/10.13869/j.cnki.rswc.2024.04.038 -
Jia TC, Hu XW. Spatial-temporal change and driving force of carbon storage in three-river-source national park based on PLUS-InVEST-Geodector model. Environ Sci. 2024a;45:5931-42. https://doi.org/10.13227/j.hjkx.202310046
» https://doi.org/10.13227/j.hjkx.202310046 -
Li X, Ma X. An uncertain programming model for land use structure optimization to promote effectiveness of land use planning. Chin Geogr Sci. 2017;27:974-88. https://doi.org/10.1007/s11769-017-0896-4
» https://doi.org/10.1007/s11769-017-0896-4 -
Li ZJ, Wang ZY, Liu XT, Sol S, Ma X, Zuo Y. Using random forest and improved CA-Markov model to evaluate the effect of Spartina alterniflora clearing on wetland use and landscape pattern in the Yellow River Delta wetland. Acta Ecol Sin. 2024a;44:8366-82. https://doi.org/10.20103/j.stxb.202401250229
» https://doi.org/10.20103/j.stxb.202401250229 -
Li HT, Wang YB, Li CL, Hou L, Liu Z, Zhao L. Characteristics and influencing factors of land use/cover change in southern mountainous area of Jinan in recent 40 years. Environ Ecol. 2024b;6:15-24. https://doi.org/10.3969/j.issn.2096-6830.2024.3.hjstx202403005
» https://doi.org/10.3969/j.issn.2096-6830.2024.3.hjstx202403005 -
Liang X, Guan Q, Clarke KC, Liu S, Wang B, Yao Y. Understanding the drivers of sustainable land expansion using a patch-generating land use simulation (PLUS) model: A case study in Wuhan, China. Comput Environ Urban Syst. 2021;85:101569. https://doi.org/10.1016/j.compenvurbsys.2020.101569
» https://doi.org/10.1016/j.compenvurbsys.2020.101569 -
Liu W, Liu D, Liu Y. Spatially heterogeneous response of carbon storage to land use changes in pearl river delta urban agglomeration, China. Chin Geogr Sci. 2023;33:271-86. https://doi.org/10.1007/s11769-023-1343-3
» https://doi.org/10.1007/s11769-023-1343-3 - Liu Y, Zhang J, Zhou DM, Ma J, Dang R, Ma J, Zhu X. Temporal and spatial variation of carbon storage in the Shule River Basin based on InVEST model. Acta Ecol Sin. 2021;41:4052-65.
-
Ma YJ, Zhong JT, Mi WB, Shi JL, Jian X. Assessment and vulnerability analysis on carbon storage based on multi-scenarios simulation and prediction of land use in Qinghai Lake basin. J Arid Land Res Environ. 2023;37:46-55. https://doi.org/10.13448/j.cnki.jalre.2023.231
» https://doi.org/10.13448/j.cnki.jalre.2023.231 -
Min J, Liu XH, Xiao YX, Li HY, Luo X, Wang R, Xing L, Wang C, Zhao H. Analysis and predictions of the spatiotemporal variations of ecosystem carbon storage in the Xin'an River Basin Based on PLUS and InVEST models. Geoscience. 2024;38:574-88. https://doi.org/10.19657/j.geoscience.1000-8527.2024.050
» https://doi.org/10.19657/j.geoscience.1000-8527.2024.050 -
Ou Yang X, He QY, Zhu X. Simulation of impacts of urban agglomeration LUCC on ecosystem services value under multi-scenarios: Case Study in Changsha-Zhuzhou-Xiangtan urban agglomeration. Econ Geogr. 2020;40:93-102. https://doi.org/10.15957/j.cnki.jjdl.2020.01.011
» https://doi.org/10.15957/j.cnki.jjdl.2020.01.011 -
Pang CY, Wen Q, Ding JM, Wu XY, Shi L. Ecosystem services and their trade-offs and synergies in the upper reaches of the Yellow River basin. Acta Ecol Sin. 2024;44:5003-13. https://doi.org/10.20103/j.stxb.202306281376
» https://doi.org/10.20103/j.stxb.202306281376 -
Ren YM, Liu XP, Xu XC, Sun S, Zhao L, Liang X, Zeng L. Multi-scenario simulation of LUCC and its impact on ecosystem services in Beijing-Tianjin-Hebei region based on the FLUS-InVEST model. Acta Ecol Sin. 2023;43:4473-87.https://doi.org/10.5846/stxb202201280269
» https://doi.org/10.5846/stxb202201280269 -
Shi J, Shi PJ, Wang ZY, Cheng FY. Spatial-temporal evolution and prediction of carbon storage in Jiuquan City Ecosystem Based on PLUS-InVEST model. Environ Sci. 2024;45:300-13. https://doi.org/10.13227/j.hjkx.202302222
» https://doi.org/10.13227/j.hjkx.202302222 - Tan J, Meng W, Dong K. China-specific solutions for green and low-carbon cities: From the China-Singapore Tianjin Eco-city to the Boao Near-zero carbon demonstration zone. Urban Dev Stud. 2024;31:85-92.
-
Tang WR, Cao YH. Spatial-temporal evolution and prediction of carbon reserves in Wanjiang River Basin with the InVEST-PLUS model. Environ Sci. 2025;46:3818-29. https://doi.org/10.13227/j.hjkx.202406063
» https://doi.org/10.13227/j.hjkx.202406063 - Wang BS, Liao JF, Zhu W, Qiu Q, Wang L, Tang LN. The weight of neighborhood setting of the FLUS model based on a historical scenario: A case study of land use simulation of urban agglomeration of the Golden Triangle of Southern Fujian in 2030. Acta Ecol Sin. 2019;39:4284-98.
-
Wang CX, Deng MT, Wang XF, Hong WY. Spatial-temporal evolution and prediction simulation of carbon storage Based on PLUS-InVEST model. Chinese Land Archit. 2024a;40:70-6. https://doi.org/10.19775/j.cla.2024.06.0070
» https://doi.org/10.19775/j.cla.2024.06.0070 -
Wang HL, Qiu JZ, Wu JS. Multi-scenario land use optimization analysis of the Hohhot-Baotou-Ordos urban agglomeration under dual carbon targets. Geogr Res. 2025b;44:656-75. https://doi.org/10.11821/dlyj020240419
» https://doi.org/10.11821/dlyj020240419 -
Wang WW, Fu TL, Chen H. Spatial-temporal Evolution and Prediction of carbon storage in the Yangtze River Delta Urban Agglomeration Based on PLUS-InVEST Model. Environ Sci. 2025a;46:1937-50. https://doi.org/10.13227/j.hjkx.202404046
» https://doi.org/10.13227/j.hjkx.202404046 -
Wang YB, Li CL, Zang P, Hou L, Liu ZQ, Liu JQ, Qiu QT, Zhao CR. Research on the impact of land use/cover change on carbon storage in the southern mountain area of Jinan. China Environ Sci. 2024b;44:3986-98. https://doi.org/10.19674/j.cnki.issn1000-6923.20240026.001
» https://doi.org/10.19674/j.cnki.issn1000-6923.20240026.001 -
Wang Z, Wang B, Zhang Y, Zhang Q. Dynamic simulation of multi-scenario LUCC and carbon storage assessment in Hohhot City based on PLUS-InVEST model. JARE. 2024c;41:292-304. https://doi.org/10.13254/j.jare.2023.0249
» https://doi.org/10.13254/j.jare.2023.0249 -
Wu X, Shen C, Shi L, Wan Y, Ding J, Wen Q. Spatio-temporal evolution characteristics and simulation prediction of carbon storage: A case study in Sanjiangyuan Area, China. Ecol Inform. 2024;80:102485. https://doi.org/10.1016/j.ecoinf.2024.102485
» https://doi.org/10.1016/j.ecoinf.2024.102485 -
Yang J, Huang X. The 30 m annual land cover dataset and its dynamics in China from 1990 to 2019. Earth Syst Sci Data. 2021;13:3907-25. https://doi.org/10.5194/essd-13-3907-2021
» https://doi.org/10.5194/essd-13-3907-2021 -
Zeng QY, Sun CZ. Estimation and influencing factors of carbon storage in terrestrial ecosystems in the Yellow River Basin. Acta Ecol Sin. 2024;44:5476-93. https://doi.org/10.20103/j.stxb.202311012367
» https://doi.org/10.20103/j.stxb.202311012367 -
Zhao R, Fang K, Wang LL. Exploration of urban low-carbon development paths from the carbon labeling perspective. Environ Prot. 2024b;52:45-8. https://doi.org/10.14026/j.cnki.0253-9705.2024.16.008
» https://doi.org/10.14026/j.cnki.0253-9705.2024.16.008 -
Zhao X, Xu Y, Pu J, Tao J, Chen Y, Huang P, Shi X, Ran Y, Gu Z. Achieving the supply-demand balance of ecosystem services through zoning regulation based on land use thresholds. Land Use Policy. 2024a;139:107056. https://doi.org/10.1016/j.landusepol.2024.107056
» https://doi.org/10.1016/j.landusepol.2024.107056 -
Zhi F, Zhou ZH, Zhao M, Wang S. Temporal and spatial evolution characteristics of carbon storage in hefei ecosystem based on PLUS and InVEST models. J Soil Water Conserv. 2024;38:205-15. https://doi.org/10.13870/j.cnki.stbcxb.2024.02.033
» https://doi.org/10.13870/j.cnki.stbcxb.2024.02.033 -
Zuo C, Wen C, Clarke G, Turner A, Ke X, You L, Tang L. Cropland displacement contributed 60% of the increase in carbon emissions of grain transport in China over 1990–2015. Nature Food. 2023;4:223-35. https://doi.org/10.1038/s43016-023-00708-x
» https://doi.org/10.1038/s43016-023-00708-x
Edited by
-
Editor:
José Miguel Reichert https://orcid.org/0000-0001-9943-2898 and Edivan Rodrigues de Souza https://orcid.org/0000-0002-2442-7266