 Impact of a forage legume or nitrogen fertilizer application on ammonia volatilization and nitrous oxide emissions in Brachiaria pastures
ABSTRACT
The largest proportion of greenhouse gas (GHG) emissions in the Agriculture sector of the Brazilian national GHG inventory is derived from the large (>200 million head) herd of cattle. The greatest contribution to these emissions comes from the enteric methane from cattle, but the direct and indirect emissions of nitrous oxide (N2O) from cattle excreta and N fertilizer are responsible for approximately 9 % of all national anthropogenic GHG emissions. Ammonia (NH3) can be volatilized from N fertilizer and cattle excreta and deposited in sites remote from the source, constituting an indirect source of N2O. This study aimed to determine whether direct N2O emissions and NH3 volatilization from N-fertilized pastures were greater than those derived from a mixed grass-legume pasture without N fertilizer addition. Emissions of N2O and NH3 from excreta and N fertilizer from a Palisade grass (Urochloa brizantha cv. Marandu) monoculture fertilized with 2 × 60 kg N ha-1 yr-1 urea were compared to those from a mixed Palisade grass-forage peanut (Arachis pintoi) pasture. Dung and urine were collected from these cattle, and NH3 losses and N2O emissions from the excreta and from N fertilizer were monitored using static chamber techniques. Volatilization of NH3 and N2O emissions were found to be greater from urine than from dung. Ammonia losses from excreta and urea fertilizer were low, not exceeding 6.8, 1.1, and 4.7 % of the N applied as urine, dung, and fertilizer, respectively. The N2O emissions showed a tendency to be greater for the urine from the N-fertilized compared to the mixed grass-legume pasture, and the N2O emissions from the urine of the N-fertilized pasture ranged from 0.08 to 0.94 % of applied urine N. The N2O emission from the N fertilizer was at maximum 0.46 % of the applied N. The direct N2O emissions and the loss of NH3 by volatilization (indirect N2O emission) from the excreta of cattle grazing the mixed grass-legume pasture were similar to, or lower than, the grazed grass monoculture fertilized with 120 kg N ha-1 yr-1. As the mixed pasture received no N fertilizer and hence no GHG emission from its manufacture or application, introducing forage peanut to the Urochloa brizantha pastures shows potential to be responsible for lower GHG emissions than the N fertilized grass pasture.
Keywords
Arachis pintoi
; greenhouse gas emissions;
Urochloa brizantha
; ammonia volatilization; dairy cattle; nitrous oxide
INTRODUCTION
In Brazil, the Agriculture sector is responsible for approximately 28 % of anthropogenic greenhouse gas (GHG) emissions (MCTI, 2022). Within the Agricultural sector, as defined by the IPCC (2006), 57 % of the emissions (in CO2 equivalents) are methane (CH4); principally enteric CH4 from the digestive tract of cattle and other ruminants. Emissions from agricultural soils contribute a further 31 % to the emission of this sector and are almost exclusively direct and indirect emissions of nitrous oxide (N2O), which contribute 96 % of the total N2O emissions from agriculture. Indirect emissions include mineral N and other soluble N compounds lost by leaching and volatilization of ammonia, which eventually are transformed into N2O. The largest sources of N2O emissions are derived from the deposition of animal waste in pasture and mineral fertilizer application and are estimated at 42 and 18 % of all N2O emissions, respectively (MCTI, 2022). In Brazil, the deposition of animal excreta dominates as the source of N2O emissions owing to the very large herd of cattle (~220 million head) in the country, of which 90 % are beef cattle, mostly reared on very extensive low-productivity pastures. The largest areas of extensive pasture are in the Amazon, Cerrado (central savanna area) and Atlantic Forest biomes in the tropical regions of Brazil and the dominant pasture species are those of Urochloa (Syn. Brachiaria). It is estimated that there are approximately 90 Mha of Urochloa pastures in Brazil, and approximately 50 % are of the cultivar Marandu of the species U. brizantha (Jank et al., 2014).
Summing the commitments made at the Conference of the Parties (COP) 15 in Copenhagen, COP 21 in Paris and COP 26 in Glasgow, Brazil is committed to reducing GHG emissions by 37 % until 2025, and by 50 % until 2030, based on 2005. To accomplish these reductions, several goals were established in the Low Carbon Agriculture (LCA) plan, among which are the recovery of degraded pastures and the expansion of the area using biological nitrogen fixation (BNF).
Nitrogen (N) is essential for forages. Generally, pasture degradation starts with soil compaction and nutrient loss (especially N) from animal excreta, which is associated with high stocking rates (Boddey et al., 2004). Nitrogen fertilizers help maintain production, prevent degradation and may also improve the accumulation of carbon in the soil (Eclesia et al., 2012; Conant et al., 2017). Despite the advantages, nitrogen fertilizer has a high financial cost, and its synthesis, transport, and application in the field demand a considerable amount of energy derived from fossil fuels. In addition, it can also be a direct and indirect source of N2O after being applied to the soil. Productivity increases induced by N fertilizer additions increase not only N2O and fossil fuel emissions per ha or per animal, but also increase enteric CH4 emissions. However, in the case of beef cattle, fattening times can be drastically reduced, from typically 48 months on degraded or unfertilized pastures to 30 months or less with well-fertilized pastures with superior forages and animal management (Mazzetto et al., 2015). This decrease in the time the cattle remain in the field producing GHG is estimated to reduce emission intensity (emissions per kg product) by 50 to 55 % (Mazzetto et al., 2015; Cardoso et al., 2016).
Forage legumes in mixed pastures can be an alternative to synthetic nitrogen fertilizer and can have lower financial and environmental costs. The BNF can provide a continuous addition of atmospheric N2 to the system. Tropical forage legumes generally have higher crude protein content and dry matter digestibility than those registered in tropical grasses, bringing a nutritional gain for animals (Barcellos et al., 2008; Boddey et al., 2020). Recent studies in Brazil have shown stoloniferous forage legumes (Arachis pintoi or Desmodium ovalifolium) can persist in mixed pastures with Marandu grass and promote live weight gains similar to, or superior to, Marandu grass in monoculture fertilized with 120 or 150 kg N ha-1 yr-1 (Pereira et al., 2020; Homem et al., 2021a; Santos et al., 2022). However, the higher consumption of protein increases the N content of excreta and may increase the emissions of GHGs. This could represent an obstacle to adopting the technology, as it is not known what the magnitude of the losses would be and to what extent replacing mineral fertilizer would be worthwhile. In addition, when animals switch to better quality diets and ingest more N, the partition of N in excreta between dung and urine changes. While the N content of dung is little affected, in urine the increase is proportional to the increase in N content of the diet (Scholefield et al., 1991; Dijkstra et al., 2013). Nitrogen in the urine is mostly in the form of urea, which hydrolyses rapidly to ammonia, making it very susceptible to loss. In contrast, the N in dung is mostly organic and is only slowly converted to mineral forms.
Regarding direct N2O emissions from excreta, the IPCC (2006) adopted a “default” FE value of 2 %, not discriminating between urine and dung. This value was based on experimental results, mainly concentrated in the northern hemisphere, in Europe, and in the southern hemisphere, New Zealand, where animal diets are completely different from tropical countries such as Brazil. As diets in these countries are high in protein, the largest portion of N is excreted via urine and a unique EF value was adopted that ignored dung. However, in Brazil, animal production is mostly practiced extensively and, with the exception of the southern states, predominantly with Urochloa spp., which has low nutritional value. For this reason, the partition of N between dung and urine and the estimation of separate emission factors are likely to be important for accurately assessing N2O emissions from cattle excreta. The importance of disaggregating EFs in excreta has been demonstrated in studies performed in Europe (van Groenigen et al., 2005) and many other countries (van der Weerden et al., 2011), as well as studies conducted in Brazil, indicating the use of specific EFs for N2O emissions from each form of excreta would be advantageous (Sordi et al., 2013; Lessa et al., 2014). In the 2019 Refinement of the IPCC 2006 Guidelines, the EFN2O of cattle urine is given as 0.77 and 0.32 %, and of cattle dung to 0.13 and 0.07 % for wet and dry climates, respectively (van der Weerden et al., 2021).
Most evaluations of N2O emissions from crops and pastures have been conducted using static chambers and such techniques are not without their problems. However, if repetition in space and time (sampling frequency) is sufficient, such estimates have been accepted for the estimations of EF by the scientific community. In the case of urea fertilizer and urine, there can be large losses of N via ammonia volatilization (Lessa et al., 2014; Martins et al., 2017; Nichols et al., 2018). To estimate ammonia volatilization from dung and urine patches, chamber techniques are the most convenient (Jantalia et al., 2012; Nichols et al., 2018; Guimarães et al., 2022).
There are several reports in the literature about N2O emissions from grass-clover pastures in Europe and New Zealand, but, in many cases, considerable organic or inorganic N fertilizers were also applied (Saggar et al., 2004; Burchill et al., 2014). van der Weerden et al. (2020) performed a meta-analysis on N2O emissions from dung and urine on over 1000 pasture sites in New Zealand where many pastures were mixed clover-grass. However, this study did not compare emissions of N2O from excreta deposited in mixed swards with those in grass monoculture. It is to be expected that the greatest N2O emissions and NH3 losses in grazed pastures would come from urine and dung (Cardoso et al., 2019; Bretas et al., 2020). To date, there is only one report on N2O or NH3 emissions from these sources for mixed pastures of Brachiaria with a tropical legume (Guimarães et al., 2022). We hypothesised that introducing a forage legume to Brachiaria pastures would promote smaller increases in NH3 and N2O losses from bovine excreta than applying N fertilizer. This study aimed to quantify the emissions of N2O and volatilization of NH3 from dung and urine patches and, when present, from urea fertilizer, in grazed palisade grass pastures fertilized with urea or with the presence of forage peanut (Arachis pintoi).
MATERIALS AND METHODS
Location, history and characterization of the experimental area
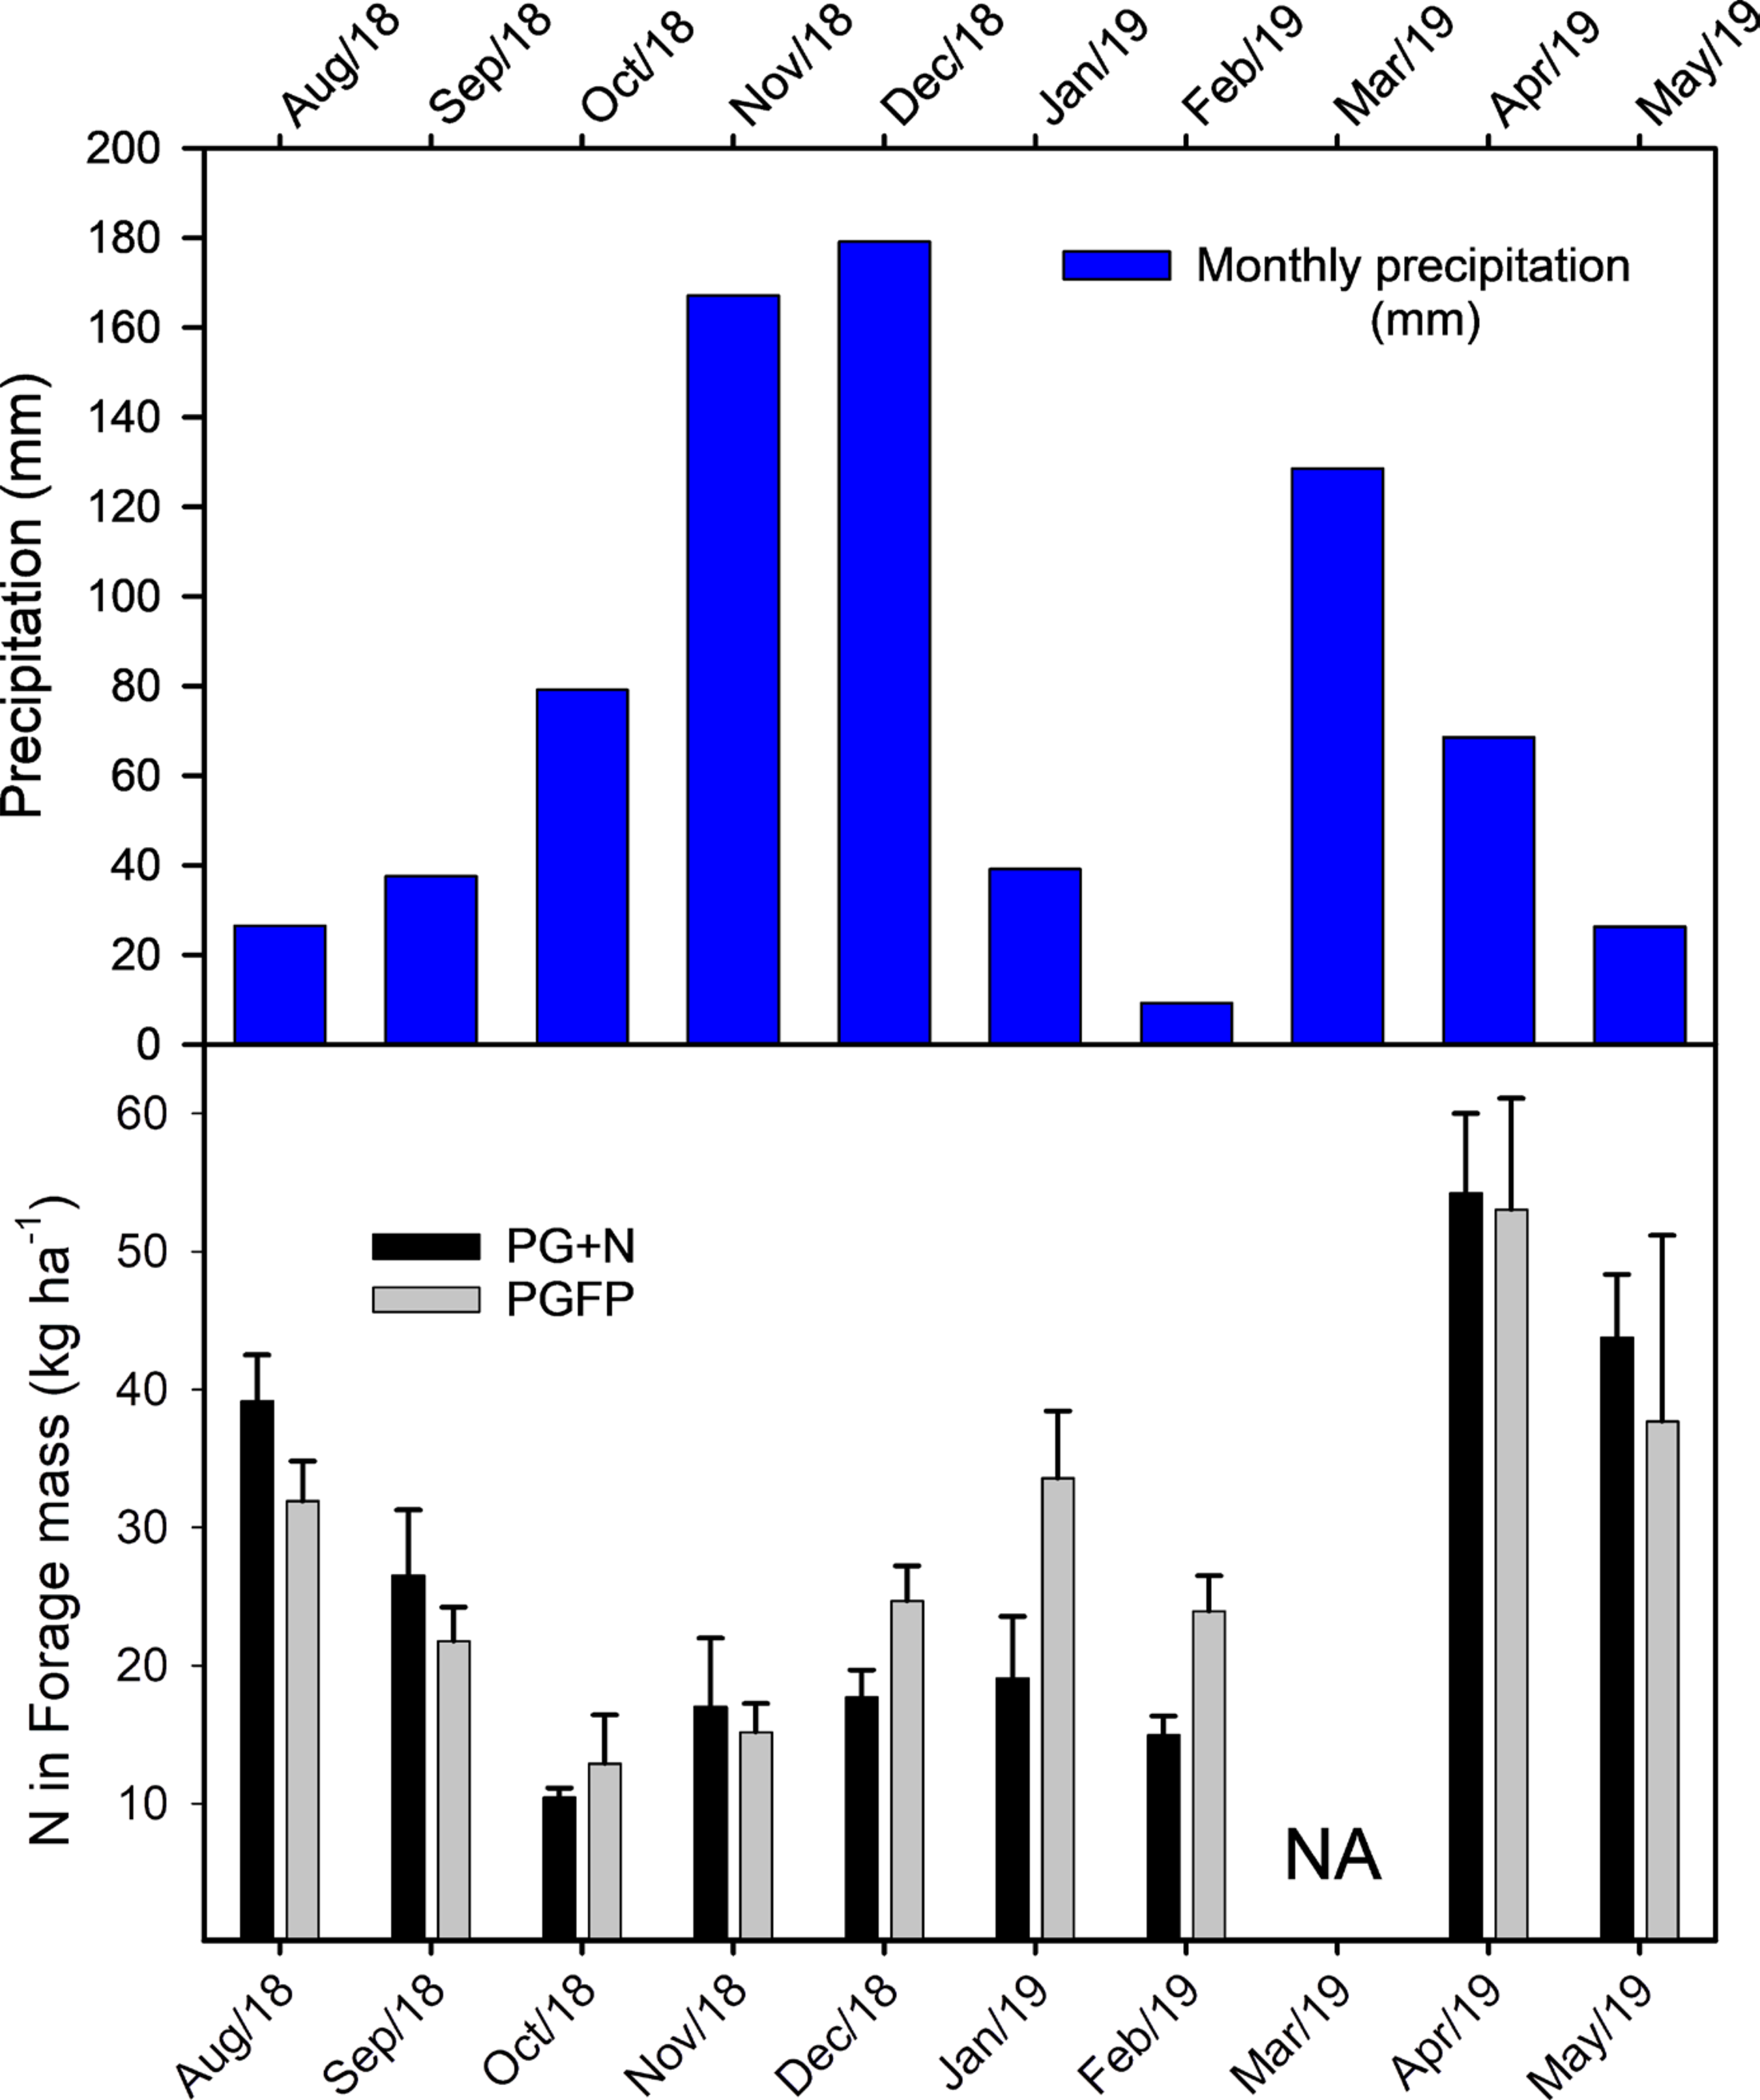
The experiment was carried out at the Animal Husbandry Experimental Station of the Extreme South of Bahia (ESSUL) of the Cocoa Research Institute - CEPLAC, located in the municipality of Itabela - BA (16° 66’ S; 39° 50’ W, 128 m altitude [a.s.l.]). The region is in the Atlantic Forest biome and the local climate is classified (Köppen classification system) as a transition between the tropical humid (Af) and monsoon (Am) types, characterized by the absence of marked dry season. The highest temperatures of the year occur from October to April, while the months of June, July and August are the coolest. Average annual rainfall is approximately 1300 mm and occurs predominantly between October and April. Rainfall and temperature data for the gas monitoring periods of the experiment are displayed in figure 1. The soil in the area is an Acrisol (Abruptic, Hyperdytric - WRB/FAO classification) or a “Latossolo Amarelo Distrocoeso” by the Brazilian classification, according to Santana et al. (2002). Soil texture is sandy at the surface, with clay content increasing down the profile (a characteristic of this soil type) from 160 (0.00-0.05 m) to 250 g kg-1 (0.20-0.30 m).
Monthly rainfall and nitrogen accumulated in forage mass over monthly periods in pastures of Palisade grass (Urochloa brizantha cv Marandu) fertilized with 120 kg N ha-1 yr-1 (PG+N) or mixed with forage peanut (Arachis pintoi). Nitrogen accumulation data are the means of three replicate samples (six sub-samples from each paddock), and error bars represent the standard errors of the means.
The grazing experiment was situated on an area of 7.5 ha, which had been deforested in 1995. At that time, the soil was plowed and limed (1200 kg ha-1) and subsequently harrowed and fertilized with 35 kg P ha-1 as single super phosphate (SSP). The area was divided into four blocks with two plots of 9360 m2 each. The plots within each block were randomly allocated to planting either elephant grass (Pennisetum purpureum Schumach cv. Cameroon.) or Palisade grass (Urochloa brizantha Stapf. A. Rich. [Syn. Brachiaria brizantha] cv. Marandu). These pastures were grazed until 2003, when the plots of elephant grass were plowed and limed (1200 kg ha-1) and fertilized with P (35 kg ha-1) as before. The four plots that had been originally in elephant grass were then planted with stolons (200 kg ha-1) of forage peanut (Arachis pintoi Krapov. & W.C. Greg. cv. Belomonte) and seeds of palisade grass (15 kg ha-1). Maintenance fertilization was performed annually over the whole experiment, consisting of 9 kg P and 42 kg K ha-1 as SSP and potassium chloride, respectively. The palisade grass was fertilized with 120 kg N ha-1 yr-1 as urea, but no N fertilizer was added to the mixed pasture. Plots were divided originally into 13 paddocks and rotationally grazed (3 days grazing, 36 days rest) by Nellore beef cattle from July 2005 to August 2006. Subsequently, the plots were divided into six paddocks and rotational grazing was either seven days grazing and 42 days rest or six days grazing and 36 days rest. The forage availability and composition and live weight gain of the cattle grazing these pastures until April 2014 is given in full detail by Pereira et al. (2020). The impact of these pastures on the accumulation of soil carbon was reported by Souza et al. (2023).
Experiment management
The experiment with dairy cattle was initiated in 2015. The pasture treatments continued exactly as before with the two treatments: palisade grass with 2 × 60 kg urea N ha-1 yr-1 (PG+N) and mixed palisade grass-forage peanut pasture (PGFP). Maintenance fertilization continued as before for all plots with 9 kg P ha-1 and 42 kg K ha-1 annually and the N fertilizer to the +N treatment was added in two equal doses of 60 kg N ha-1 each year.
For grazing, two crossbred Girolanda cows were used per plot with live weights ranging between 500 and 600 kg, during lactation. The grazing system adopted was rotational, in the first four months, there were seven days of occupation and 35 days of rest. Subsequently, the system was adjusted to six days of occupation and 30 days of rest. The dry mass (DM) of available green forage was considered for the stocking adjustment. The stocking rate was adjusted to provide animals with fodder corresponding to 4 % of their live weight in DM per day. When the forage supply exceeded the animal demand, heifers of the same breed were included in the paddocks to adjust the stocking rate.
As a result of a severe drought in the region in 2015, in one of the blocks, the stand of the forage peanut was severely affected and did not recover when the rains returned. Because of this, the experiment was conducted in three blocks. Areas adjacent to the 48 paddocks were used to assess the GHG emissions under grazing conditions in degraded pastures (DEG), and to compare the N2O emissions between the systems. This area was also deforested in 1995 and received the same fertilization described above until 2003 when the palisade grass pastures were implanted. After this time, the area was grazed but not fertilized and used as a reserve area to hold cattle that were not used in experimentation. Stocking rate in this area was calculated according to the size of the area and on the same basis of 4 % of animal live weight in DM per day.
Forage DM on offer was determined every 14 days. The samples were taken from the paddocks immediately before the cows entered the first paddock of the next rotation. For collection, a square frame of 1 m2 was used and thrown at random six times in each paddock, and each time, all the forage inside the square was cut to a height of 10 cm, and the fresh weight recorded. In the case of the mixed pastures, the samples were separated into grass and legume and weighed, and a subsample of the legume was removed and weighed. In both treatments, an aliquot of the grass (approximately 2 kg) was removed and divided into senescent material, green leaf and green stem, then a subsample of each fraction was separated, dried (65 °C to constant weight), weighed, and the total green forage DM per ha calculated.
Characterization of dung and urine
Urine and dung were collected fresh from the cows during milking in the early morning of the day the experiment was set up. Approximately 15 kg of fresh dung were well mixed in a container until visually homogeneous. Urine from the different animals was pooled and mixed. Dung and urine samples were taken for analysis, and the remainder was used to evaluate emissions of N2O and NH3 from urine, dung and urea fertilizer as described below.
Concentration of N in the urine was determined on aliquots of 3 mL using the semi-micro Kjeldahl technique followed by steam distillation and titration as described by Bremner and Mulvaney (1983). Samples of the dung were dried at 65 °C (>72 h) and then finely ground using a roller grinder (Arnold and Schepers, 2004). Aliquots of the powdered dung containing 300 to 500 μg C were analyzed for total N and C content and 13C natural abundance with a Finnigan continuous-flow isotope-ratio mass spectrometer, model Delta Plus, in the “John Day Stable Isotope Laboratory” of Embrapa Agrobiologia.
From the 13C abundance, the proportion of C in the dung (%CLeg) derived from the legume can be calculated from the equation 1, established by of Coates et al. (1987).
in which: δ13CG, δ13CL and δ13CS are the values of 13C abundance of the dung collected from the animals fed on pure grass, pure legume and the diet acquired by the animals in the PGFP, respectively.
Evaluation of ammonia volatilization
Fluxes of NH3 and N2O were evaluated in exclusion areas (3.5 × 1.0 m) situated within each plot. The areas were surrounded by wooden stakes and a frame to avoid the entry of animals but allowed them to access the forage within the area without trampling on the chambers.
Within the exclusion areas, a study was conducted to quantify the ammonia volatilized from excreta and the urea fertilizer applied to the soil. The first excreta application was made on August 2, 2018, and the evaluation was conducted for 39 days, totaling 15 collections. The second application of excreta was made on February 23, 2019, with 13 collections over a period of 24 days. The first application of urea fertilizer was made in July 19, 2018, and monitored for 21 days (10 collections). The second application was made on March 22, 2019, and it included 13 collections over a period of 24 days.
Semi-open chambers were used, as described by Araújo et al. (2009), and validated by Jantalia et al. (2012) and Martins et al. (2021). The chambers were made from polyethylene terephthalate (PET) bottles with 2 L volume. The bottle cap was discarded, and the basal part severed. The severed bottom piece was positioned with wires approximately 20 mm above the bottle mouth to shield the contents from rainfall. The chamber formed was 260 mm in length and 100 mm diameter. A wire (25 cm) doubled over at the end was positioned vertically hanging from the mouth of the bottle. A hook hanging from the bottle mouth was used to secure a foam tape 250 mm long, 25 mm wide, and 3 mm thick. The base of this tape was immersed in 10 mL of sulphuric acid 1 mol L-1 amended with 2 % glycerin held in a plastic jar of 60 mL volume, and the foam was moistened with the same solution. Chamber design is illustrated in detail in Jantalia et al. (2012). Each chamber was held in position with a steel rod driven into the ground in the field.
The interior of the exclusion area was divided into two parts: one for evaluating the N2O fluxes and the other for NH3 volatilization. The area defined to evaluate NH3 volatilization was divided into three positions. For each position, a cut PVC tube (collar) with the same internal diameter as the bottle (10 cm) was used to delimit the monitored area. The collar possessed a bevelled end that was inserted into the ground. Within the area bounded by the collar, 0.11 g of urea was applied, corresponding to 60 kg N ha-1. The same procedure was used for the application of urine, with 33 mL inside the collar. However, another collar with a larger diameter (30 cm) was also inserted into the soil, so that they formed two concentric circles and urine was applied in the area between the two collars to avoid its lateral dispersion from the inner area collar. For the installation of the dung patches, a 20 cm diameter ring was used, which delimited the area of the patch. In each treatment, chambers that received no excreta were added to serve as controls for baseline NH3 emissions.
After applying the residues, the foam and the collector were changed daily until completing five days. After this period, the collections were carried out every two days until completing 14 days, when the collections were carried out every three days. The experiment was conducted for 21 days for urea, and for excreta (dung and urine), it was conducted for up to 35 days. At each collection, the foam and the acid solution were removed from the field, a new set placed, and the chamber relocated to a new position. In the case of dung, reallocation occurred in another fraction of the same dung patch. The change in the chamber location aimed to reduce any influence of the chamber on phenomena such as evapotranspiration and precipitation (Martins et al., 2021). After being removed from the field, the foams and collectors were taken in sealed plastic jars to the laboratory of Embrapa Agrobiologia for analysis. A volume of 40 mL of distilled water was used to transfer all the contents of the collectors along with the foam to Erlenmeyer flasks of known weight. The vials were transferred to a shaking table for 20 min at 220 rpm and weighed again. The weight of the solution was determined by difference. Volatilized NH3 quantification was performed by determining the concentration of NH4+ using the modified Berthelot reaction with sodium salicylate reagent, as described by Kempers and Zweers (1986). For each period, volatilized NH3 was calculated from the product of the NH4+-N concentration, and the volume of the solution multiplied by the correction factor of 1.74, determined by Martins et al. (2021). For each excreta type and the urea, the volatilized NH3-N during the same period from the control area with no excreta or urea was debited, and the total volatilization was determined by adding all values during the whole period of collection.
Results of ammonia volatilization and nitrous oxide emissions from dung and urine were expressed in mass of N emitted per chamber, which is the emission from individual urine or dung patches. Thus, the emission is based on the mass of excreta N within the chamber and not the area. To present the results per m2, as has been practiced by many authors (e.g., Allen et al., 1996; Sordi et al., 2013; Lessa et al., 2014), may give rise to the idea that cattle spread their excreta uniformly over areas as large as 1 m2, and may lead to extrapolation of the emissions to per hectare, which will grossly overestimate NH3 or N2O emissions. As the N fertilizer (urea) was spread evenly over the whole area of the paddocks, the NH3 and N2O emissions from this source were presented per m2 and as a proportion of the fertilizer N.
Evaluation of nitrous oxide emissions
Nitrous oxide emissions from the excreta and urea fertilizer were also assessed within the exclusion areas. The first application of excreta was made on August 01, 2018 and the evaluations were conducted for 175 days, totaling 29 samplings. The second application was made on February 22, 2019, and the evaluations were conducted over 202 days, totaling 40 samples. The area defined for evaluating N2O from cattle excreta comprised three chambers in each treatment (PGFP, PG+N, DEG). In each exclusion area, chamber bases (0.40 × 0.60 m) were installed. One did not receive any type of addition, another received 1 kg of fresh dung, and the third received 1 L of urine. In the PG+N treatment, in addition to chambers for the control, dung and urine, the exclusion areas received an additional chamber, which constituted the fertilized treatment, with the application of 3.2 g of urea per chamber of (60 kg N ha-1). The applied excreta were collected from the animals, separated by treatment, homogenized, and applied in their respective areas.
Emissions of N2O derived from the application of urea and bovine excreta were evaluated for one year. During this period, there were two applications of urea in the PG+N treatment: the first application was made on July 19, 2018 and the second on March 22, 2019. For the evaluation of emissions from the bovine excreta, the urine and cow dung were applied on August 02, 2018 and February 22, 2019. Emissions from fertilizer and excreta were monitored until September 2019. As soon as the treatments were applied in the field, the gas flux monitoring was started and carried out for seven consecutive days, after which the fluxes were measured 3 times a week until completing 30 days after application (DAA) when fluxes were measured twice a week until completing 60 DAA. From that point on, monitoring occurred once a week until 90 DAA, when the frequency of monitoring was once every 15 days until the next application or until the end of the study.
To assess N2O emissions, static chambers were used, as described by de Morais et al. (2013). The chambers consisted of a rectangular metal base, 40 × 60 cm, in the shape of a hollow box, with the walls inserted into the ground at a depth of 10 cm. The part of the base exposed at the soil surface had a trough (2.0 cm wide × 2.0 cm high), into which the chamber cover fitted. The cover had the same dimensions as the base, but with walls 24 cm high. The bases were levelled at the time of insertion into the soil and remained in the area until the end of the gas monitoring to avoid soil disturbance. The cover was only attached to the base when sampling the gases. Each cover was covered with foam and an adhesive mat with a reflective surface (aluminium foil) to reduce the effect of solar radiation on the internal temperature of the chamber during gas sampling. The gas collection inside the chamber was carried out through a quadruple “spider” array of tubing (~3.2 mm diameter) located in the central part at the top of the chamber. Before the sampling, the trough was filled with water to guarantee the sealing of the chamber. When fitting the lid to the base of the chamber, sampling was performed at time zero and subsequently at 20, 40 and 60 min of incubation.
The gas samples were removed from the chambers using 60 mL syringes equipped with 3-way Leur-Lock® valves. Approximately 40 mL of the gas inside the chamber was sampled, of which 10 mL was used to flush the transfer system, and the remainder was transferred to pre-evacuated 20 mL chromatography vials (Exetainers® - Labco, Lampeter, Wales, UK) sealed with butyric rubber septa. For transfer, the vials were evacuated to approximately 100 kPa. Sampling was carried out between 08:00 and 10:00 h, when there is a high probability that the measured flow represents the average daily flow (Alves et al., 2012).
The analyses of N2O concentrations were performed in the Gas Chromatography Laboratory of Embrapa Agrobiologia, using a gas chromatograph (Shimadzu GC 2014) equipped with a “Porapak Q” column with a back-flush system (Alves et al., 2012) and an electron capture detector (ECD) for the quantification of N2O. The N2O and fluxes (µg N2O-N h-1) were calculated using equation 2.
in which: ΔC.Δt-1 is the change in gas concentration in the chamber in the incubation interval (Δt); V and A are, respectively, the chamber volume (m-3) and the soil area covered by the chamber (m-2); M is the molecular weight of the gas; and V is the molecular volume of N2O at the sampling temperature. After calculating the fluxes, the emissions for the monitoring period adopted in the experiment were estimated using the Newton-Coates numerical integration technique rectangle method (Equation 3).
in which: f(x) is the average flux obtained from the fluxes of the day before (a) and (b) the next day when measurements were made in the field.
The emission factor (EF) for N2O from each residue was calculated according to the equation 4.
in which: N2Otrat represents the total N2O emission from the residue (urea; urine; dung); N2OCtrl, the total N2O emission from the control; and Ntotal, the total N applied as urea, urine, or dung.
Statistical analysis
Data were subjected to normality of residuals (Shapiro-Wilk) and homogeneity of variances (Bartlett) tests. When they did not meet the assumptions for carrying out the analysis of variance, they were transformed using the logarithmic transformation and subjected to the LSD means comparison test at a significance level of 5 % using the R software (R Development Core Team, 2019).
RESULTS
Ammonia volatilization from excreta
The volume of urine or mass of fresh dung was the same for each treatment. However, as N concentration and in the case of dung, % moisture also, were different, the amounts of N applied per chamber in the urine and dung differed between treatments and applications (Table 1). In the second application, the amount of N applied was lower in all treatments compared to the first. The lower N concentration in the excreta at this second application is due to the lower forage DM and N consumption, which was limited by a long period of drought that compromised the growth and accumulation of forage mass and nutrients (Figure 1).
Quantities of N applied in the form of urine and dung to the soil surface for the quantification of ammonia volatilization in the degradedpasture (DEG), N fertilized palisade grass PG+N), and a mixed palisade grass/forage peanut pasture (PGFP) in the two evaluation periods – August 2018 and February 2019
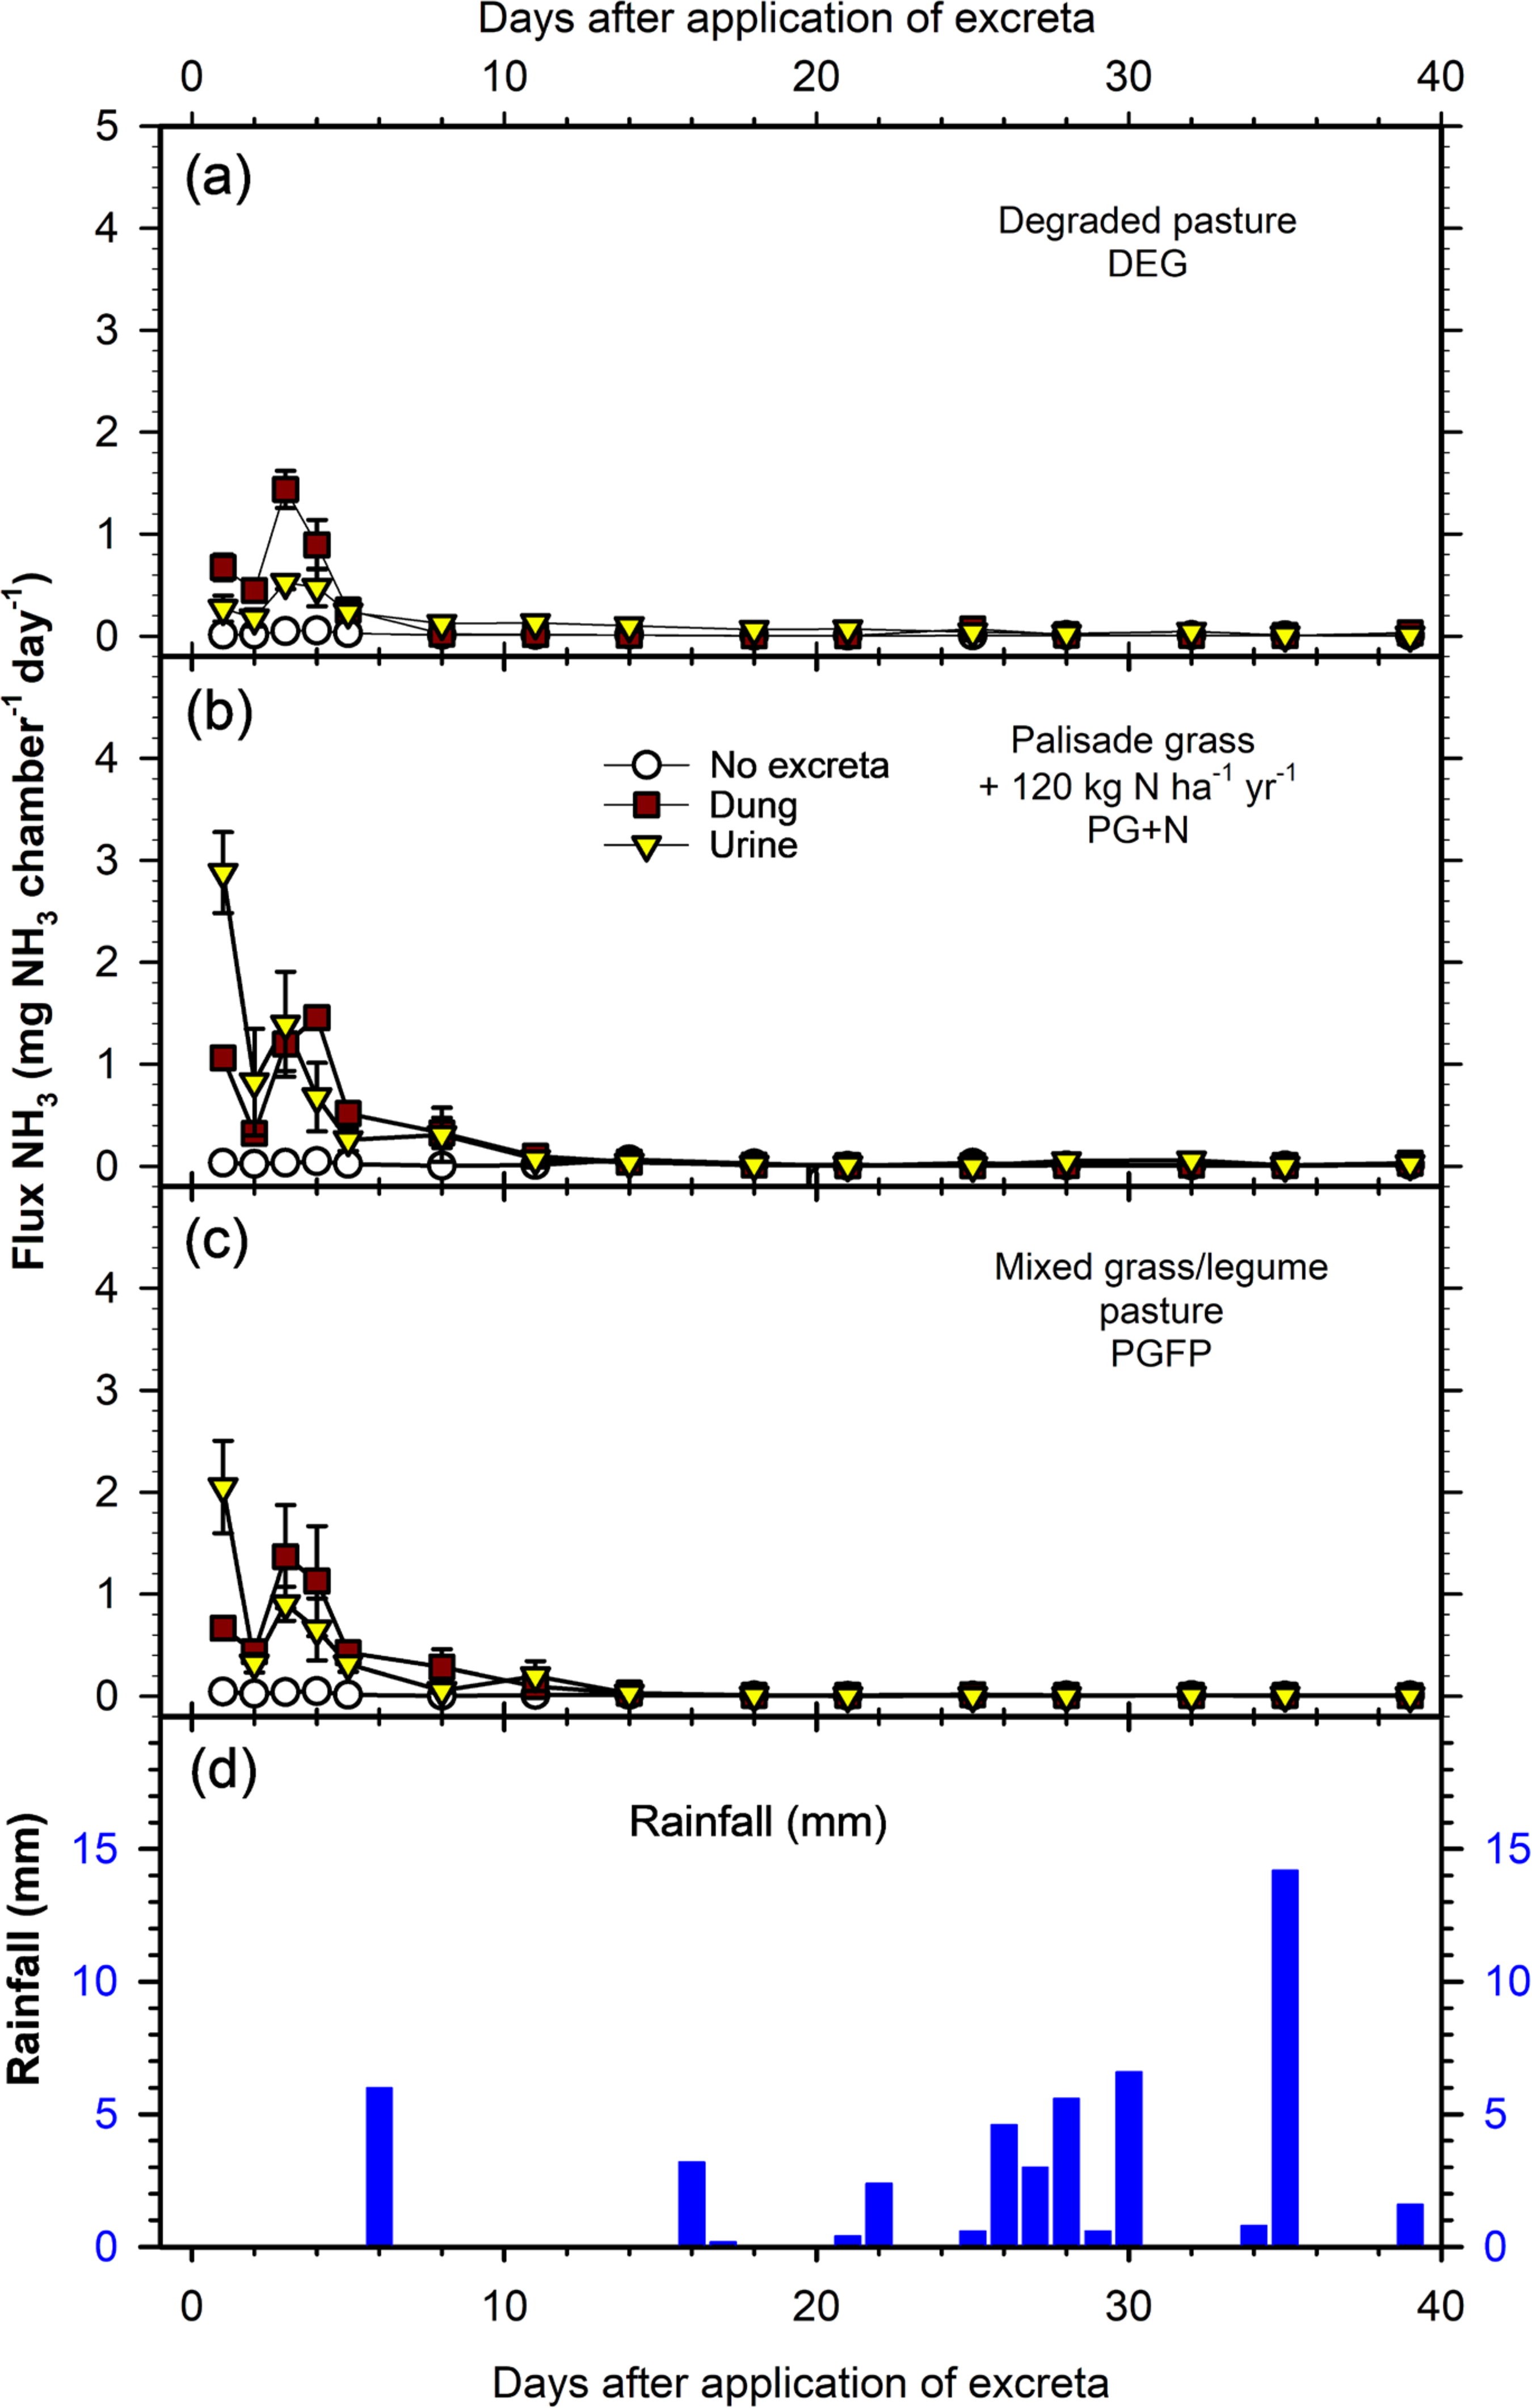
At the first evaluation of NH3 volatilization, there was only 0.6 mm of rainfall in the seven days before the excreta application, but in the week before that, there was a total of 26 mm. For the urine derived from the PG+N and PGFP treatments, there was a large emission in the first 24 h, amounting, respectively, to 39 and 36 % of all NH3 volatilized over the whole 39-day period of monitoring (Figure 2). The loss of NH3 from the dung attained a maximum daily rate three to four days after the application (DAA), such that by five DAA between 73 and 85 % of all loss had occurred.
Volatilization flux of ammonia (mg NH3-N chamber-1 day-1) from urine and dung taken from dairy cattle grazing pastures of Palisade grass (Urochloa brizantha cv Marandu) and from control areas where no excreta was applied. (a) degraded pasture (DEG); (b) fertilized with 120 kg N ha-1 yr-1 (PG+N); and (c) mixed with forage peanut (Arachis pintoi). First application of excreta: August 02, 2018. Daily rainfall and % water-filled pore space (%WFPS) are displayed in figure 2d. Data are means of three replicates, and error bars represent the standard errors of the means.
At the second evaluation, there was 8.1 mm of rainfall seven days before applying the excreta. Once again, for the urine in the PG+N and PGFP treatments there was a large emission in the first 24 h, amounting to 58 and 33 %, respectively, of the total NH3 loss in the 28-day monitoring period (Figure 3). Emissions from dung and urine after five DAA were low; by this time, 58 and 85 % of all volatilization had occurred.
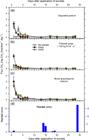
Volatilization flux of ammonia (mg NH3-N chamber-1 day-1) from urine and dung taken from dairy cattle grazing pastures of Palisade grass (Urochloa brizantha cv Marandu) and from control areas where no excreta was applied. (a) degraded pasture (DEG); (b) fertilized with 120 kg N ha-1 yr-1 (PG+N); and (c) mixed with forage peanut (Arachis pintoi). Second application of excreta: February 23, 2019. Daily rainfall and % water-filled pore space (%WFPS) are displayed in figure 3d. Data are means of three replicates and error bars represent the standard error of the means.
It would appear from the data displayed in figures 2 and 3, that emissions of NH3 from urine and dung were of similar magnitude. However, the amount of N per unit area added to the soil surface as dung was, on average, 3.8 and 5.1 times higher than that added as urine for the first and second evaluation periods, respectively (Table 1). Results of the NH3 emissions displayed in table 2 are expressed as a fraction of the N applied to the soil surface, and the emissions from the control areas (no excreta added) were deducted. The fraction of N volatilized from urine was significantly higher than that from dung at both evaluations. For evaluation period 1, the NH3 volatilization rates were between 3.4 and 4.6 times higher for urine and, at the second evaluation, between 3.2 and 10.3 times higher for urine than for dung.
The emission of NH3 (mg NH3-N mg excreta N-1) from urine was generally higher during the second evaluation than the first. This may be due to the higher soil temperature at this time of year (28 °C versus 22 °C), but the difference in the emissions was not statistically significant (p = 0.23).
The amount of NH3-N emitted in relation to the total N content of the excreta (Emission Factor - EF), did not differ statistically for the interaction excreta × time of application, so only the simple effects of the factors were analyzed. Although the mean EF of the first application for the urine was lower than in the second application (Table 2), 2.8 and 4.7 %, respectively, they were statistically similar (p = 0.22).
Percentage of N volatilized as NH3 of urine and dung from dairy cattle grazing degraded pasture (DEG), N fertilized palisade grass (PG+N), and a mixed palisade grass/forage peanut pasture (PGFP). Data from two monitoring periods starting on August 02, 2018 (39 days) and February 23, 2019 (29 days)
Ammonia volatilization from urea fertilizer
The amount of NH3-N volatilized from the control area (no added N fertilizer) in the first and second applications was 0.13 ± 0.02 and 0.41 ± 0.03 kg N-NH3 ha-1, respectively. In the first application, 66 % of the NH3 volatilization occurred within two DAA; from that point on, the loss was similar to that of the control area and rarely exceeded 0.05 kg N-NH3 ha-1 day-1 (Figure 4a). In the second application, the behavior of the volatilization flux was somewhat different; the NH3 flux peaked on the second day, but after seven days, the fluxes were very similar to the control (Figure 4b). In the first 48 h (two DAA), 34% of the loss occurred, and only at seven DAA, the NH3 loss reach 67 %. The peaks in the first DAAs may indicate intense urease activity in this period since urea needs to be hydrolyzed for NH3 volatilization to occur.

Daily rainfall (mm) and soil moisture (%) at the first application (a) and at the second application (b) of 60 kg N ha-1 of urea fertilizer. The daily rate of NH3 loss (kg NH3-N ha-1 day-1) for the first and second applications of urea fertilizer are displayed in figures 4c and 4d, respectively. Data are means of three replicates, and error bars represent the standard errors of the means.
The amount of NH3-N emitted by urea did not differ statistically between the two application times. Discounting the emissions from the control, it was estimated that, at the first urea application, 1.18 ± 0.18 kg N ha-1 of the fertilizer was lost via NH3 volatilization, representing 1.97 % (± 0.31) of the applied N. In the second application, the loss was 1.50 ± 0.36 kg NH3-N ha-1, representing 2.50 % (± 0.60) of the applied N.
Nitrous oxide emissions from animal excreta
The time of application influenced the amount of N in the excreta, such that, for both urine and dung, the amount of N applied in the second application was lower when compared to the amount of N at the first application (p<0.01 - Table 3). At the first application, the amount of N applied as dung was less than that applied as urine in all treatments. However, in the second application, the N in the urine of the PG+N treatment was similar to the amount applied as dung in the PGFP and DEG treatments.
Quantities of N applied in the form of urine and dung to the soil surface for the evaluation of nitrous emissions in the three pasture systems in two evaluation periods starting in August 2018 and February 2019, respectively
The difference in the amount of N between the periods of application can be explained by the low availability of forage at the time of excreta collection for the second application, as explained in the assessment of NH3 volatilization, where other aliquots of the same dung and urine samples were used but applied to areas of different size.
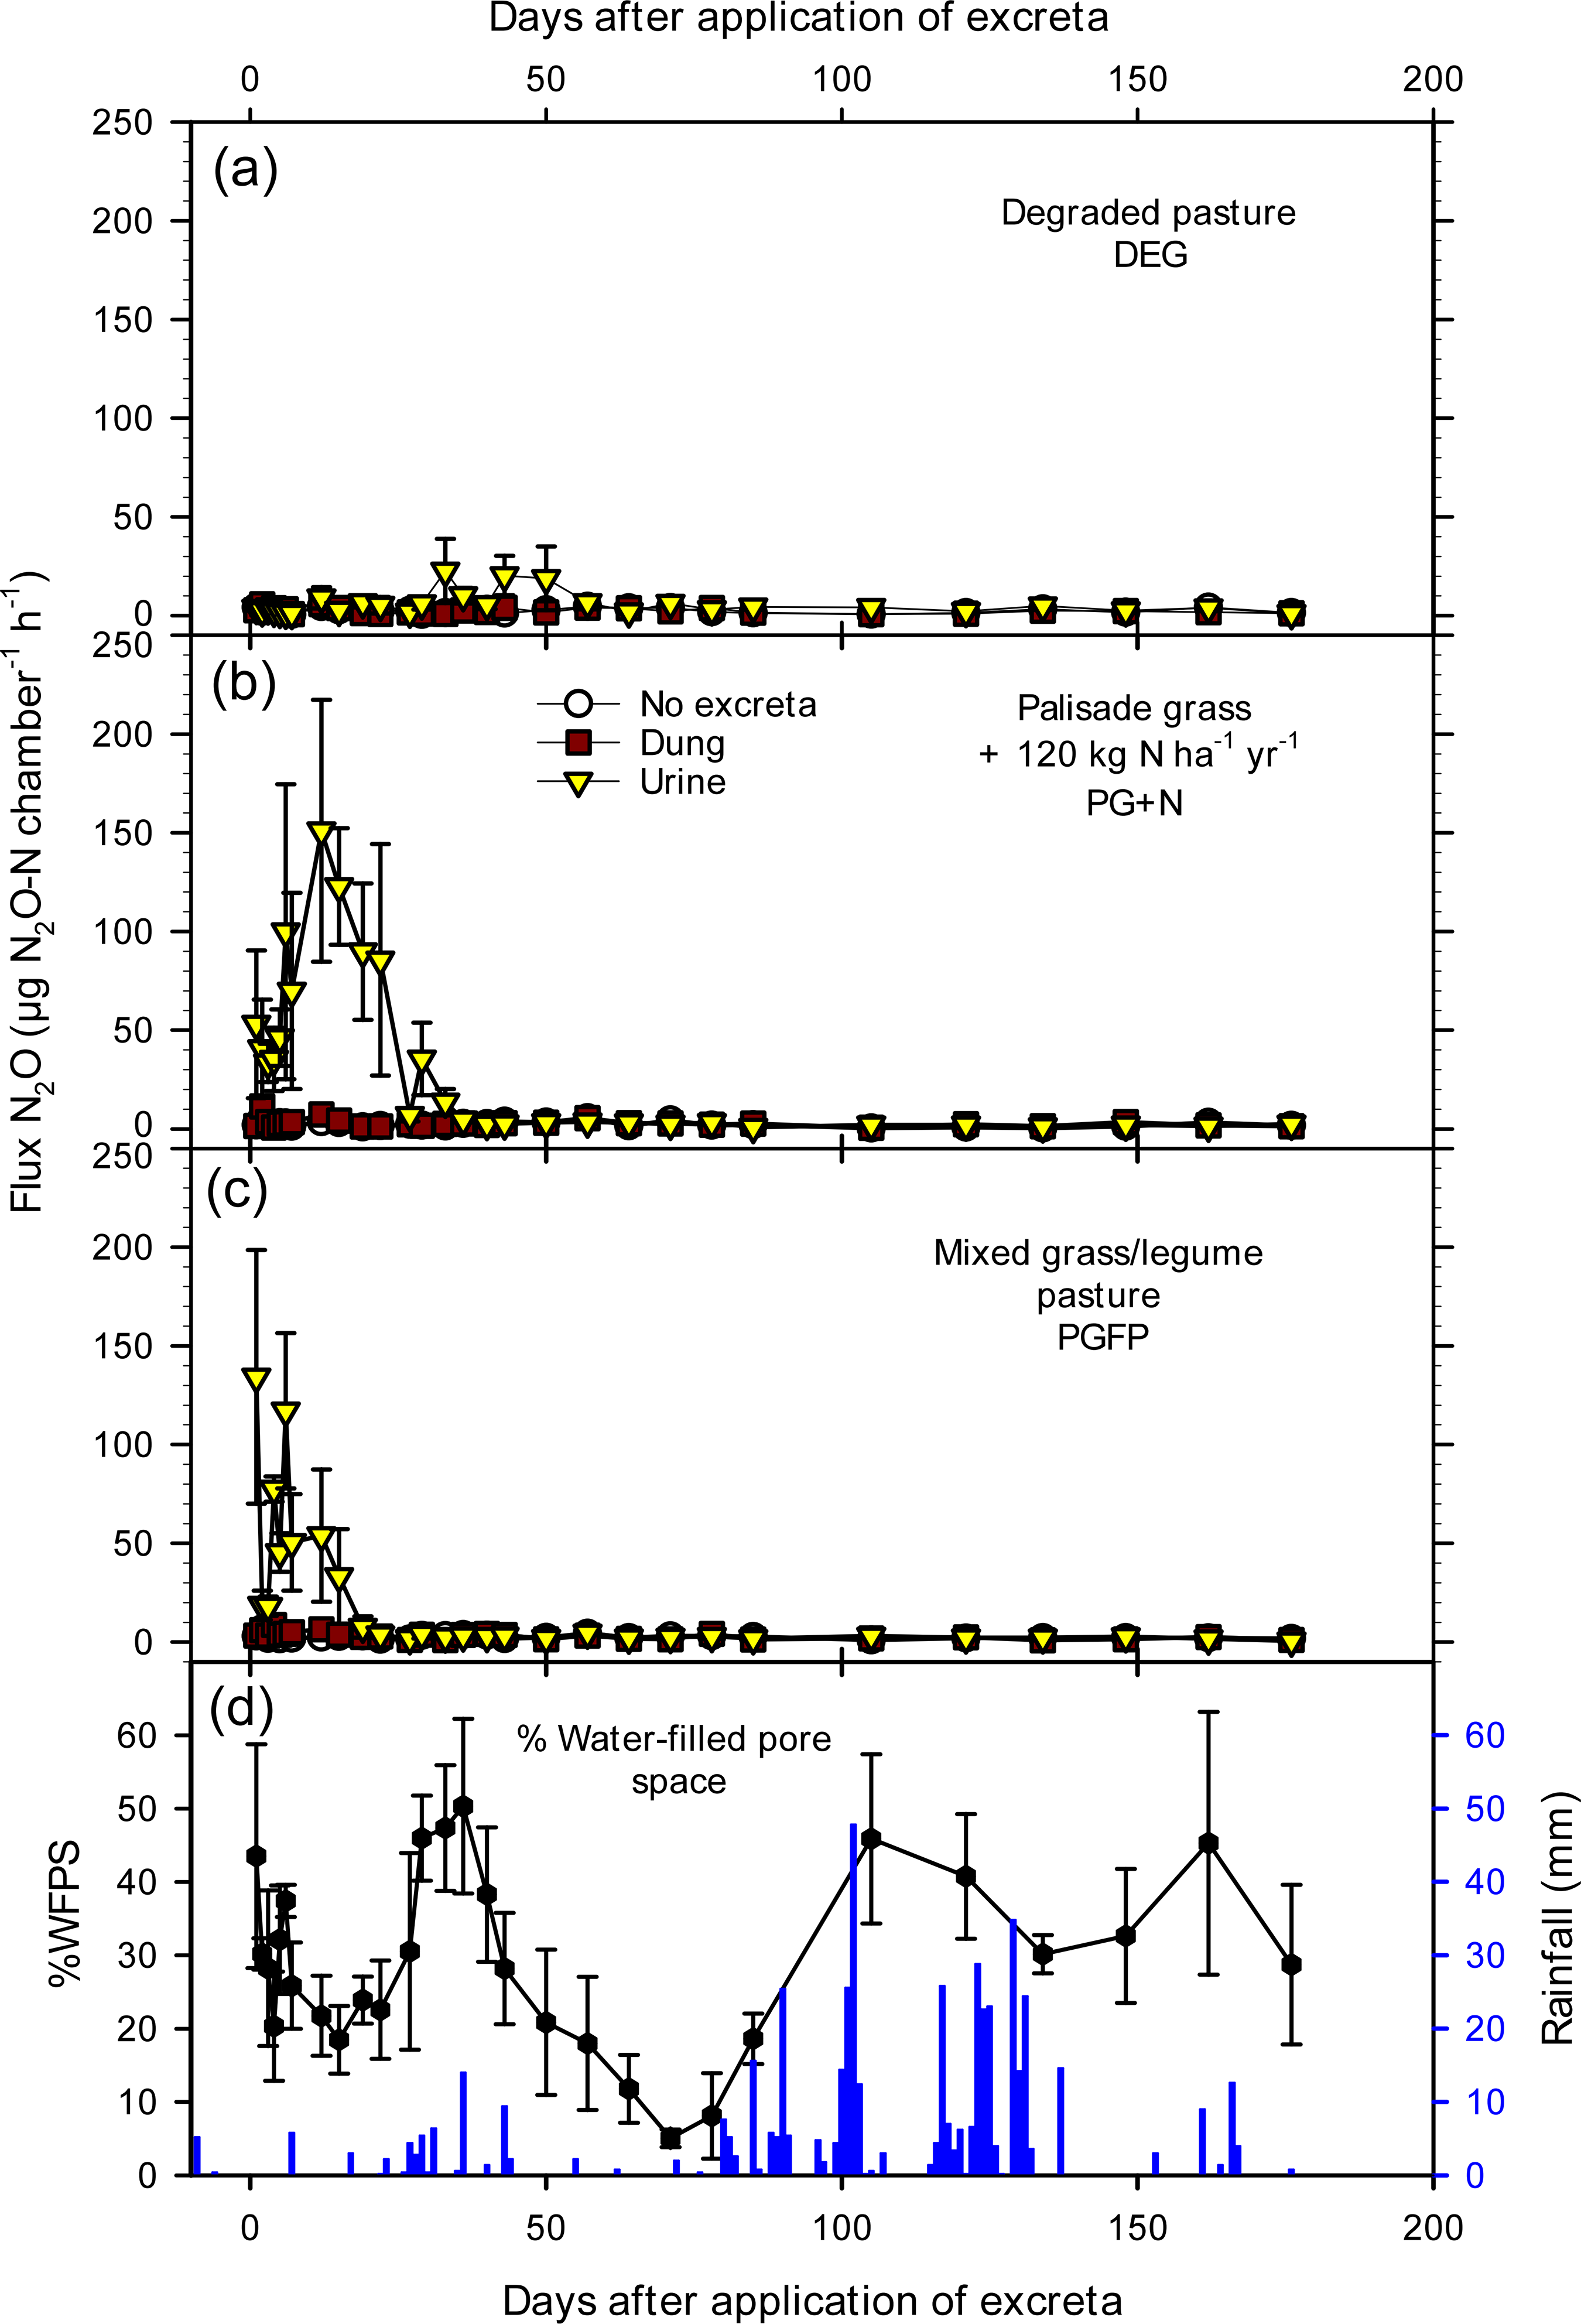
During the first monitoring period, the control areas with no excreta had peak emissions of 4.6, 5.7 and 6.6 µg N2O-N chamber-1 h-1 for the DEG, PG+N and PGFP treatments, respectively (Figure 5). In the DEG treatment, the dung application did not increase N2O emissions above those of the control areas; the highest peak of N2O emission recorded was 5.8 µg N2O-N chamber-1 h-1. In the treatments PG+N and PGFP, the application of dung increased the emission peaks to 11.4 and 8.6 µg N2O-N chamber-1 h-1, respectively, these maxima being observed within the first 4 DAA.

Nitrous oxide emissions (µg N2O-N chamber-1 h-1) from urine and dung taken from dairy cattle grazing pastures of Palisade grass (Urochloa brizantha cv Marandu) and from control areas where no excreta was applied. (a) degraded pasture (DEG) or (b) fertilized with 120 kg N ha-1 yr-1 (PG+N) or (c) mixed with forage peanut (Arachis pintoi). First application of excreta: August 02, 2018. Daily rainfall and % water-filled pore space (%WFPS) are displayed in figure 5D. Data are means of three replicates and error bars represent the standard errors of the means.
The flux of N2O from the urine of the DEG treatment showed a different behavior to other treatments; the peak emission in the DEG treatment occurred at 33 DAA, reaching 22.7 µg N-N2O chamber-1 h-1, and lasted up to 50 DAA. In contrast, the emission peak of the treatment for PG+N was of greater magnitude and occurred soon after the application between 1 and 29 DAA, with the highest peak of 151.0 µg N-N2O chamber-1 h-1 occurring 12 DAA. In the PGFP treatment, the effect of urine application was shorter, lasting up to 15 DAA, the highest emission peak was 134.3 µg N-N2O chamber-1 h-1 and occurred on the first DAA (Figure 5).
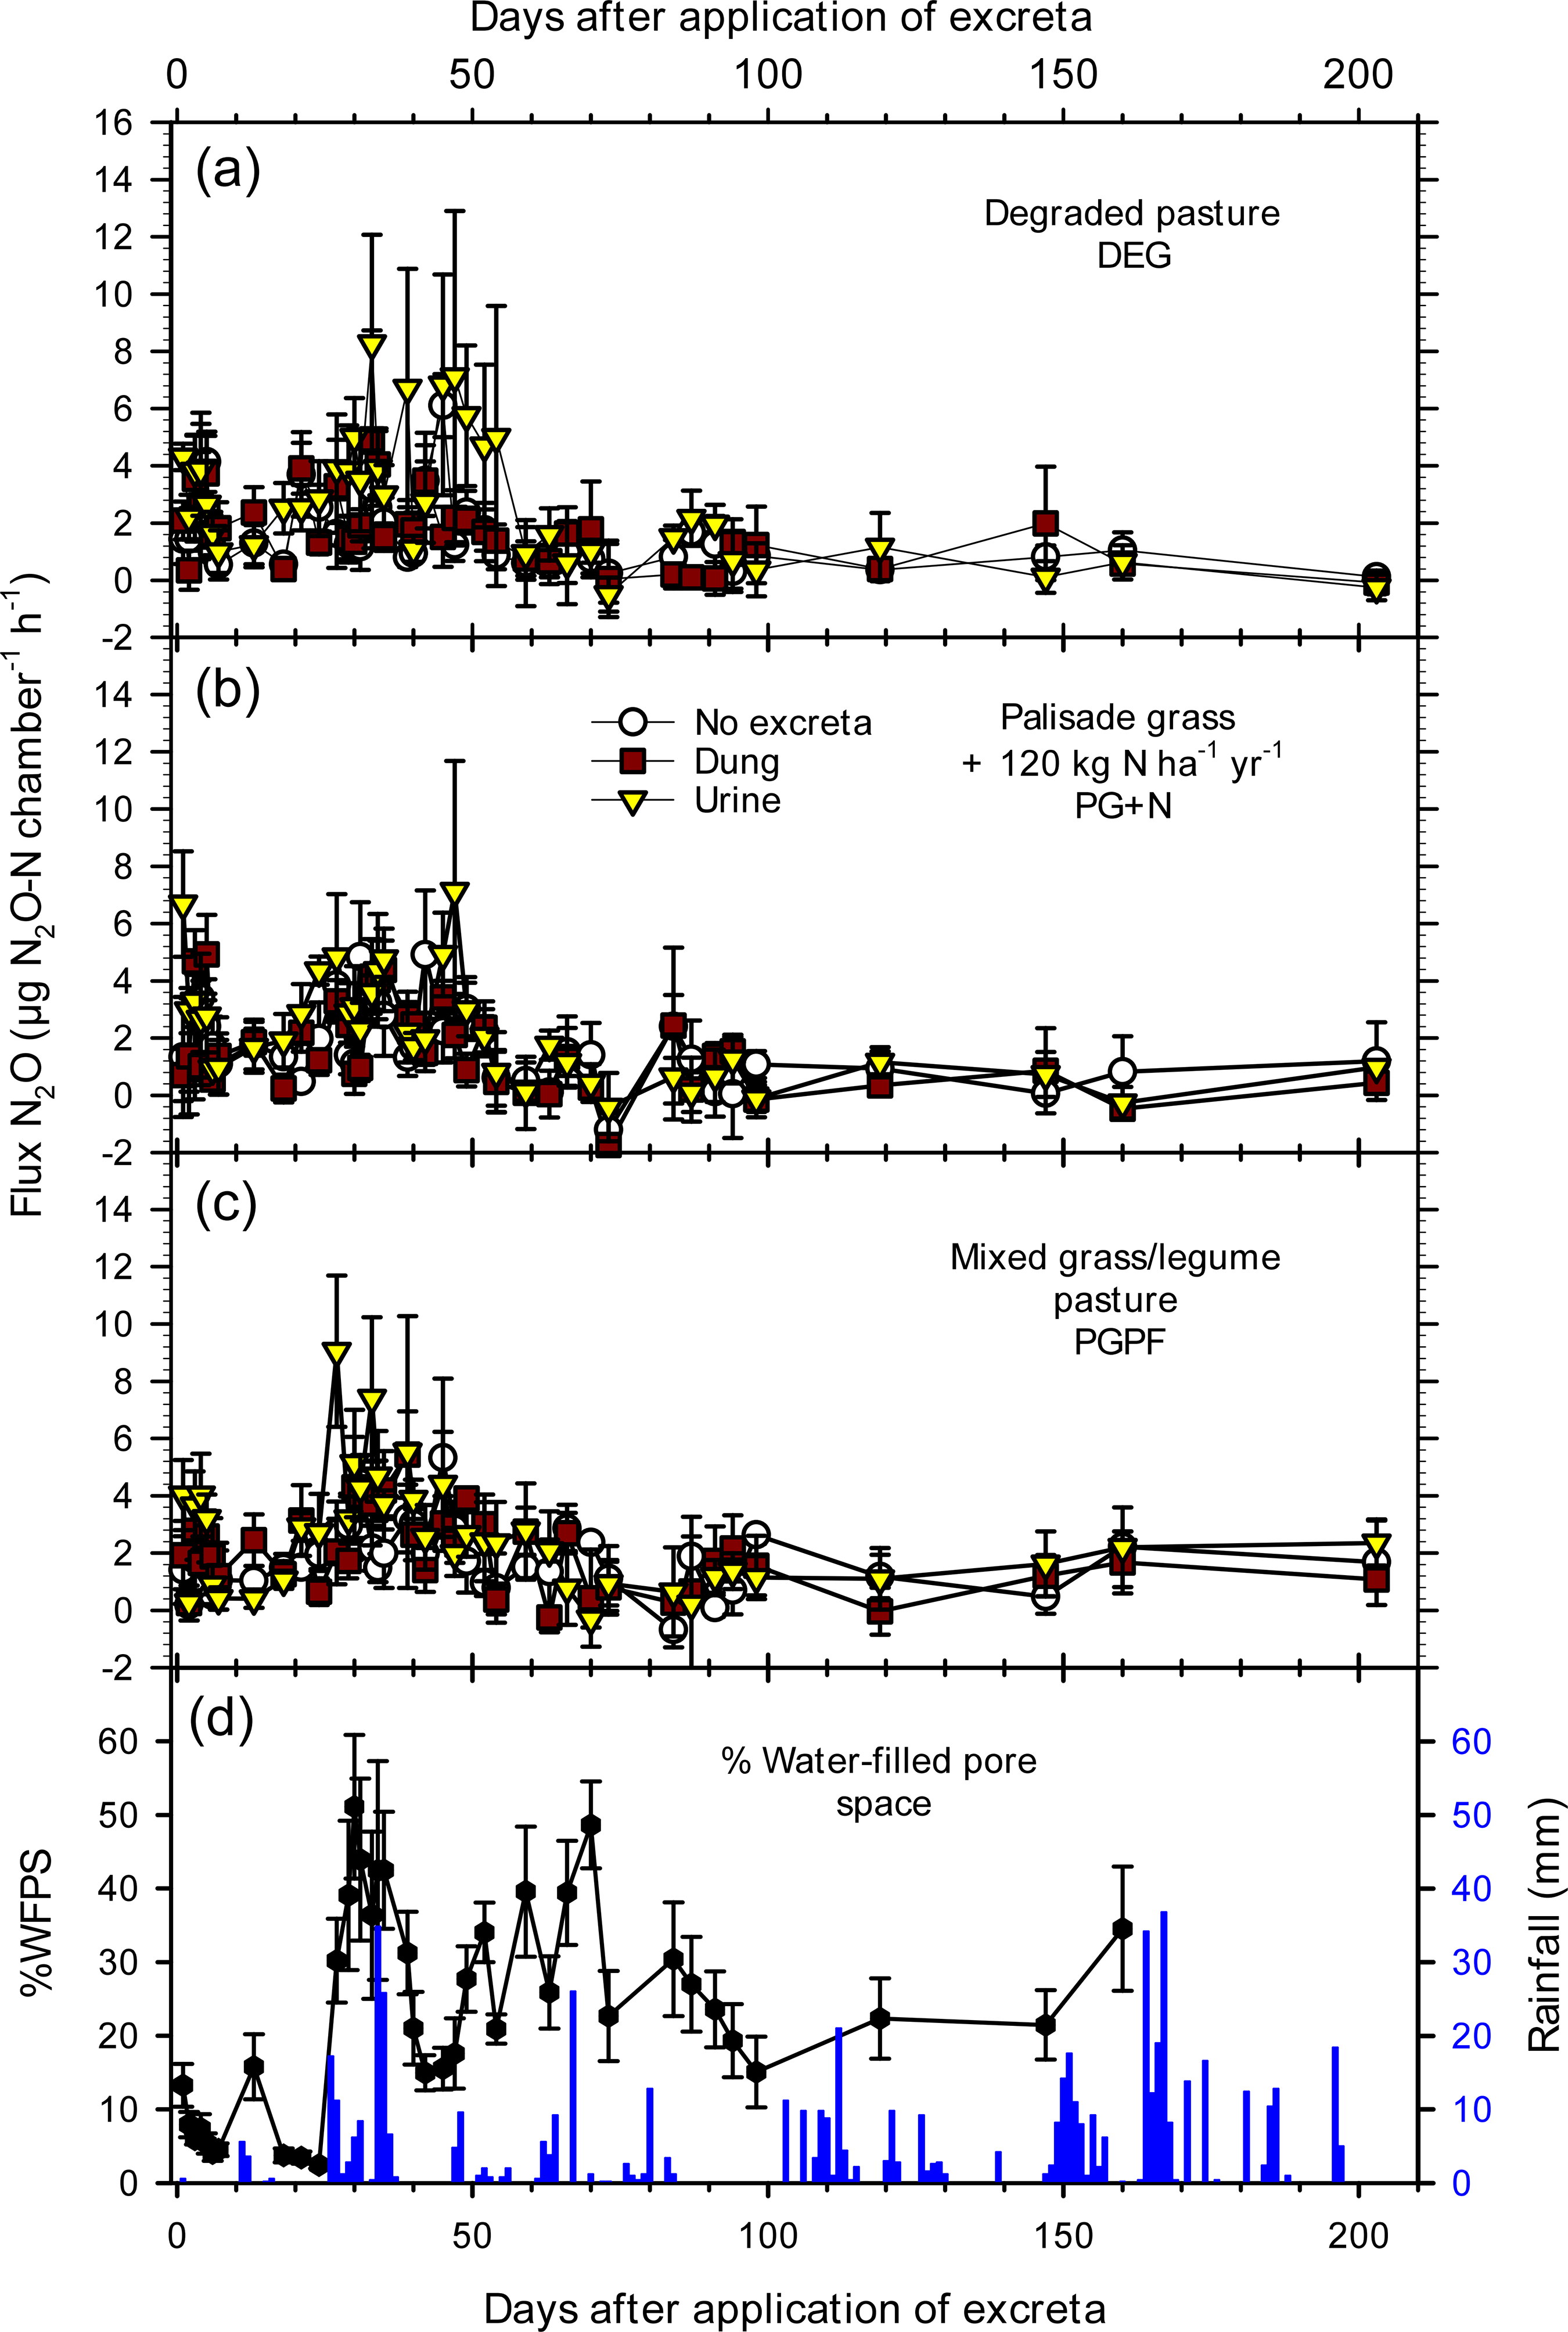
In the evaluation of the second monitoring period, the peaks of N2O emission from the control areas were similar to those of the first: 6.1, 4.9 and 5.3 µg N2O-N chamber-1 h-1 in DEG, PG+N and PGFP, respectively (Figure 6). However, the emissions of N2O from both dung and urine were much lower than for the first application. Emissions from dung in the DEG, PG+N and PGFP treatments had peaks of 4.9, 4.9 and 5.4 µg N-N2O chamber-1 h-1, respectively. For urine, an increase in emissions was observed up to 5 DAA in all three pastures, but the fluxes returned to control emission levels. However, after significant rainfall (68 mm) from 33 to 36, DAA emissions increased again but did not exceed 8.3, 7.1, and 9.1 µg N-N2O chamber-1 h-1, for the DEG, PG+N and PGFP treatments, respectively. After that, fluxes were not greater than the background emissions (Figure 6).

Nitrous oxide emissions (µg N2O-N chamber-1 h-1) from urine and dung taken from dairy cattle grazing pastures of Palisade grass (Urochloa brizantha cv Marandu) and from control areas where no excreta was applied. (a) degraded pasture (DEG); (b) fertilized with 120 kg N ha-1 yr-1 (PG+N); (c) mixed with forage peanut (Arachis pintoi). Second application of excreta: February 23, 2019; and (d) Daily rainfall and % water-filled pore space (%WFPS). Data are means of three replicates and error bars represent the standard error of the means.
Nitrous oxide emissions from the excreta were strongly affected by application time, with fluxes markedly lower in the second application (Figures 5 and 6). The precipitation regime during the monitoring of fluxes and alteration of the pore space filled by water (%WFPS) can help understand the emissions dynamics. Three months after excreta first application, the %WFPS of the soil reached a maximum of 50 % at 36 DAA after 15 mm of rainfall (Figure 5). Prior to this, the %WFPS remained below 40 %. Heavier rainfall was experienced at 89-91 DAA (36 mm) and from 99 to 103 DAA (total 105 mm), but by this time, there was probably minimal residual mineral N present to be reduced to N2O.
On the first day of the second excreta application, the %WFPS of the DEG, PG+N and PGFP areas were 18.3, 38.8, and 30.8 %, respectively (Figure 6b). The greatest accumulated N2O emissions were recorded for urine, especially for the first application when rainfall and %WFPS were high soon after the excreta application (Table 4).
Nitrous oxide emitted from the control area and from the urine and dung of cattle grazing degraded pasture (DEG), N fertilized palisade grass (PG+N), and a mixed palisade grass/forage peanut pasture (PGFP) applied to the soil. Data are the total emissions from two sampling periods: August 2018 (1st application – 176 d) and February 2019 (2nd application – 203 d)
At the first application, the urine deposited by cattle grazing the degraded (DEG) pasture was 17 % lower in N content than that deposited in the PG+N and PGFP treatments (Table 3), which explains why the total N2O emission from the PG+N and PGFP were higher; 2.8 and 1.4 times higher, respectively (Table 4). At the second application, the total N2O emissions from the urine were an order of magnitude lower than at the first application, and there was no significant effect of pasture type. The N2O emissions from the dung were not significantly greater (p<0.05) than those of the control area.
Emission factors for the dung at both applications were low, ranging from 0.01 to 0.11 %, as were those from the urine at the second application (Table 5). Owing to the higher soil moisture (%WFPS), emission factors for urine at the first application were higher, at 0.30 and 0.35 % for the degraded (DEG) and mixed pasture (PGFP), respectively, to 0.94 % PG+N pasture. This latter value is close to the default value of 1 % in the revised guidelines of the IPCC (2019).
Proportion (%) of N lost from dung and urine deposited on the soil as N2O emissions applied to the soil in degraded pasture (DEG), N fertilized palisade grass (PG+N) and a mixed palisade grass/forage peanut pasture (PGFP). Data are from two sampling periods: August 2018 (1st application) and February 2019 (2nd application)
Nitrous oxide emissions from urea fertilizer
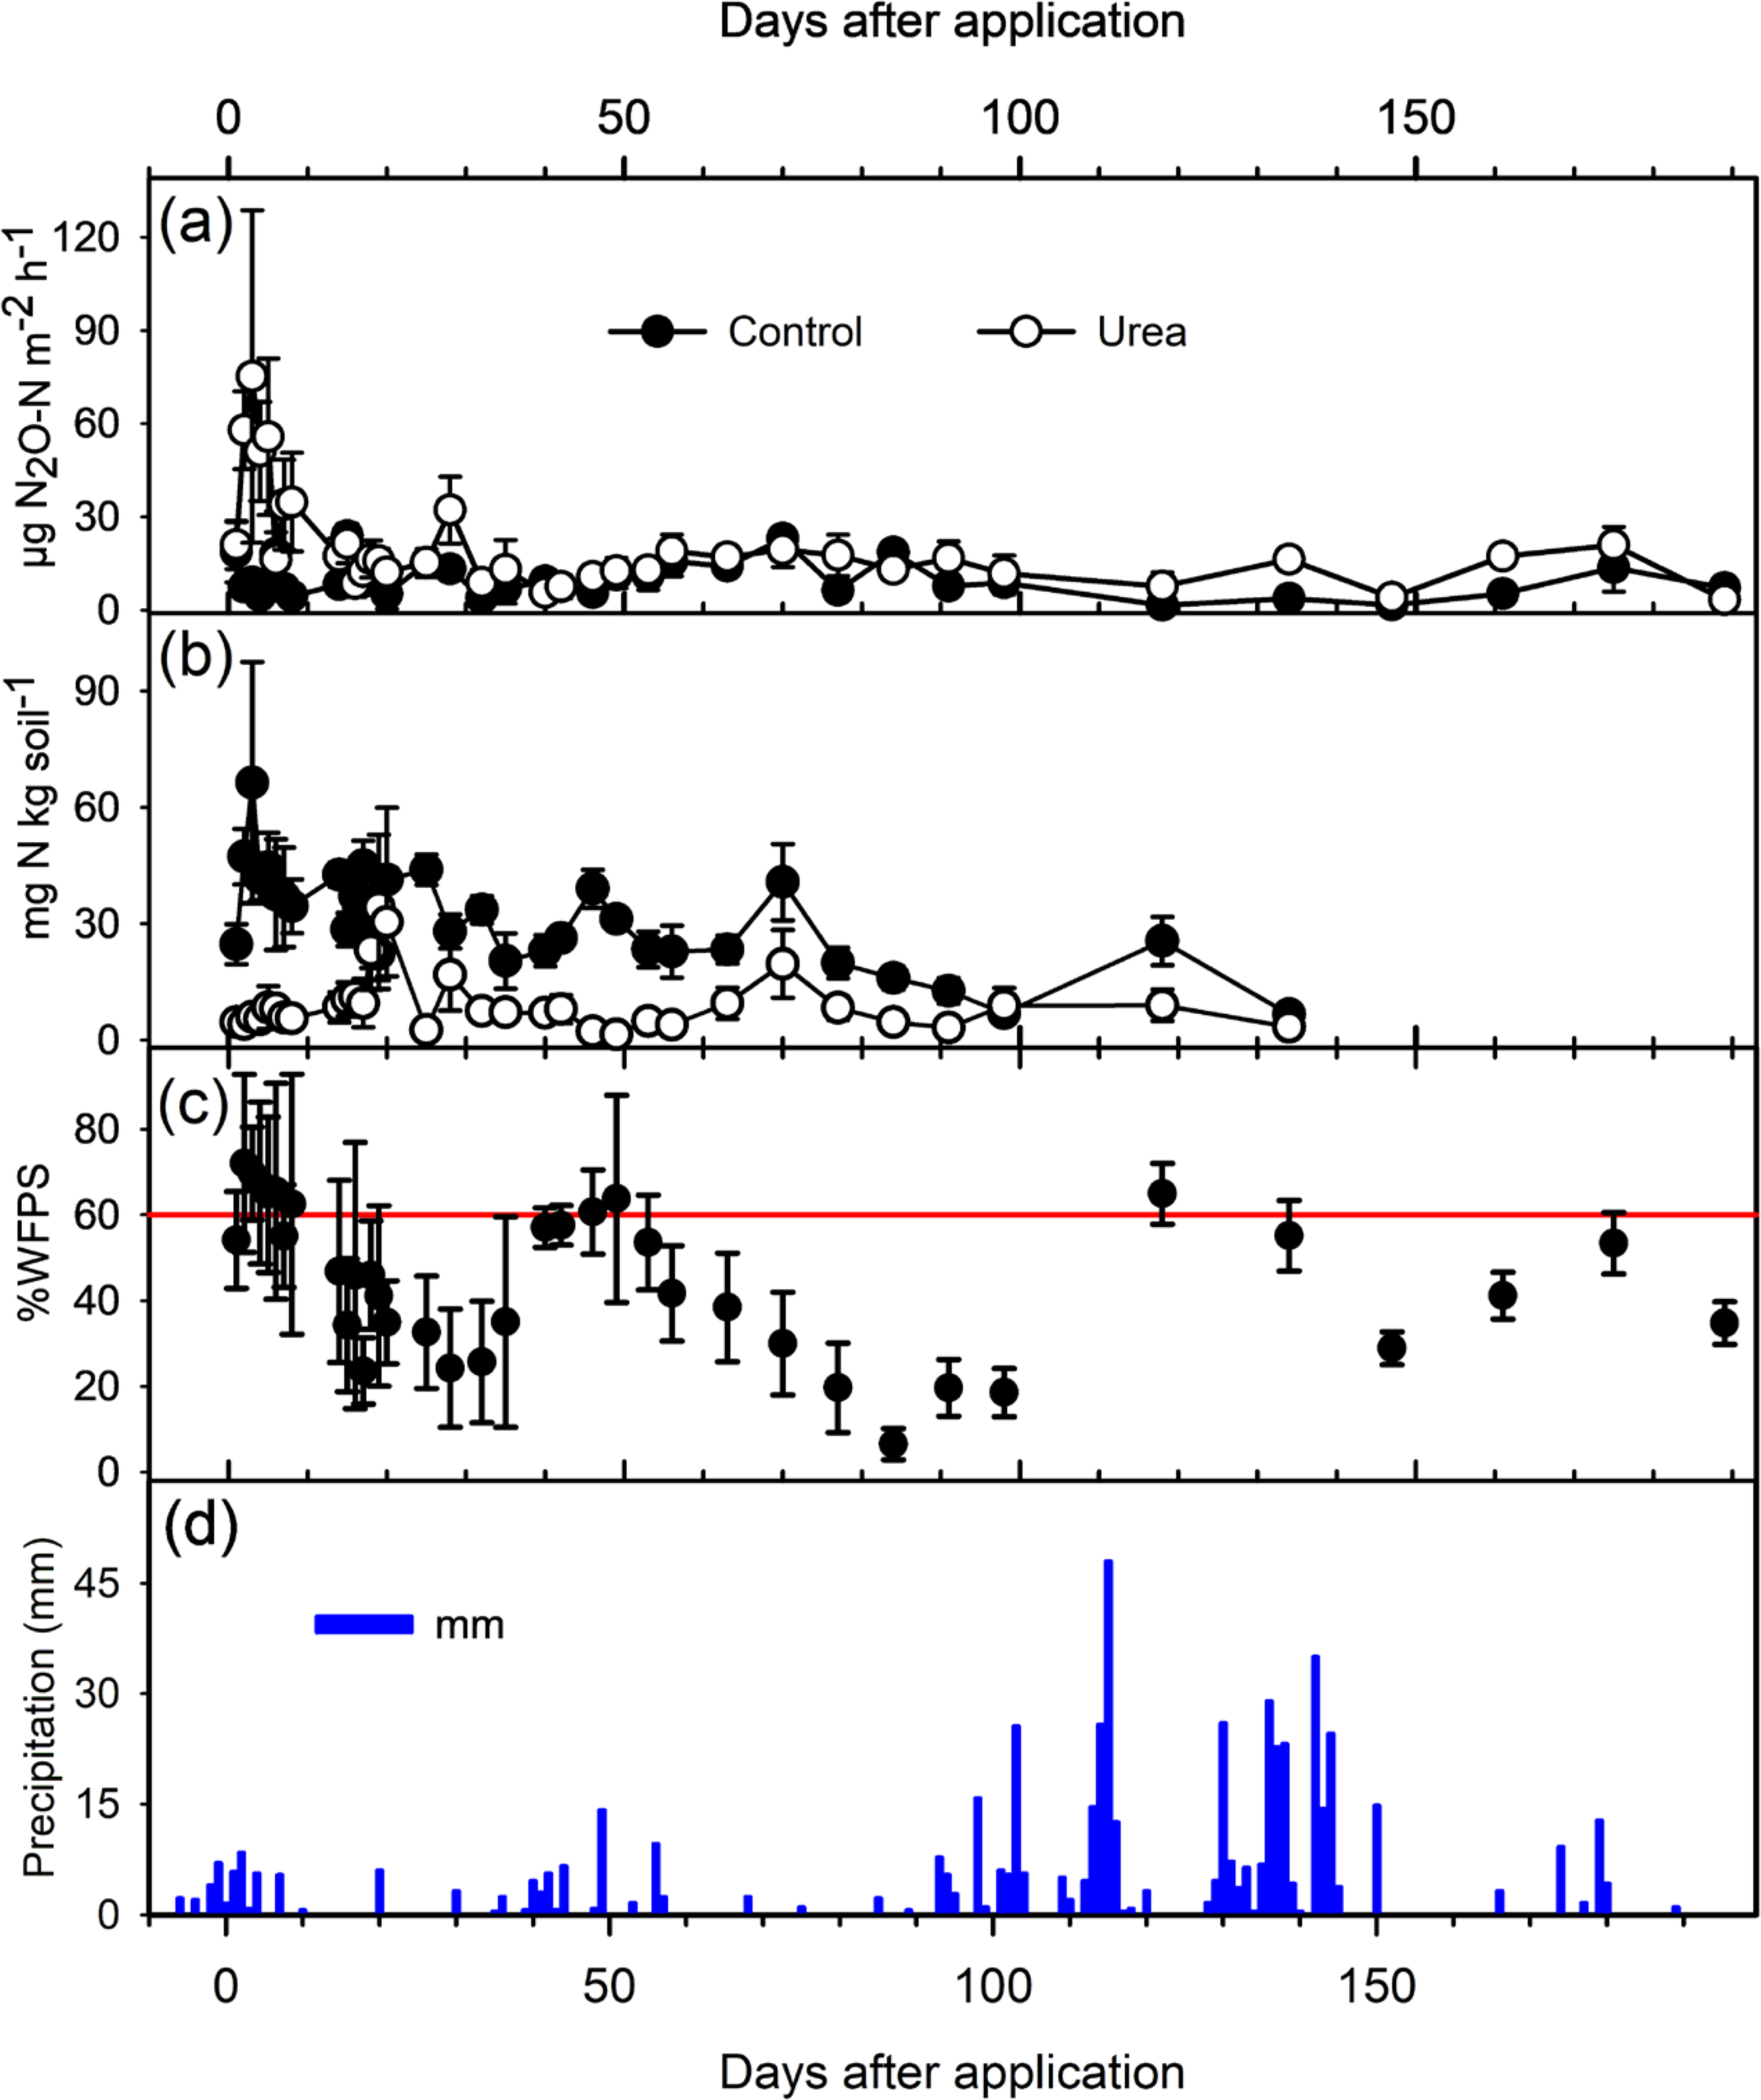
The first addition of urea fertilizer was in the cool season of the year, July 19, 2018, with mean temperatures for this month at 22.1 °C (mean minimum and maximum 18.7 and 25.6 °C). Six days before and four days after the urea application, there was a total of 37.5 mm of rainfall and during most of this period (6 days), the water-filled pore space (%WFPS) exceeded 60 % (Figure 7). This was the period of the highest emissions of N2O, which reached 75 µg N2O-N m-2 h-1 at three DAA. Between 40 and 50 DAA, there was a total of 35.4 mm rainfall, and the %WFPS exceeded 60 %, but there was no increase in the N2O emissions, probably because the nitrate concentration in the soil was very low. Later, between 100 and 150 DAA, there was a considerable rainfall amounting to 390 mm, but N2O emissions remained low probably because of the low concentrations of mineral N in the soil. For the 176 days of monitoring (29 evaluations), the total emission of N2O for the control area (no added N fertilizer) was 37.8 mg N2O-N m-2, and 65.7 mg N2O-N m-2 for the area where urea was applied. The extra emission due to the application of 60 kg N ha-1 of urea was thus 27.8 mg N2O-N m-2 or 278 g N2O-N ha-1, which translates into an emission factor for the urea of 0.464 %.

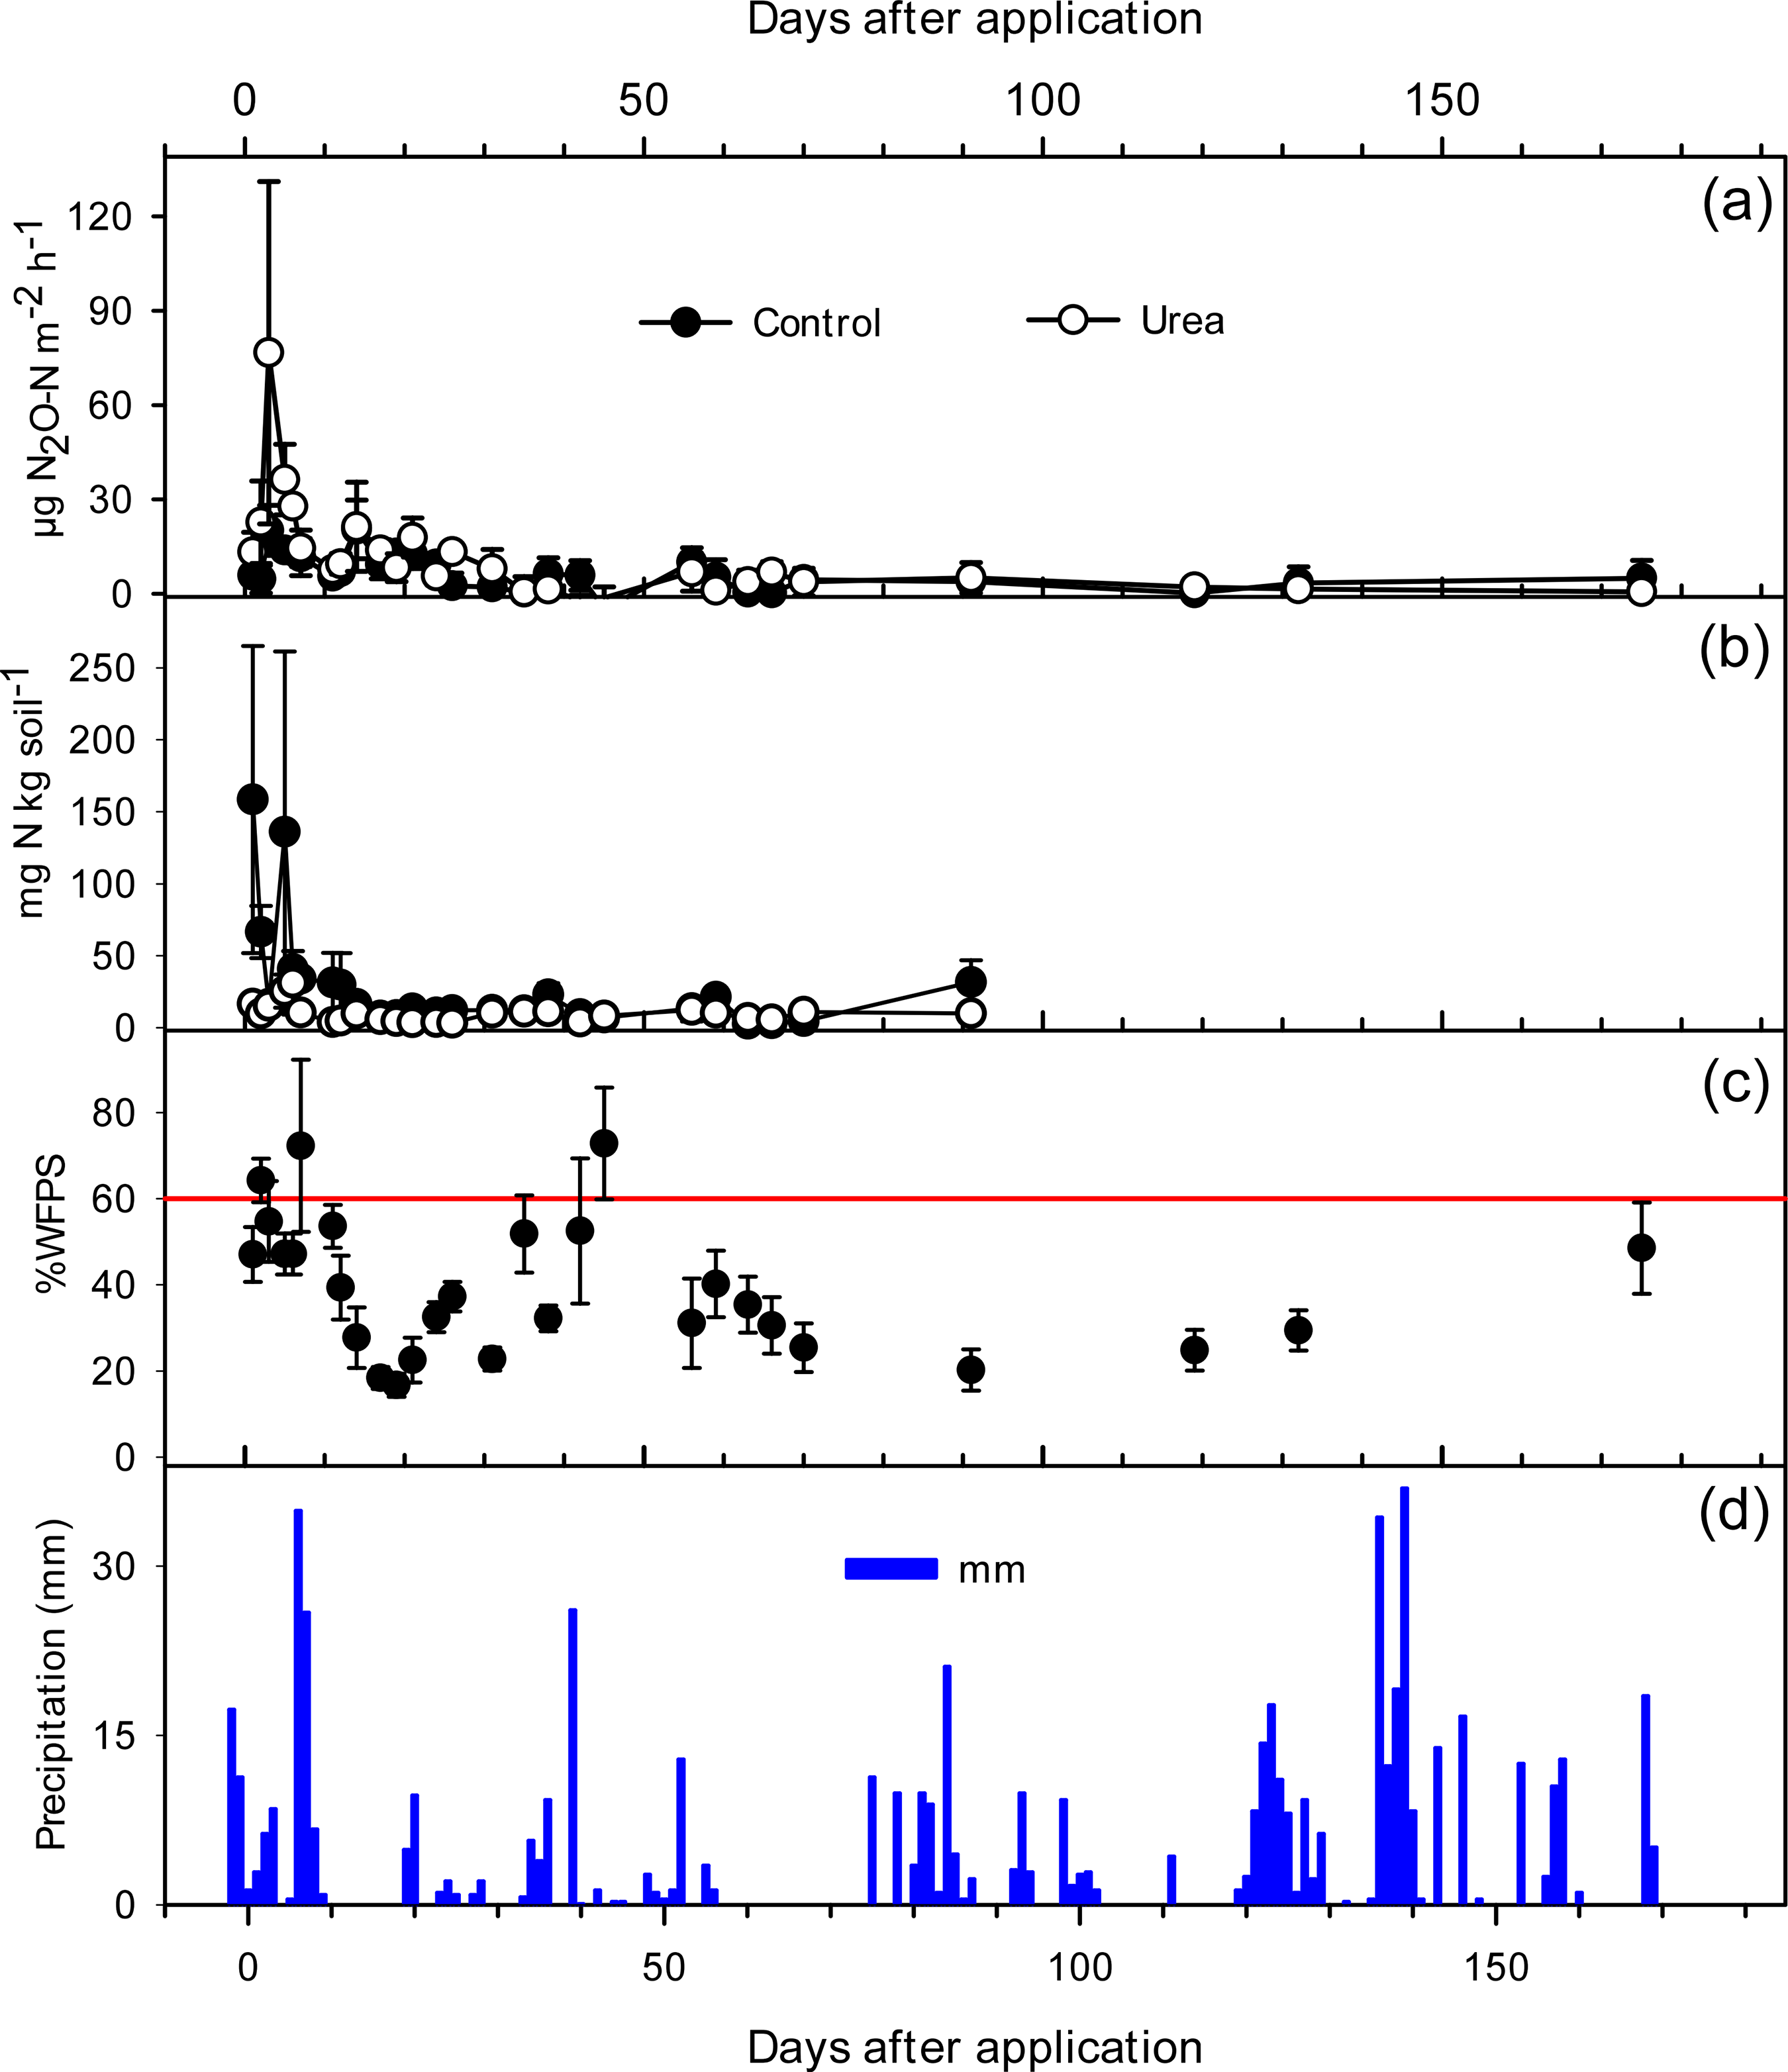
Emissions of N2O (μg N2O-N m-2 h-1) (a), concentration of ammonium and nitrate (mg N kg soil-1) in soil (b), % water-filled pore space (%WFPS) (c) and daily rainfall (mm) (d) after the second application of 60 kg N ha-1 as urea to the Palisade grass monoculture (March 22, 2019). The horizontal red line indicates 60 %WFPS below which N2O emissions are regarded restricted and only derived from nitrification (Davidson et al., 2000). Data are means of three replicates and error bars represent the standard error of the means.
The second urea addition was in the warm season, on February 23, 2019. There was considerable rainfall three days before the urea application and five days afterward, amounting to 110 mm (Figure 8). This was the period of the highest emissions of N2O, which reached 76 µg N2O-N m-2 h-1 at 3 DAA. Despite the much greater rainfall at the time of this application compared to the first, the %WFPS only exceeded 60 % for two days in this period. Temperatures were higher at this time of year (means for February and March 2019 were respectively 28.0 e 26.7 °C; mean minimum and maximum 32.5 and 22.9 °C), which resulted in increased growth rate and N uptake by the grass and increased evapotranspiration. This may explain the more rapid drying of the soil and the lower soil ammonium and nitrate concentrations within a few days of application of the urea fertilizer and the subsequent lower N2O emissions. From six DAA to the end of the evaluations at 203 DAP (a total of 40 assessments), the mean emission from the area where urea was applied was 6.5 µg N2O-N m-2 h-1 compared to 5.8 µg N2O-N m-2 h-1 the control area where no fertilizer was applied. The NH4+ concentrations in the soil increased immediately after urea application, attaining 158 and 136 mg N kg-1 on the first DAA and fourth DAA, respectively. The NO3- concentrations peaked at 31 mg N kg-1 on 5 DAA and subsequently were consistently low (>12 mg N kg soil-1). While the initial peak of N2O emission was similar to that of the first application, the emissions declined more rapidly even though there was much higher rainfall, at this time of year (240 mm between 100 and 150 DAA). The total emission of N2O for the whole 203 days for the control area (no added N fertilizer) was 18.5 mg N2O-N m-2, and 22.3 mg N2O-N m-2 for the area where urea was applied. The extra emission due to the application of 60 kg N ha-1 of urea was thus 3.76 mg N2O-N m-2 or 37.6 g N2O-N ha-1, which translates into an emission factor for the urea of 0.063 %.

Emissions of N2O (μg N2O-N m-2 h-1) (a), concentration of ammonium and nitrate (mg N kg soil-1) in soil (b), % water-filled pore space (%WFPS) (c) and daily rainfall (mm) (d) after the first application of 60 kg N ha-1 as urea to the Palisade grass monoculture (July 19, 2018). The horizontal red line indicates 60 %WFPS below which N2O emissions are regarded restricted and only derived from nitrification (Davidson et al., 2000). Data are means of three replicates and error bars represent the standard error of the means.
DISCUSSION
Ammonia volatilization from cattle excreta
Several techniques are available to evaluate ammonia volatilization and all into three main categories: micrometeorological, wind tunnel and chamber techniques (Sommer et al., 2004). Micrometeorological and wind tunnel techniques are difficult to compare volatilization fluxes from small patches of cattle excreta from several different treatments simultaneously, as was required in this study. There are many options available for the chamber techniques, some using direct sequential sampling of the atmosphere of a chamber (e.g., Mulvaney et al., 2008; Lee et al., 2012). Others chamber techniques trap the volatilized NH3 over periods of a few days via flows through external acid traps (“dynamic chambers” - Kissel et al., 1977; Rodriguez et al., 2021) or absorbing foam moistened with an acidic solution within the chamber (“static chambers” - Rawluk et al., 2001; Rinaldi et al., 2019). Static chamber techniques give lower values of ammonia volatilization than micrometeorological or wind tunnels, but specific details of the design and operation of static chambers can give very different results for NH3 fluxes (Ferguson et al., 1988; Smith et al., 2007; Mulvaney et al., 2008).
The simple “open” chamber used in this study was developed by Araújo et al. (2009), who also estimated gaseous N losses using a 15N mass balance. The results indicated that the acid-treated foam captured approximately 60 % of the volatilized ammonia. Jantalia et al. (2012) and Martins et al. (2021) obtained similar results comparing a 15N balance with the NH3 captured in chambers of the same design. From these results it was concluded this open chamber technique could be applied to urine and dung patches formed from the excreta of cattle grazing in the three pasture treatments and to areas treated with urea fertilizer.
There was no significant difference between the treatments in the urine N concentration, although the urine from the animals grazing on the degraded pasture (DEG) was, on average 28 % lower in N than the other treatments (Table 1), which may have influenced the NH3 loss. When the levels of N in the diet increase, there is an increase in the urinary excretion of N and the concentration of urea in the urine. This effect was observed by Petersen et al. (1998), who tested in Denmark the influence of two levels of concentrate in two different pastures on the excretion of N from dairy cows. The increase in N in the diet increased the concentration of urea in the urine; on average, the excretion of N in the urine increased from 7.7 g N kg-1 to 10.2 g N kg-1, which resulted in an increase of 55 % in the loss of NH3 (from 7.5 to 11.4 % of urine N).
Most studies on NH3 loss from cattle excreta have been performed in Europe or New Zealand, and concentrations of N in the urine generally range from 4 to 10 g N L-1. Volatilization losses vary widely from 4 to 52 % of urine N deposited in the soil surface (Oenema et al., 2008). Studies on clover-ryegrass pastures in New Zealand (Zaman and Blennerhassett, 2010; Zaman et al., 2009; 2013) reported losses of N from cattle urine ranging from 3.6 to 11 % in spring, 8 % in summer and from 5 to 23 % in autumn. A study performed in Ireland by Fischer et al. (2016) indicated NH3 emissions in spring, summer and autumn of 14.9, 9.8 and 8.7 %, respectively, of the urine taken from lactating Holstein-Friesian dairy cows.
There are fewer studies for grazed tropical pastures. Vallis et al. (1982) studied NH3 volatilization from cattle urine (6.5 to 8.5 g N L-1) on heavily fertilized (375 kg N ha-1 yr-1) Setaria sphacelata pasture and recorded urine N loses of between 14 and 28 %. Two studies with the same pasture treatments as this present study (Palisade grass monoculture with or without N fertilizer or mixed with the forage peanut) have recently been performed at two other sites in Brazil, both using the same techniques for the estimation of NH3 and N2O emissions (Longhini et al., 2020; Guimarães et al., 2022). Both were performed in regions with cooler and dryer winters than at Itabela. Nitrogen concentration in the urine of the study performed by Longhini et al. (2020) in Jaboticabal, São Paulo State, ranged from 3.1 to 4.6 g N L-1 in the rainy season and 2.2 to 2.8 N L-1 in the dry (cool) season. For the study performed by Guimarães et al. (2022) in Lavras, Minas Gerais, the concentration ranged from 1.4 to 3.2 g N L-1 and 1.0 to 2.0 g N g L-1 in the rainy and dry seasons, respectively. The estimates of NH3 loss ranged from 7.6 to 16.6 % of urine N at Jaboticabal and from 4.7 to 12.6 % at Lavras. The concentrations of N in urine used in this study (4.3 to 6.1 g N L-1 – first application; 2.3 to 3.5 g N L-1 – second application) were somewhat higher than in the study at Lavras and similar to those registered at Jaboticabal, but the volatilization losses were somewhat lower, ranging from 2.4 to 3.6 % (1st application) and from 2.0 to 6.8 % (2nd application).
In both applications, the NH3 losses from dung were lower than those from the urine. All studies where this comparison was made, the same result was reported, both in temperate climates (e.g., Ryden et al., 1987; Sugimoto et al., 1992; Saarijärvi et al., 2006; Laubach et al., 2013) and tropical regions (Lessa et al., 2014; Cardoso et al., 2019; Longhini et al., 2020). In the extensive beef production in Brazil, consumed forage generally has low N content, often leading to considerable proportions of the total excreted N in the form of dung, frequently approaching or even exceeding 50 % (Boddey et al., 2004; Xavier et al., 2014; Homem et al., 2021b).
Ammonia volatilization from N fertilizer
The loss of volatilized NH3 from fertilizer application depends on the interaction of factors related to the fertilizer (source of N, dose, form of application) and management practices (e.g., irrigation), which, associated with edaphoclimatic conditions, regulate the magnitude of volatilization. Urea, the most common nitrogen fertilizer used in Brazil (IFA, 2023), if applied on the surface without incorporation, has a high potential for loss via NH3 volatilization (Pan et al., 2016). Given the high potential for urea loss, the NH3 volatilization recorded was low. Cardoso et al. (2019), working in Brachiaria pastures, found losses that varied between 10.8 and 22.9 % of the N applied. Zaman et al. (2013), studying the loss of NH3 from urea in pastures in New Zealand, observed losses of 18.3 and 21.8 % from applications of 30 and 60 kg N ha-1, respectively. Bouwman et al. (2002) reviewed global results and concluded that NH3 losses from urea were between 18 and 26 % of the N applied, with a mean of 21 %.
The average loss of the two applications was only 2.24 % of the N applied. The application of urea (120 kg N ha-1 yr-1) was divided into two doses of 60 kg N ha-1, which are relatively low doses and may be one of the factors that contributed to this result. Volatilization of NH3 can increase exponentially with the increase of the fertilizer dose, indicating that the more urea is added to the soil, a greater proportion of N may be lost as NH3, especially in acidic soils (Rochette et al., 2013; Zaman et al., 2013).
The volatilization of NH3 is the consequence of NH3 transfer (diffusion) from the soil solution to the atmosphere, it is regulated by the total concentration of ammoniacal N, and by the transport resistance of NH3 between the solution and the atmosphere (Sommer et al., 2004). In the first application, rainfall of 5.8 and 8.4 mm occurred in two and three DAA, respectively. In the second application at two, three, and four DAA, the precipitation was 6.4, 8.6 and 8 mm, respectively. The precipitation regime was similar in both applications, with rainfall occurring in the first days of the experiment, which ceased in the last days of the evaluation. In the first application, the accumulated precipitation in the first five days of conducting the experiment was 22.1 mm, while in the second application, it was 26.6 mm (Figures 2 and 3).
Zaman et al. (2013) observed a mitigating effect on the volatilization of NH3 using irrigation of 5 and 10 mm, 8 hours after urea application. The same was not observed when the same irrigation was applied 24 and 48 h after fertilization. Considering that urea hydrolysis and NH3 volatilization are generally more intense hours after fertilization, the rains that occurred before the application of the urea fertilizer increased the soil moisture content and possibly leaching into the soil. Water, through the hydrolysis of urea, has the potential to increase the volatilization of NH3 under certain conditions, such as in soils with low moisture content. The rains, associated with the sandy texture of the soil, may have incorporated the urea from granules into sub-surface layers of the soil, thus diluting the concentration of NH4+ content in the water at the soil surface, hence reducing the loss of NH3 (Sommer et al., 2004).
Given the high potential for urea losses of NH3 from urea, the NH3 volatilization recorded was low. Cardoso et al. (2019) working in Brachiaria pastures, found losses between 10.8 and 22.9 % of the applied N. Zaman et al. (2013) studying the NH3 volatilization due to the application of urea to pastures in New Zealand, observed losses of 18.3 and 21.8 % from applications of 30 and 60 kg N ha-1, respectively. Bouwman et al. (2002), in a worldwide review of NH3 volatilization from cropping, including wetland rice, and a few reports on pasture, suggested that losses were between 18 and 26 % of the applied N. In addition, the authors observed that in pastures, regardless of the applied fertilizer, 15.9 % of the N was volatilized, and the global N loss via volatilization was estimated to be between 10 and 19 %. Estimation close to that found by Pan et al. (2016), who found an average global volatility of 18 %, with a variation between 0.9 and 64 %.
Based on the study of Mosier et al. (2008), the IPCC proposes that in the preparation of reports and inventories, for countries that do not have sufficient data, 10 % of N from fertilizers is lost as NH3 volatilization (FracGASF). Although this value may underestimate emissions in some cases (Cardoso et al., 2019), for the edaphoclimatic conditions studied and management practices adopted in the present study, the use of the IPCC FracGASF overestimated the NH3 volatilization recorded in this study.
Emissions of nitrous oxide from cattle excreta
During the monitoring of N2O emissions, approximately 9 % of the measurements were negative, representing a flow of N2O from the atmosphere into the soil, that is, the soil would be acting as an N2O consumer. Negative N2O fluxes are sometimes treated as experimental errors due to the collection method used (chambers). When the measured flows are very low and close to the detection limit of the devices, they could also be considered artifacts, but there is a lot of evidence showing that N2O consumption occurs in the field (Chapuis-Lardy et al., 2007). Due to the higher values of N2O consumption being observed in wetlands and peat soils, anaerobic conditions and low availability of N-mineral, N2O consumption has widely been attributed to denitrification; the microbial reduction of N2O to N2 (Rudaz et al., 1991; Ruser et al., 2006). However, there are many reports of soil consuming N2O even under aerobic conditions (Wu et al., 2013; Chiesa et al., 2018).
The maximum consumption observed in the present study was approximately 13 µg N-N2O m-2 h-1 (3.1 µg N-N2O chamber-1 h-1), within the range observed in the literature. The detection limit of our chamber methodology was estimated to be approximately 5.0 µg N-N2O m-2 h-1 (1.2 µg N-N2O chamber-1 h-1). Given the soil potential to act as an N2O consumer in several situations, the negative results were presented in the figures and integrated into the calculations.
Nitrogen present in dung is almost all in organic forms, which have not been released as simple organic compounds or mineral N during passage through the bovine digestive tract (Oenema et al., 2008; Dijkstra et al., 2013). In contrast, the principal form of N in urine is urea, and its rapid conversion to NH3 means that urine can be a greater source of NH3 and N2O emissions than dung. In agreement with all available studies, the emission factor of N2O emissions from cattle urine was always considerably higher than those from cattle dung (Flessa et al., 1996; Sordi et al., 2013; Rivera and Chará, 2021). Even in low-productivity pastures, the N deposited in dung is rarely much greater than that deposited in urine (Boddey et al., 2004; Xavier et al., 2014; Homem et al., 2021b), so the total emissions from urine are always higher than for dung. Diets richer in protein have more N in dung, and emissions from urine become even more dominant.
The higher WFPS of the soil at the first excreta application than at the second accounts for the higher N2O emissions at this first application. At the second application of excreta, all the emissions were low, and there were negligible differences between the emissions from the dung and the urine, although there was a tendency for the emissions from the excreta to be higher than for the control (no added excreta). At the first application, the emissions from the urine were significantly (p<0.05) higher than for the dung and the control treatments.
In the study at Lavras (Guimarães et al., 2022), the mean emission factor for urine was 0.52 %, very similar to the value of 0.53 % for the first application in this study. However, the emissions for both urine and dung at the second application were lower, with means of 0.04, 0.06, and 0.08, respectively, compared to 0.17 for dung in the study at Lavras.
The main objective of this study was to compare NH3 and N2O emissions from the mixed Palisade grass-forage peanut pasture with those of the N-fertilized Palisade grass monoculture. There was no significant difference between treatments in the fraction of the excreta N emitted as N2O (Table 2). Similar results were obtained by Guimarães et al. (2022) at Lavras (MG), although they reported there was a tendency (p=0.074) for N2O emissions from the excreta of cattle grazing N fertilized Palisade grass to be higher than those in the mixed Palisade grass-forage peanut pasture.
Tannins presence in legume forage can lead to the immobilization of soluble forms of nitrogen such that more N is excreted in the dung and less in the urine (Lüscher et al., 2014). Concentrations of N in the urine and dung were not consistently different between the PGFP and the PG+N, suggesting this effect was not significant in this study, perhaps because tannins concentration in forage peanuts is generally not high. The study at Lavras found that the concentration of condensed tannins in the legume was approximately 24 g kg DM-1 (6.1 g kg DM in the diet at a mean contribution of 25 % legume - Homem et al., 2021a), and in this present study between 4 and 27 g kg DM-1 (Monteiro, 2020). In contrast, concentrations of 22 (winter) and 60-70 g kg DM-1 (spring to autumn) of condensed tannins were recorded in the legume Desmodium ovalifolium by Santos et al. (2022).
Emissions of nitrous oxide from urea fertilizer
There WFPS was higher at the time of the first addition of urea fertilizer than at the second addition. This resulted in an emission factor for the urea fertilizer for the first period of 0.446 % and the second period of 0.063 %. The IPCC default value for the direct emission from N fertilizer is 1 %, and while in cool and wet climates, the EF for urea fertilizer can exceed 1 % (de Klein et al., 2001; Uchida et al., 2008), in warm and drier conditions most reports are lower than 1 % (Piva et al., 2014; Campanha et al., 2019; Suter et al., 2020). The studies most relevant to ours are those where urea fertilizer has been added to Brachiaria pastures. The team at UNESP Jaboticabal (SP) performed two studies on applying urea fertilizer to Palisade grass. In the first study, the EFs in the rainy season for the two years were 1.20 and 1.25 %, respectively, but in the dry season were reduced to 0.8 and 0.16 % (Cardoso et al., 2019). In their second study, the mean EF for single additions of 90, 180 and 270 kg urea N ha-1 was 1.0 %, but when the urea was divided into three equal doses during the year, the EF was reduced to a mean of 0.35 % (Corrêa et al., 2021). From these results, it appears that at least for the rainy season, the IPCC default EF of 1 % of applied N is reasonable, but a lower EF may be more appropriate for urea applied in the dry season.
CONCLUSIONS
Except when conditions were dry, as was the case of the second application of urine and dung, the rate of NH3 volatilization and the N2O emissions were higher for the urine than for the dung per unit of N in the excreta. In these relatively low N input pasture systems, the proportion of N in the dung was close to that in the urine. It follows that different emission factors should be applied to these two forms of excreta, as suggested in the IPCC (2019) guidelines and our earlier evaluations. Under moist soil conditions favorable for N2O emissions, the emissions from urine from the N-fertilized pasture (PG+N) were higher than for the mixed grass legume (PGFP). Ammonia losses were low, not exceeding 6.8, 1.1, and 4.7 % of the N applied as urine, dung, and fertilizer, respectively, such that this indirect source of N2O would be minor. There is considerable mitigation of GHG emissions from the avoiding the use of N fertilizer and no emissions of N2O from fertilizer N in the mixed pasture where urea was not applied. In additions the results of this study show that N2O emissions from urine of cattle grazing the mixed grass/legume pasture were lower than form cattle grazing in the N-fertilized pasture. Mixed grass-legume pasture is a promising strategy to reduce GHG emissions from pastures of Urochloa brizantha, the pasture grass most used for cattle production in Brazil.
ACKNOWLEDGEMENTS
This study was supported by the Federal Rural University of Rio de Janeiro (UFRRJ), Carlos Chagas Filho Research Foundation of the State of Rio de Janeiro (FAPERJ), National Council for Scientific and Technological Development (CNPq) and Coordination for the Improvement of Higher Education Personnel (CAPES). The authors thank the staff of ESSUL/CEPLAC for their diligent field work and the technical staff of Embrapa Agrobiologia for their laboratory analyses. The authors CAS and RCM gratefully acknowledge PhD fellowships from CAPES and SU, BJRA and RMB acknowledge productivity fellowships from CNPq and awards of Cientista de Nosso Estado from FAPERJ. This document has been prepared with the financial support provided by FONTAGRO, the New Zealand Ministry for Primary Industries, and PROCISUR. The views expressed herein are exclusively those of the authors, and do not reflect the points of view of FONTAGRO and PROCISUR, their respective Executive Boards, the Bank, the Sponsoring Institutions, or the countries they represent.
-
How to cite: Monteiro RC, Santos CA, Rezende CP, Pereira JM, Macedo RO, Alves BJR, Homem BGC, Urquiaga S, Zaman M, Boddey RM. Impact of a forage legume or nitrogen fertilizer application on ammonia volatilization and nitrous oxide emissions in Brachiaria pastures. Rev Bras Cienc Solo. 2024;48:e0240012. https://doi.org/10.36783/18069657rbcs20240012
REFERENCES
-
Allen AG, Jarvis SC, Headon DM. Nitrous oxide emissions from soils due to inputs of nitrogen from excreta return by livestock on grazed grassland in the U.K. Soil Biol Biochem. 1996;28:597-607. https://doi.org/10.1016/0038-0717(95)00186-7
» https://doi.org/10.1016/0038-0717(95)00186-7 -
Alves BJR, Smith KA, Flores RA, Cardoso AS, Oliveira WRD, Jantalia CP, Urquiaga S, Boddey RM. Selection of the most suitable sampling time for static chambers for the estimation of daily mean N2O flux from soils. Soil Biol Biochem. 2012;46:129-35. https://doi.org/10.1016/j.soilbio.2011.11.022
» https://doi.org/10.1016/j.soilbio.2011.11.022 -
Araújo EDS, Marsola T, Miyazawa M, Soares LHDB, Urquiaga S, Boddey RM, Alves BJR. Calibration of a semi-opened static chamber for the quantification of volatilized ammonia from soil. Pesq Agropec Bras. 2009;44:769-76. https://doi.org/10.1590/S0100-204X2009000700018
» https://doi.org/10.1590/S0100-204X2009000700018 -
Arnold SL, Schepers JS. A simple roller-mill grinding procedure for plant and soil samples. Commun Soil Sci Plant Anal. 2004;35:537-45. https://doi.org/10.1081/CSS-120029730
» https://doi.org/10.1081/CSS-120029730 -
Barcellos AO, Ramos AKB, Vilela D, Martha GBJr. Sustentabilidade da produção animal baseada em pastagens consorciadas e no emprego de leguminosas exclusivas, na forma de banco de proteína, nos trópicos brasileiros. Rev Bras Zootec (Spe). 2008;37:51-67. https://doi.org/10.1590/S1516-35982008001300008
» https://doi.org/10.1590/S1516-35982008001300008 -
Boddey RM, Casagrande DR, Homem BGC, Alves BJR. Forage legumes in tropical grass pastures in Brazil and likely impacts on greenhouse gas emissions. Grass Forage Sci. 2020;75:357-71. https://doi.org/10.1111/gfs.12498
» https://doi.org/10.1111/gfs.12498 -
Boddey RM, Macedo R, Tarré RM, Ferreira E, Oliveira OC, Rezende CP, Cantarutti RB, Pereira JM, Alves BJR, Urquiaga S. Nitrogen cycling in Brachiaria pastures: The key to understanding the process of pasture decline. Agr Ecosyst Environ. 2004;103:389-403. https://doi.org/10.1016/j.agee.2003.12.010
» https://doi.org/10.1016/j.agee.2003.12.010 -
Bouwman AF, Bouwman LJM, Batjes NH. Estimation of global NH3 volatilization loss from synthetic fertilizers and animal manure applied to arable lands and grasslands. Global Biogeochem Cy. 2002;16:8. https://doi.org/10.1029/2000GB001389
» https://doi.org/10.1029/2000GB001389 -
Bremner JM, Mulvaney CS. Nitrogen-total. In: Page AL, editor. Methods of soil analysis: Part 2 Chemical and microbiological properties. Madison: SSSA; 1983. p. 595-624. https://doi.org/10.2134/agronmonogr9.2.2ed.c31
» https://doi.org/10.2134/agronmonogr9.2.2ed.c31 -
Bretas IL, Paciullo DSC, Alves BJR, Martins MR, Cardoso AS, Lima MA, Rodrigues RAR, Silva FF, Chizzotti FHM. Nitrous oxide, methane, and ammonia emissions from cattle excreta on Brachiaria decumbens growing in monoculture or silvopasture with Acacia mangium and Eucalyptus grandis Agr Ecosyst Environ. 2020;295:106896. https://doi.org/10.1016/j.agee.2020.106896
» https://doi.org/10.1016/j.agee.2020.106896 -
Burchill W, Li D, Lanigan GJ, Williams M, Humphreys J. Interannual variation in nitrous oxide emissions from perennial ryegrass/white clover grassland used for dairy production. Glob Chang Biol. 2014;20:3137-46. https://doi.org/10.1111/gcb.12595
» https://doi.org/10.1111/gcb.12595 -
Campanha MM, Oliveira AD, Marriel IE, Gontijo Neto MM, Malaquias JV, Landau EC, Albuquerque Filho MR, Ribeiro FP, Carvalho AM. Effect of soil tillage and N fertilization on N2O mitigation in maize in the Brazilian Cerrado. Sci Total Environ. 2019;692:1165-74. https://doi.org/10.1016/j.scitotenv.2019.07.315
» https://doi.org/10.1016/j.scitotenv.2019.07.315 -
Cardoso AS, Berndt A, Leytem A, Alves BJR, Carvalho IDNO, Soares LHB, Urquiaga S, Boddey RM. Impact of the intensification of beef production in Brazil on greenhouse gas emissions and land use. Agric Syst. 2016;143:86-96. https://doi.org/10.1016/j.agsy.2015.12.007
» https://doi.org/10.1016/j.agsy.2015.12.007 -
Cardoso AS, Oliveira SC, Janusckiewicz ER, Brito LF, Morgado ES, Reis RA, Ruggieri AC. Seasonal effects on ammonia, nitrous oxide, and methane emissions for beef cattle excreta and urea fertilizer applied to a tropical pasture. Soil Till Res. 2019;194:104341. https://doi.org/10.1016/j.still.2019.104341
» https://doi.org/10.1016/j.still.2019.104341 -
Chapuis-Lardy L, Wrage N, Metay A, Chotte J, Bernoux M. Soils, a sink for N2O? A review. Glob Chang Biol. 2007;13:1-17. https://doi.org/10.1111/j.1365-2486.2006.01280.x
» https://doi.org/10.1111/j.1365-2486.2006.01280.x -
Chiesa TD, Piñeiro G, Yahdjian L. Gross, background, and net anthropogenic soil nitrous oxide emissions from soybean, corn, and wheat croplands. J Environ Qual. 2018;48:15-23. https://doi.org/10.2134/jeq2018.07.0262
» https://doi.org/10.2134/jeq2018.07.0262 -
Coates DB, Schachenmann P, Jones RJ. Reliability of extrusa samples collected from steers fistulated at the oesophagus to estimate the diet of resident animals in grazing experiments. Aust J Exp Agr. 1987;27:739-45. https://doi.org/10.1071/EA9870739
» https://doi.org/10.1071/EA9870739 -
Conant RT, Cerri CEP, Osborne BB, Paustian K. Grassland management impacts on soil carbon stocks: A new synthesis. Ecol Appl. 2017;27:662-8. https://doi.org/10.1002/eap.1473
» https://doi.org/10.1002/eap.1473 -
Corrêa DCC, Cardoso AS, Ferreira MR, Siniscalchi D, Toniello AD, Lima GC, Reis RA, Ruggieri AC. Are CH4, CO2, and N2O emissions from soil affected by the sources and doses of N in warm-season pasture? Atmosphere. 2021;12:697. https://doi.org/10.3390/atmos12060697
» https://doi.org/10.3390/atmos12060697 -
Davidson EA, Keller M, Erickson HE, Verchot LV, Veldkamp E. Testing a conceptual model of soil emissions of nitrous and nitric oxides. Bioscience. 2000;50:667-80. https://doi.org/10.1641/0006-3568(2000)050[0667:TACMOS]2.0.CO;2
» https://doi.org/10.1641/0006-3568(2000)050[0667:TACMOS]2.0.CO;2 -
Dijkstra J, Oenema O, van Groenigen KJ, Spek JW, van Vuuren AM, Bannink A. Diet effects on urine composition of cattle and N2O emissions. Animal. 2013;7:292-302. https://doi.org/10.1017/S1751731113000578
» https://doi.org/10.1017/S1751731113000578 -
Eclesia RP, Jobbagy EG, Jackson RB, Biganzoli F, Piñeiro G. Shifts in soil organic carbon for plantation and pasture establishment in native forests and grasslands of South America. Glob Chang Biol. 2012;18:3237-51. https://doi.org/10.1111/j.1365-2486.2012.02761.x
» https://doi.org/10.1111/j.1365-2486.2012.02761.x -
Ferguson RB, McInnes KJ, Kissel DE, Kanemasu ET. A comparison of methods of estimating ammonia volatilization in the field. Fert Res. 1988;15:55-69. https://doi.org/10.1007/BF01049187
» https://doi.org/10.1007/BF01049187 -
Fischer K, Burchill W, Lanigan GJ, Kaupenjohann M, Chambers BJ, Richards KG, Forresta PJ. Ammonia emissions from cattle dung, urine and urine with dicyandiamide in a temperate grassland. Soil Use Manag. 2016;32:83-91. https://doi.org/10.1111/sum.12203
» https://doi.org/10.1111/sum.12203 -
Flessa H, Dorsch P, Beese F, Konig H, Bouwman AF. Influence of cattle wastes on nitrous oxide and methane fluxes in pasture land. J Environ Qual. 1996;25:1366-70. https://doi.org/10.2134/jeq1996.00472425002500060028x
» https://doi.org/10.2134/jeq1996.00472425002500060028x -
Guimarães BC, Gomes FK, Homem BGC, Lima IBG, Spasiani PP, Boddey RM, Alves BJR, Casagrande DR. Emissions of N2O and NH3 from cattle excreta in grass pastures fertilized with N or mixed with a forage legume. Nutr Cycl Agroecosys. 2022;122:325-46. https://doi.org/10.1007/s10705-022-10207-3
» https://doi.org/10.1007/s10705-022-10207-3 -
Homem BGC, Lima IBG, Spasiani PP, Borges LPC, Boddey RM, Dubeux JCB, Bernardes TF, Casagrande DR. Palisadegrass pastures with or without nitrogen or mixed with forage peanut grazed to a similar target canopy height. 2. Effects on animal performance, forage intake and digestion, and nitrogen metabolism. Grass Forage Sci. 2021a;76:413-26. https://doi.org/10.1111/gfs.12533
» https://doi.org/10.1111/gfs.12533 -
Homem BGC, Lima IBG, Spasiani PP, Guimarães BC, Guimarães GD, Bernardes TF, Rezende CP, Boddey RM, Casagrande DR. N-fertiliser application or legume integration enhances N cycling in tropical pastures. Nutr Cycl Agroecosys. 2021b;121:167-90. https://doi.org/10.1007/s10705-021-10169-y
» https://doi.org/10.1007/s10705-021-10169-y -
Intergovernmental Panel on climate change – IPCC. 2006 IPCC Guidelines for National Greenhouse Gas Inventories. Volume 4: Agriculture, forestry and other land use. IPCC; 2006. Available from: https://www.ipcc-nggip.iges.or.jp/public/2006gl/vol4.html
» https://www.ipcc-nggip.iges.or.jp/public/2006gl/vol4.html -
Intergovernmental Panel on climate change – IPCC. IPCC Refinement to the 2006 IPCC guidelines for national greenhouse gas inventories. IPCC; 2019 [cited 2023 Oct 21]. Available from: https://www.ipcc.ch/report/2019-refinement-to-the-2006-ipcc-guidelines-for-national-greenhouse-gas-inventories/
» https://www.ipcc.ch/report/2019-refinement-to-the-2006-ipcc-guidelines-for-national-greenhouse-gas-inventories/ -
International Fertilizer Association - IFA. 2023 [cited 2023 Oct 21]. Available from: https://www.ifastat.org/databases/plant-nutrition
» https://www.ifastat.org/databases/plant-nutrition -
Jank L, Barrios SC, Valle CB, Simeão RM, Alves GF. The value of improved pastures to Brazilian beef production. Crop Pasture Sci. 2014;65:1132-7. https://doi.org/10.1071/CP13319
» https://doi.org/10.1071/CP13319 -
Jantalia CP, Halvorson AD, Follett RF, Alves BJR, Polidoro JC, Urquiaga S. Nitrogen source effects on ammonia volatilization as measured with semi-static chambers. Agron J. 2012;104:1595-603. https://doi.org/10.2134/agronj2012.0210
» https://doi.org/10.2134/agronj2012.0210 -
Kempers AJ, Zweers A. Ammonium determination in soil extracts by the salicylate method. Commun Soil Sci Plant Anal. 1986;17:715-23. https://doi.org/10.1080/00103628609367745
» https://doi.org/10.1080/00103628609367745 -
Kissel DE, Brewer HL, Arkin GF. Design and test of a field sampler for ammonia volatilization. Soil Sci Soc Am J. 1977;41:1133-8. https://doi.org/10.2136/sssaj1977.03615995004100060024x
» https://doi.org/10.2136/sssaj1977.03615995004100060024x -
Klein CAM, Sherlock RR, Cameron KC, van der Weerden TJ. Nitrous oxide emissions from agricultural soils in New Zealand—A review of current knowledge and directions for future research. J Roy Soc New Zeal. 2001;31:543-74. https://doi.org/10.1080/03014223.2001.9517667
» https://doi.org/10.1080/03014223.2001.9517667 -
Laubach J, Taghizadeh-Toosi A, Gibbs SJ, Sherlock RR, Kelliher FM, Grover SPP. Ammonia emissions from cattle urine and dung excreted on pasture. Biogeosciences. 2013;10:327-38. https://doi.org/10.5194/bg-10-327-2013
» https://doi.org/10.5194/bg-10-327-2013 -
Lee C, Hristov AN, Dell CJ, Feyereisen GW, Kaye J, Beegle D. Effect of dietary protein concentration on ammonia and greenhouse gas emitting potential of dairy manure. J Dairy Sci. 2012;95:1930-41. https://doi.org/10.3168/jds.2010-4141
» https://doi.org/10.3168/jds.2010-4141 -
Lessa ACR, Madari BE, Paredes DS, Boddey RM, Urquiaga S, Jantalia CP, Alves BJR. Bovine urine and dung deposited on Brazilian savannah pastures contribute differently to direct and indirect soil nitrous oxide emissions. Agr Ecosyst Environ. 2014;190:104-11. https://doi.org/10.1016/j.agee.2014.01.010
» https://doi.org/10.1016/j.agee.2014.01.010 -
Longhini VZ, Cardoso ADS, Berça AS, Boddey RM, Reis RA, Dubeux Junior JCB, Ruggieri AC. Nitrogen supply and rainfall affect ammonia emissions from dairy cattle excreta and urea applied on warm-climate pastures. J Environ Qual. 2020;49:1453-66. https://doi.org/10.1002/jeq2.20167
» https://doi.org/10.1002/jeq2.20167 -
Lüscher A, Mueller-Harvey JF, Soussana JF, Rees RM, Peyraud JD. Potential of legume-based grassland-livestock systems in Europe: A review. Grass Forage Sci. 2014;69:206-28. https://doi.org/10.1111/gfs.12124
» https://doi.org/10.1111/gfs.12124 -
Martins MR, Sant’Anna SAC, Zaman M, Santos RC, Monteiro RC, Alves BJR, Jantalia CP, Boddey RM, Urquiaga S. Strategies for the use of urease and nitrification inhibitors with urea: Impact on N2O and NH3 emissions, fertilizer-15N recovery and maize yield in a tropical soil. Agr Ecosyst Environ. 2017;247:54-62. https://doi.org/10.1016/j.agee.2017.06.021
» https://doi.org/10.1016/j.agee.2017.06.021 -
Martins MR, Sarkis LF, Guareschi RF, dos Santos CA, Sant’Anna SAC, Zaman M, Jantalia CP, Alves BJR, Boddey RM, Araújo ES, Urquiaga S. A simple and easy method to measure ammonia volatilization: accuracy under field conditions. Pedosphere. 2021;31:255-24. https://doi.org/10.1016/S1002-0160(20)60077-7
» https://doi.org/10.1016/S1002-0160(20)60077-7 -
Mazzetto AM, Feigl BJ, Schils RLM, Cerri CEP, Cerri CC. Improved pasture and herd management to reduce greenhouse gas emissions from a Brazilian beef production system. Livest Sci. 2015;175:101-12. https://doi.org/10.1016/j.livsci.2015.02.014
» https://doi.org/10.1016/j.livsci.2015.02.014 -
Ministério da Ciência, Tecnologia e Inovação - MCTI. Estimativas anuais de emissões de gases de efeito estufa no Brasil. 6. ed. Brasília, DF: MCTI; 2022. Available from: https://www.gov.br/mcti/pt-br/acompanhe-o-mcti/sirene/publicacoes/estimativas-anuais-de-emissoes-gee/arquivos/6a-ed-estimativas-anuais.pdf
» https://www.gov.br/mcti/pt-br/acompanhe-o-mcti/sirene/publicacoes/estimativas-anuais-de-emissoes-gee/arquivos/6a-ed-estimativas-anuais.pdf - Monteiro RC. Efeito da introdução de Arachis pintoi cv. Belomonte em pastagens de Brachiaria brizantha cv Marandú na produção leiteira e dinâmica de nitrogênio [thesis]. Seropédica, RJ: Universidade Federal Rural do Rio de Janeiro; 2020.
-
Morais RF, Boddey RM, Urquiaga S, Jantalia CP, Alves BJR. Ammonia volatilization and nitrous oxide emissions during soil preparation and N fertilization of elephant grass (Pennisetum purpureum Schum.). Soil Biol Biochem. 2013;64:80-8. https://doi.org/10.1016/j.soilbio.2013.04.007
» https://doi.org/10.1016/j.soilbio.2013.04.007 -
Mosier AR. Exchange of gaseous nitrogen compounds between terrestrial systems and the atmosphere. In: Hatfield JL, Follet RF, editors. Nitrogen in the environment. 2nd ed. Cambridge: Academic Press; 2008 p. 443-62. https://doi.org/10.1016/B978-0-12-374347-3.00013-5
» https://doi.org/10.1016/B978-0-12-374347-3.00013-5 -
Mulvaney MJ, Cummins KA, Wood CW, Wood BH, Tyler PJ. Ammonia emissions from field-simulated cattle defecation and urination. J Environ Qual. 2008;37:2022-7. https://doi.org/10.2134/jeq2008.0016
» https://doi.org/10.2134/jeq2008.0016 -
Nichols KL, Del Grosso SJ, Derner JD, Follett RF, Archibeque SL, Delgado JA, Paustian KH. Nitrous oxide and ammonia emissions from cattle excreta on shortgrass steppe. J Environ Qual. 2018;47:419-26. https://doi.org/10.2134/jeq2017.12.0463
» https://doi.org/10.2134/jeq2017.12.0463 -
Oenema O, Bannink A, Sommer SG, van Groenigen JW, Velthof GL. Gaseous nitrogen emissions from livestock farming systems. In: Hatfield JL, Follett RF, editors. Nitrogen in the environment sources, problems, and management. London, UK: Elsevier; 2008. p. 395-441. https://doi.org/10.1016/B978-0-12-374347-3.00012-3
» https://doi.org/10.1016/B978-0-12-374347-3.00012-3 -
Pan B, Lam SK, Mosier A, Luo Y, Chen D. Ammonia volatilization from synthetic fertilizers and its mitigation strategies: A global synthesis. Agr Ecosyst Environ. 2016;232:283-9. https://doi.org/10.1016/j.agee.2016.08.019
» https://doi.org/10.1016/j.agee.2016.08.019 -
Pereira JM, Rezende CDP, Borges AMF, Homem BGC, Casagrande DR, Macedo TM, Alves BJR, Sant’Anna SAC, Urquiaga S, Boddey RM. Production of beef cattle grazing on Brachiaria brizantha (Marandu grass) - Arachis pintoi (forage peanut cv. Belomonte) mixtures exceeded that on grass monocultures fertilized with 120 kg N/ha. Grass Forage Sci. 2020;75:28-36. https://doi.org/10.1111/gfs.12463
» https://doi.org/10.1111/gfs.12463 -
Petersen SO, Sommer SG, Aaes O, Soegaard K. Ammonia losses from urine and dung of grazing cattle: effect of N intake. Atmos Environ. 1998;32:295-300. https://doi.org/10.1016/S1352-2310(97)00043-5
» https://doi.org/10.1016/S1352-2310(97)00043-5 -
Piva JT, Dieckow J, Bayer C, Zanatta JA, Moraes A, Tomazi M, Pauletti V, Barth G, Piccolo MC. Soil gaseous N2O and CH4 emissions and carbon pool due to integrated crop-livestock in a subtropical Ferralsol. Agr Ecosyst Environ. 2014;190:87-93. https://doi.org/10.1016/j.agee.2013.09.008
» https://doi.org/10.1016/j.agee.2013.09.008 -
R Development Core Team. R: A language and environment for statistical computing. Vienna, Austria: R Foundation for Statistical Computing; 2019. Available from: http://www.R-project.org/
» http://www.R-project.org/ -
Rawluk CDL, Grant CA, Racz GJ. Ammonia volatilization from soils fertilized with urea and varying rates of urease inhibitor NBPT. Can J Soil Sci. 2001;81:239-46. https://doi.org/10.4141/S00-052
» https://doi.org/10.4141/S00-052 -
Rinaldi LF, Garcia PL, Sermarini RA, Trivelin PCO. 15N-urea efficiency in maize as influenced by humic substances and urease inhibitors treatments. Commun Soil Sci Plant Anal. 2019;50:198-208. https://doi.org/10.1080/00103624.2018.1556679
» https://doi.org/10.1080/00103624.2018.1556679 -
Rivera JE, Chará J. CH4 and N2O emissions from cattle excreta: A review of main drivers and mitigation strategies in grazing systems. Front Sustain Food Syst. 2021;5:657936. https://doi.org/10.3389/fsufs.2021.657936
» https://doi.org/10.3389/fsufs.2021.657936 -
Rochette P, Angers DA, Chantigny MH, Gasser M-O, MacDonald JD, Pelster DE, Bertrand N. Ammonia volatilization and nitrogen retention: How deep to incorporate urea? J Environ Qual. 2013;42:1635-42. https://doi.org/10.2134/jeq2013.05.0192
» https://doi.org/10.2134/jeq2013.05.0192 -
Rodriguez MJ, Saggar S, Berben P, Palmada T, Lopez-Villalobos N, Pal P. Use of a urease inhibitor to mitigate ammonia emissions from urine patches. Environ Technol. 2021;42:20-31. https://doi.org/10.1080/09593330.2019.1620345
» https://doi.org/10.1080/09593330.2019.1620345 -
Rudaz AO, Davidson EA, Firestone MK. Sources of nitrous oxide production following wetting of dry soil. FEMS Microbiol Ecol. 1991;85:117-24. https://doi.org/10.1111/j.1574-6968.1991.tb04703.x-i1
» https://doi.org/10.1111/j.1574-6968.1991.tb04703.x-i1 -
Ruser R, Flessa H, Russow R, Schmidt G, Buegger F, Munch JC. Emission of N2O, N2 and CO2 from soil fertilized with nitrate: effect of compaction, soil moisture and rewetting. Soil Biol Biochem. 2006;38:263-74. https://doi.org/10.1016/j.soilbio.2005.05.005
» https://doi.org/10.1016/j.soilbio.2005.05.005 -
Ryden JC, Whitehead DC, Lockyer DR, Thompson RB, Skinner JH, Garwood EA. Ammonia emission from grassland and livestock production systems in the UK. Environ Pollut. 1987;48:173-84. https://doi.org/10.1016/0269-7491(87)90032-7
» https://doi.org/10.1016/0269-7491(87)90032-7 -
Saarijärvi K, Mattila PK, Virkajärvi P. Ammonia volatilization from artificial dung and urine patches measured by the equilibrium concentration technique (JTI method). Atmos Environ. 2006;40:5137-45. https://doi.org/10.1016/j.atmosenv.2006.03.052
» https://doi.org/10.1016/j.atmosenv.2006.03.052 -
Saggar S, Bolan NS, Bhandral R, Hedley CB, Luo J. A review of emissions of methane, ammonia, and nitrous oxide from animal excreta deposition and farm effluent application in grazed pastures. New Zeal J Agr Res. 2004;47:513-44. https://doi.org/10.1080/00288233.2004.9513618
» https://doi.org/10.1080/00288233.2004.9513618 - Santana SO, Santos RD, Gomes IA, Jesus RM, Araujo QR, Mendonça JR, Calderano SB, Faria Filho AF. Solos da região sudeste da Bahia: Atualização da legenda de acordo com o Sistema Brasileiro de Classificação de Solos. Rio de Janeiro: Embrapa Solos; 2002. (Boletim de pesquisa e desenvolvimento, 16).
-
Santos CA, Monteiro RC, Homem BGC, Salgado LS, Casagrande DR. Productivity of beef cattle grazing Brachiaria brizantha cv. Marandu with and without nitrogen fertilizer application or mixed pastures with the legume Desmodium ovalifolium Grass Forage Sci. 2022;78:147-60. https://doi.org/10.1111/gfs.12581
» https://doi.org/10.1111/gfs.12581 -
Scholefield D, Lockyer DR, Whitehead DC, Tyson KC. A model to predict transformations and losses of nitrogen in UK pastures grazed by beef cattle. Plant Soil 1991;112:165-77. https://doi.org/10.1007/BF00010397
» https://doi.org/10.1007/BF00010397 -
Smith E, Gordon R, Bourque C, Campbell A. Comparison of three simple field methods for ammonia volatilization from manure. Can J Soil Sci. 2007;87:469-77. https://doi.org/10.4141/CJSS06038
» https://doi.org/10.4141/CJSS06038 -
Sommer SG, Schjoerring JK, Denmead OT. Ammonia emission from mineral fertilizers and fertilized crops. Adv Agron. 2004;82:557-621. https://doi.org/10.1016/S0065-2113(03)82008-4
» https://doi.org/10.1016/S0065-2113(03)82008-4 -
Sordi A, Dieckow J, Bayer C, Alburquerque MA, Piva JT, Zannata JA, Tomazi M, Rosa CM, Moraes A. Nitrous oxide emission factors for urine and dung patches in a subtropical Brazilian pastureland. Agr Ecosyst Environ. 2013;190:94-103. https://doi.org/10.1016/j.agee.2013.09.004
» https://doi.org/10.1016/j.agee.2013.09.004 -
Souza WS, Rezende CP, Pereira JM, Monteiro RC, Santos CA, Macedo RO, Alecrim FB, Pinheiro ÉFM, Campos DVB, Urquiaga S, Alves BJR, Boddey RM. Can N2 fixation by forage legumes build soil organic matter to rival fertilizer N in a tropical forest biome? Geoderma Regional. 2023;33:e00646. https://doi.org/10.1016/j.geodrs.2023.e00646
» https://doi.org/10.1016/j.geodrs.2023.e00646 -
Sugimoto Y, Ball R, Theobald P. Dynamics of nitrogen in cattle dung on pasture, under different seasonal conditions: 1. Breakdown of dung and volatilization of ammonia. Japan J Grassl Sci. 1992;38:160-6. https://doi.org/10.14941/grass.38.160
» https://doi.org/10.14941/grass.38.160 -
Suter H, Lam SK, Walker C, Chen D. Enhanced efficiency fertilisers reduce nitrous oxide emissions and improve fertiliser 15N recovery in a Southern Australian pasture. Sci Total Environ. 2020;699:134147. https://doi.org/10.1016/J.SCITOTENV.2019.134147
» https://doi.org/10.1016/J.SCITOTENV.2019.134147 -
Uchida Y, Clough TJ, Kelliher FM, Sherlock RR. Effects of aggregate size, soil compaction, and bovine urine on N2O emissions from a pasture soil. Soil Biol Biochem. 2008;40:924-31. https://doi.org/10.1016/j.soilbio.2007.11.007
» https://doi.org/10.1016/j.soilbio.2007.11.007 -
Vallis I, Harper L, Catchpoole V, Weier K. Volatilization of ammonia from urine patches in a subtropical pasture. Aust J Agric Res. 1982;33:97-107. https://doi.org/10.1071/AR9820097
» https://doi.org/10.1071/AR9820097 -
van der Weerden TJ, Luo J, Klein CAM, Hoogendoorn CJ, Littlejohn RP, Rys GJ. Disaggregating nitrous oxide emission factors for ruminant urine and dung deposited onto pastoral soils. Agr Ecosyst Environ. 2011;141:426-36. https://doi.org/10.1016/j.agee.2011.04.007
» https://doi.org/10.1016/j.agee.2011.04.007 -
van der Weerden TJ, Noble A, Klein CAM, Hutchings N, Thorman RE, Alfaro MA, Amon B, Beltran I, Grace P, Hassouna M, Krol DJ, Leytem AB, Salazar F, Velthof GL. Ammonia and nitrous oxide emission factors for excreta deposited by livestock and land-applied manure. J Environ Qual. 2021;50:1005-23. https://doi.org/10.1002/jeq2.20259
» https://doi.org/10.1002/jeq2.20259 -
van der Weerden TJ, Noble AN, Luoc J, de Klein CAM, Saggar S, D. Giltrap D, Gibbs J, Ryse G. Meta-analysis of New Zealand’s nitrous oxide emission factors for ruminant excreta supports disaggregation based on excreta form, livestock type and slope class. Sci Total Environ. 2020;732:139235. https://doi.org/10.1016/j.scitotenv.2020.139235
» https://doi.org/10.1016/j.scitotenv.2020.139235 -
van Groenigen JW, Velthof GL, van der Bolt FJE, Vos A, Kuikman PJ. Seasonal variation in N2O emissions from urine patches: effects of urine concentration, soil compaction and dung. Plant Soil. 2005;273:15-27. https://doi.org/10.1007/s11104-004-6261-2
» https://doi.org/10.1007/s11104-004-6261-2 -
Wu D, Dong W, Oenema O, Wang Y, Trebs I, Hua C. N2O consumption by low-nitrogen soil and its regulation by water and oxygen. Soil Biol Biochem. 2013;60:165-72. https://doi.org/10.1016/j.soilbio.2013.01.028
» https://doi.org/10.1016/j.soilbio.2013.01.028 -
Xavier DF, Lédo FJS, Paciullo DSC, Urquiaga S, Alves BJR, Boddey RM. Nitrogen cycling in a Brachiaria-based silvopastoral system in the Atlantic forest region of Minas Gerais, Brazil. Nutr Cycl Agroecosys. 2014;99:45-62. https://doi.org/10.1007/s10705-014-9617-x
» https://doi.org/10.1007/s10705-014-9617-x -
Zaman M, Blennerhassett JD. Effects of the different rates of urease and nitrification inhibitors on gaseous emissions of ammonia and nitrous oxide, nitrate leaching and pasture production from urine patches in an intensive grazed pasture system. Agr Ecosyst Environ. 2010;136:236-46. https://doi.org/10.1016/j.agee.2009.07.010
» https://doi.org/10.1016/j.agee.2009.07.010 -
Zaman M, Saggar S, Stafford AD. Mitigation of ammonia losses from urea applied to a pastoral system: The effect of nBTPT and timing and amount of irrigation. Pr N Z Grassl Assoc. 2013;75:209-14. https://doi.org/10.33584/jnzg.2013.75.2898
» https://doi.org/10.33584/jnzg.2013.75.2898 -
Zaman MS, Saggar S, Blennerhassett JD, Singh J. Effect of urease and nitrification inhibitors on N transformation, gaseous emissions of ammonia and nitrous oxide, pasture yield and N uptake in grazed pasture system. Soil Biol Biochem. 2009;41:1270-80. https://doi.org/10.1016/j.soilbio.2009.03.011
» https://doi.org/10.1016/j.soilbio.2009.03.011
Edited by
-
Editors: José Miguel Reichert https://orcid.org/0000-0001-9943-2898 and Jeferson Dieckow https://orcid.org/0000-0002-3025-4402