 Effects of a self-paced cycling time trial on muscle function and cell-free DNA in master athletes
Abstract
Abstract The objective of the present study is to characterize the self-selected Pacing Strategy (PS) of master cyclists during a simulated 20 km cycling time trial and to assess the muscle function along with the cell-free DNA response. Eight cyclists (age: 42.00 ± 5.35 years) participated in this study. Initially, Heart Rate (HR), Cell-Free DNA (cfDNA), anthropometric measurements and muscle function markers (vertical jump, muscle soreness, thigh circumference and range of motion) were collected at rest. The 20 km cycling Time Trial (20TT) session proceeded as follows: first, each participant completed an individual warm-up with a self-selected pace for 10 minutes. After this, participants were instructed to perform the 20TT in the shortest time possible using their preferred PS. HR, Rating of Perceived Exertion (RPE), time, speed, cadence and power output were measured during all tests. Venous blood samples were collected both immediately and 30 minutes after the 20TT to analyze the cfDNA. Additionally, Muscle Function (MF) markers were reassessed 30 minutes after the end of the exercise. The results indicated that the power output-duration curve exhibited a self-selected parabolic PS (U-shape) with preference for pedaling at high cadences (> 90 rpm). Furthermore, the RPE and the HR increased linearly, reaching peak values at the end of the test. Regarding the cfDNA, vertical jump and thigh circumference, no differences were observed 30 minutes after exercise (P > 0.05). In conclusion, these findings suggest that this parabolic pacing profile with high cadences can be an optimal strategy for performance in the 20TT, as it did not impair muscle function.
Key words:
Cell-free nucleic acids; Bicycling; Physical functional performance; Athletic performance
Resumo
Resumo O objetivo do presente estudo é caracterizar a Estratégia de Prova (EP) auto-selecionada por atletas master em uma simulação de prova de contrarrelógio de ciclismo de 20 km (CR20km), para avaliar funcionalidade muscular e ácidos nucleicos circulantes fora de células. Oito ciclistas (idade: 42,00 ± 5,35 anos) participaram deste estudo. Foram coletadas a Frequência Cardíaca (FC), o sangue venoso, as medidas antropométricas e os marcadores de funcionalidade muscular (salto vertical, dor muscular, circunferência da coxa e amplitude de movimento) em repouso. Na sessão de CR20km, cada ciclista completou um aquecimento individual com uma EP auto-selecionada durante 10 minutos. Após isso, a CR20km foi realizada no menor tempo possível usando a EP escolhida pelo participante. Durante todo o teste, foram medidas a FC, a Percepção Subjetiva de Esforço (PSE), o tempo, a velocidade, a cadência e a potência. O sangue venoso foi novamente coletado imediatamente e 30 minutos após a CR20km para a análise de ácidos nucleicos circulantes fora de células (cfDNA). Os marcadores de Função Muscular (FM) foram reavaliados 30 minutos após o exercício. Os resultados da curva de potência-duração indicaram que os ciclistas auto-selecionaram uma EP parabólica (formato de U) favorecendo altas cadências (> 90 rpm). Ademais, a PSE e a FC aumentaram linearmente, enquanto o cfDNA, o salto vertical e circunferência da coxa não apresentaram diferenças significativas 30 minutos após a CR20km (p > 0,05). É possível concluir que adotar uma EP parabólica com cadências elevadas pode ser uma ótima estratégia para melhorar o desempenho em provas de CR20km, uma vez que não prejudicou a função muscular.
Palavras-chave:
Ácidos nucleicos circulantes fora de células; Ciclismo; Desempenho funcional; Performance atlética
INTRODUCTION
The distribution of energy expenditure, speed or power throughout an endurance exercise has been termed as Pacing Strategy (PS)1,2. In competitions, athletes need to properly distribute their energy resources to complete a test as quickly as possible without premature fatigue. In this context, studies have been searching for the ideal PS to promote the best performance1-3. In a 20-kilometer Time Trial (20TT), an even-paced strategy resulted in attenuated physiological disturbances along with lower perceived exertion when compared to self-selected and variable PS4. Despite these results, self-paced exercise is rarely sustained at a constant intensity5.
Choosing a PS during a competition can be influenced by the knowledge of the endpoint as well as by the physical sensations of effort and fatigue6. In other words, the Rating of Perceived Exertion (RPE) can contribute to the athlete’s pacing regulation7,8. Koning et al.9 proposed a scale, the Hazard Score (HS), that comprises a representative index of the relationship between the RPE and the power output variations. Moreover, inadequate power distribution during exercise can influence fatigue and impair the athlete’s performance10. It has been suggested that fatigue is a multifactorial process that leads to a decline in strength, power and a high RPE during submaximal activities11. Thus, the presence of fatigue is associated with a reduction in the skeletal muscle’s ability to produce strength and power, which may be caused by an inhibitory effect induced by muscle pain, swelling and stiffness11.
Even though the self-selected pace is adjusted during exercise to prevent premature fatigue and, consequently, would not trigger a reduction in muscular strength1,2, the results are still conflicting. According to the literature, after a 30-km time trial in endurance-trained runners, it is possible to observe a ~23.5% reduction in the maximal voluntary contraction of the knee extensors concomitant with a decrease in voluntary activation, which is attributed to central fatigue12. There are several blood markers to assess muscle load or fatigue after exercise, among them, the cell-free DNA (cfDNA) has been praised for being a potential biomarker to monitor physiological processes and detect the performance decline associated with muscle damage13,14. It has been previously proven that the cfDNA increases during various endurance-based exercises, but it still needs to be clarified if these alterations are reproducible after a 20TT.
Therefore, the objective of the present study was to characterize the self-selected pacing strategy of master cyclists during a simulated 20TT as well as to assess the response of muscle function and cfDNA after exercise.
METHODS
Experimental approach to the problem
Cyclists were required to visit the laboratory once for data collection, to determine their anthropometric measurements (body mass, height, weight of the bicycle). Then, the participants were asked to complete a self-selected cycling warm-up for 10 minutes and to perform an individualized self-paced 20 km time trial. The power output, time, speed and cadence were measured during the 20TT. The perceived exertion and hazard score rating was obtained every 5 km of the route’s distance. Both the venous blood samples and the markers of muscle function were assessed before, immediately after and 30 minutes after the 20TT test.
Participants
Eight endurance-trained male cyclists competing in masters athletics (age: 42.0 ± 5.3 years, weight: 77.1 ± 7.3 kg, height:1.74 ± 0.07 meters), dedicated to systematic training (11.25 ± 2.10 hours per week) for the last two years without interruption (with a cycling experience of 19.0 ± 9.20 years) were selected for the present study.
The participants were instructed to refrain from strenuous activities at least 72 hours before the 20TT, as well as to maintain their habitual dietary intake for the 48 hours prior to the visit and fast for 8 hours, avoiding anti-inflammatory medications. The procedures for research involving human beings were approved by the Ethics Committee of the Universidade Federal de Viçosa (registered under No. 59773616.0.0000.5153).
Procedures for data collection
20 km cycling time trial (20TT)
First, a free-paced 10-minute warm-up was completed, followed by 5 minutes of rest. The cyclists then performed an individualized self-paced 20 km time trial using their bikes coupled to a CompuTrainer ProLab 3D (Racermate Inc.), being measured: power output (Watts, W), cadence (Revolution Per Minutes - rpm), time (seconds), and speed (km/h).
The participants were instructed to finish the 20TT as fast as possible, and verbal encouragement was provided. The only available feedback was related to the distance, while blinding the athletes from the other performance variables’ feedback. The cycling route was configured with the Computrainer 3D software with automatic control of the constant workload mode set to the weight (bicycle + cyclist).
For better precision in data acquisition, the bicycles’ original wheels were replaced by power meter wheels (PowerTap et al., USA). The performance data was analyzed in 10 steps, 1 for every 10% of the total test duration. The self-selected pacing profile (force/time) was calculated by the average power output produced in each time interval, normalized as a percentage according to the total average power produced.
Heart rate (HR)
A bluetooth heart rate chest strap (Polar H7, USA) was attached below the participant’s pectoralis major and connected to the HRV® software. Data was analyzed using Kubios (HRV standard 3.3.0® software). The mean data was assessed in 10 steps (averaging every 10% of the total test duration). The Heart Rate peak (HRpeak) was established as the highest rate reached and maintained for 30 seconds during the test, being normalized as a percentage according to the average HR reached at each moment.
Rating of perceived exertion (RPE) and hazard score (HS)
The RPE was evaluated every 5 km of distance; the participants were asked to report their RPE using Borg’s CR-10 scale (0-10). The HS was determined by multiplying momentary RPE by the remaining fraction of the race15.
Venus blood sampling (VBS) and cfDNA concentration assay
The VBS and cfDNA were measured before, immediately after and 30 minutes after the 20TT (pre-exercise, post-0, and post-30, respectively). The cfDNA was analyzed according to Andreatta et al.14.
Breakfast
The breakfast offered to the participants 1h before the test consisted of 200 ml of natural grape juice, two slices of whole grain bread and 60 grams of white cheese, totaling 339.02 grams, with 58.37 grams of carbohydrates, 13.65 grams of protein and 5.66 grams of lipids (Software DietWin Professional 2.0).
Muscle function markers
Markers of muscle function were assessed before and 30 minutes after the time trial (pre-exercise and post-30, respectively).
Quadriceps muscle soreness
With the participants lying down on a stretcher, the rectus femoris muscle 20 cm distal to the lateral epicondyle of the femur was evaluated. Up to 50 kg/cm-2 of pressure was applied to the area using an algometer (Wagner Instruments, FPX 50/220). The participants were asked to indicate when the pressure became 'uncomfortable’, which was then established as the pressure-pain threshold (kg/cm-2). Each area was tested twice, and the mean pressure reading was used for analysis16.
Range of motion (ROM)
The knee’s ROM measurement was determined with a standard digital 2-arm goniometer (Medigauge, Columbia, USA). The goniometer was centered on the lateral epicondyle of the femur as a hinge joint. The proximal arm of the goniometer was placed parallel to the shaft of the femur toward the greater trochanter, and the distal arm of the goniometer was placed parallel to the shaft of the tibia toward the lateral malleolus.
Thigh circumference (CIR)
The CIR was evaluated on the right thigh at the midpoint between the greater trochanter of the femur and the knee joint using a standard tape measure (Cescorf, Brazil).
Jump performance
Muscle force was assessed by physical performance testing with two vertical jump protocols: Squat Jump (SJ) and Countermovement Jump (CMJ) according to Andreatta et al.14.
Statistical analysis
Values were expressed as the Mean ± Standard Deviation (SD) with 95% confidence intervals. Data normality was analyzed using the Shapiro-Wilk test. The variables cell-free DNA, rate of perceived exertion, time, cadence, speed, pacing strategy, heart rate and normalized heart rate peak were evaluated using the one-way ANOVA followed by Bonferroni’s post hoc test. Jump performance and muscle function markers were determined with the paired t-test. P < 0.05 was considered as statistically significant (Prism 6, GraphPad Software, Inc., San Diego, CA, USA).
RESULTS
The mean total time for the 20TT was 1.952 ± 104 seconds (Figure 1A). The HR in the initial 10% of the time was significantly lower when compared to the other moments (p = 0.002), while the HR in 90-100% of the test duration was significantly higher (p = 0.002) than the rate in 10-70% of it (Figure 1B). The cadence was significantly higher (p = 0.007) in the first 10% of the test’s total time when compared at 90 and 100% of the total duration (Figure 1C).

Performance during a 20-km time trial cycling test. Individual time (A), individual heart rate (B), a plot of the individual cadence for each subject (continuous line) and sample mean (filled diamond) (C), a plot of the individual speed for each subject (continuous line) and sample mean (filled circle) (D). Data expressed in mean ± SD. Key: (a) significantly smaller than the other moments; (b) significantly greater than 10% to 70% of the time; (c) significantly greater than 90% and 100% of the time; p <0.05.
The average power output in the 20TT was 260.4 ± 37.1 Watts. A U-shape pacing profile was adopted by the cyclists (Figure 2A). The normalized PO was significantly greater (p = 0.0003) at the start (0-10%) and at the end (90-100%; p = 0.0003). The mean peak heart rate was 187 ± 9 bpm during the 20TT. The normalized HR (Figure 2C) was lower than the HRpeak in the first 10% of the duration compared to all other moments (p < 0.05), where the HRpeak during the 90%-100% interval of the duration was significantly higher than during the 10% up to the 70% interval of the time trial duration. The HR increased linearly even with reduced applied power output between 20% to 90% of the total duration (Figure 2D).

Self-paced profile in a 20-km time trial cycling test. Normalized power output produced in 10% intervals during time trial (A), individual power output (B), normalized heart rate in 10% intervals during the time trial (C), relationship between pacing strategy and percentage of peak heart rate (D). Data expressed in mean ± SD. Key: (a) significantly greater than 20% until 90% of the time trial was completed; (b) significantly greater than 30% until 70% of the time trial was completed; (c) significantly smaller than the other moments; (d) significantly greater than 10% until 70% of the time trial was completed; p < 0.05.
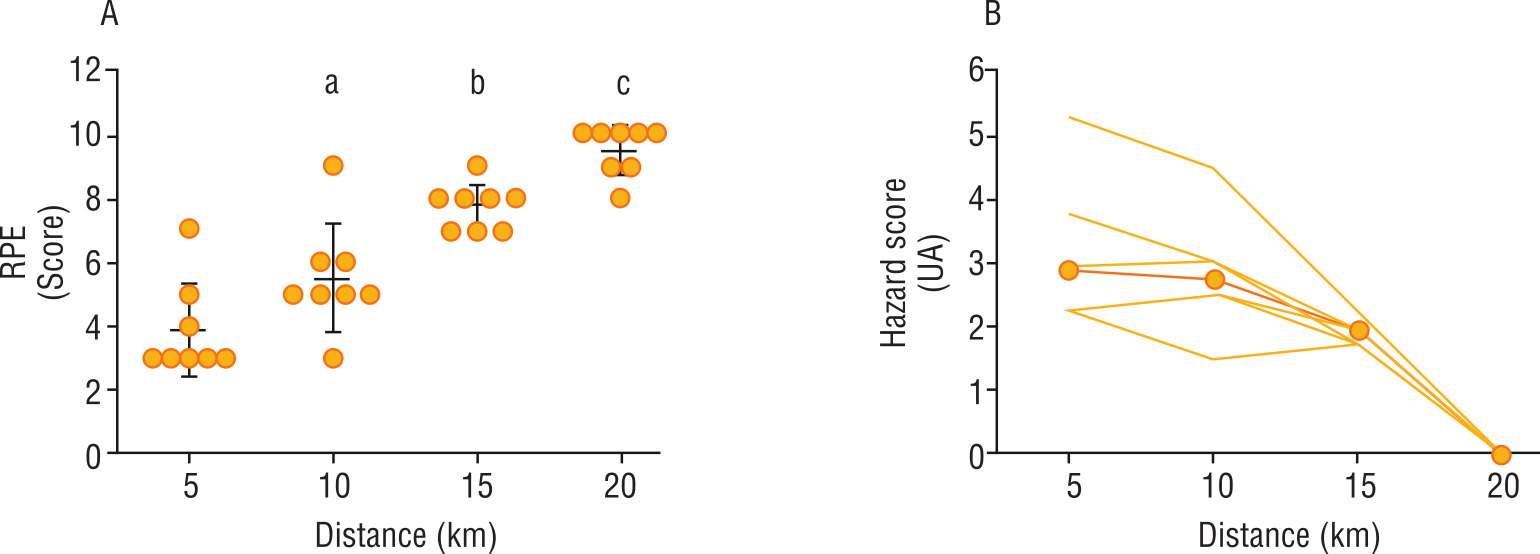
The RPE increased linearly throughout the test, being significantly greater at 10 km than at 5 km (p = 0.003), and significantly greater at 15km than at 10 km (p = 0.003), as well as at 5 km (p < 0.003). Finally, the RPE at 20 km was significantly greater than at 15 km, 10 km and 5 km (p < 0.0001) (Figure 3A). The values for the HS (Figure 3B) peaked during the first half of the event, with an average of 2.91 at 5 km and 2.75 at 10 km.

Rate of Perceived Exertion (RPE) and the Hazard Score (HS). (A) Changes in Rate of Perceived Exertion; (B) Individual Hazard Score (continuous line) and sample mean (filled circle). Data expressed in mean ± SD. Key: (a) significantly greater than 5 km; (b) significantly greater than 5 km and 10 km; (c) significantly greater than 5 km, 10 km and 15 km; p < 0.05.
For the cfDNA (Figure 4A), there was no statistical difference between immediate (485.2 ± 324.1) and 30 minutes (293.0 ± 68.1) after the 20TT compared with pre-exercise measurements (423.1 ± 230.2) (p = 0.33). The CMJ (p = 0.17) and the SJ (p = 0.11) performance did not show statistically significant changes 30 minutes after the 20TT. Muscle soreness (Figure 4C) was significantly lower 30 minutes (20.93 ± 5.85) after the 20TT compared with the pre-exercise assessment (27.1 ± 5.0; p = 0.0007). Range of motion after 30 minutes (121.0 ± 5.6) was significantly lower compared with pre-exercise (125.4 ± 2.8; P = 0.01) (Figure 4D). The thigh circumference after 30 minutes was higher than the basal measurement (55.7 ± 2.0 vs. 55.4 ± 2.1 cm; p = 0.003).

Cell-free DNA and Muscle Function markers. Changes in Cell-free DNA (cfDNA) (A), Squat jump (B), Muscle Soreness (C), Range of Motion (ROM) (D). Data expressed in mean ± SD. Key: (a) significantly smaller than pre-exercise; p < 0.05.
DISCUSSION
The objective of the present study was to characterize the self-selected pacing strategy of master cyclists during a simulated 20TT to assess the muscle function response and the cfDNA after exercise. The main findings of this study were: (1) Master cyclists chose a U-shape parabolic pacing strategy, with the RPE increasing linearly; (2) Participants spontaneously adopted high cadences (> 90rpm) during the 20TT; (3) Cyclists maintained an intensity above 85% of peak heart hate throughout the test, as indicated by the HR assessments; (4) Function muscle markers, including range of motion and muscle soreness, were significantly lower after the test. However, vertical jump performance and Cell-free DNA did not show a statistical difference 30 minutes after the 20TT.
The pacing strategy adopted in the cycling time trial events is of fundamental importance, as the rhythm pattern must be tailored to optimize individual performance17,18. In the present study, it was observed an initial high-power output (~13% above-average power) over the first 10-15% of the 20TT, followed by a decrease in intensity in the middle of the race, with a further increase in power during the final sprint (the last 10% of the distance). These findings support previous research demonstrating that a high-power output in cycling time trials improves performance in terms of finishing time as well as of mean power when compared to even- and slow-start strategies19,20. During cycling, the power output can be sustained using different combinations of pedal cadences21. In the present study, the master cyclists spontaneously adopted a high pedaling rate, with average values between 96-101 rpm. Experienced and professional cyclists also tend to prefer a high pedaling cadence close to >90 rpm22.
The selection of a self-pacing strategy during exercise involves a complex system, where muscular power output and exercise intensity are adjusted in the brain in an anticipatory way to prevent premature fatigue and catastrophic homeostatic disturbances1. Moreover, athletes adapt their race power through real-time comparisons of the current RPE with the desired level of strain for said distance or duration, based on a subconscious “template” that is modified in the brain according to previous experiences with exercise and feedback from different physiological systems, enabling the athlete to alter their pacing without entering fatigue23,24.
Furthermore, studies suggest that the product of momentary RPE and the fraction of remaining distance can provide an indication of pace alteration during individualized exercise, by applying a simple index (hazard score) combining these two predictors. This index represents the risk of entering premature fatigue and needing to slow down to avoid a competitive collapse24,25. The results of this study showed that, even with parabolic pacing, the momentary RPE increased proportionally to the distance to be covered, reaching maximum values at the end of the 20TT. These results are consistent with the literature that states that, when beginning with a higher-than-normal energy production, the power/speed generally decreases to sustain the RPE’s increase, as well as to counteract dramatic changes in homeostatic disturbances25,26. By the same token, the Hazard Score (HS), also used to predict the athletes’ pacing, indicates that values greater than 3.0 present a higher risk of early fatigue. The results found herein showed that the master athletes were close to the upper limit (2.9-5 km and 2.8-10 km) until the middle of the race, suggesting that the pace should be maintained because, if the intensity were increased, it could lead to premature fatigue and an inability to complete the 20TT. Coincidently, the results demonstrated a lower pressure pain threshold (-6.2 kg), indicating increased pain sensitivity. The muscle swelling increased slightly (0.3 cm) and knee range of motion reduced significantly (~ 4 degrees), while lower limb strength assessed by vertical jumps remained unaffected. Regardless of the abovementioned changes in the evaluated markers, this data is not only related to the mechanisms of strength reduction, as the literature has already demonstrated that exercise-induced muscle stress can promote alterations in muscle function11.
Finally, the literature has also established that the cfDNA increase immediately after exercise is an early predictor of exercise-induced performance decrement associated with muscle damage14. Additionally, during long-duration exercises or high-intensity workouts, the cfDNA is released slowly and gradually13-27. However, it was not possible to observe a statistical difference in the cfDNA levels after the 20TT. In this study, the exercise modality was performed with self-paced intensity and most of the time with constant load, implying that intensity is the primary variable influencing transient cfDNA increases.
CONCLUSION
In conclusion, the findings herein indicate that the U-shaped parabolic pacing profile with high cadences can be an optimal strategy for master athletes’ performance in cycling races of 20TT, as it did not impair muscle function.
-
How to cite this article
Andreatta MV, Barauna VG, Lopes ALC, Silvatti AP, Leite RD. Muscle function response and cell-free DNA after the self-paced cycling time trial in master athletes. Rev Bras Cineantropom Desempenho Hum 2025, 27:e99458. DOI: https://doi.org/10.1590/1980-0037.2025v27e99458
-
Compliance with ethical standards
-
Funding
This research did not receive any specific grants from funding agencies by the public, commercial or not-for-profit sectors. This study was funded by the authors.
-
Ethical approval
Ethical approval was obtained from the local Human Research Ethics Committee – Universidade Federal de Viçosa under the protocol No. 59773616.0.0000.5153, in accordance with the standards set by the Declaration of Helsinki.
REFERENCES
-
1 Abbiss CR, Laursen PB. Describing and understanding pacing strategies during athletic competition. Sports Med. 2008;38(3):239-52. http://doi.org/10.2165/00007256-200838030-00004 PMid:18278984.
» http://doi.org/10.2165/00007256-200838030-00004 -
2 Atkinson G, Peacock O, St Clair Gibson A, Tucker R. Distribution of power output during cycling. Sports Med. 2007;37(8):647-67. http://doi.org/10.2165/00007256-200737080-00001 PMid:17645369.
» http://doi.org/10.2165/00007256-200737080-00001 -
3 Chaffin ME, Berg K, Zuniga J, Hanumanthu VS. Pacing pattern in a 30-minute maximal cycling test. J Strength Cond Res. 2008;22(6):2011-7. http://doi.org/10.1519/JSC.0b013e31818751b9 PMid:18978608.
» http://doi.org/10.1519/JSC.0b013e31818751b9 -
4 Thomas K, Stone MR, Thompson KG, St Clair Gibson A, Ansley L. The effect of self- even- and variable-pacing strategies on the physiological and perceptual response to cycling. Eur J Appl Physiol. 2012;112(8):3069-78. http://doi.org/10.1007/s00421-011-2281-9 PMid:22194003.
» http://doi.org/10.1007/s00421-011-2281-9 -
5 Albertus Y, Tucker R, St. Clair Gibson A, Lambert EV, Hampson DB, Noakes TD. Effect of distance feedback on pacing strategy and perceived exertion during cycling. Med Sci Sports Exerc. 2005;37(3):461-8. http://doi.org/10.1249/01.MSS.0000155700.72702.76 PMid:15741846.
» http://doi.org/10.1249/01.MSS.0000155700.72702.76 -
6 Smits BLM, Pepping GJ, Hettinga FJ. Pacing and decision making in sport and exercise: the roles of perception and action in the regulation of exercise intensity. Sports Med. 2014;44(6):763-75. http://doi.org/10.1007/s40279-014-0163-0 PMid:24706362.
» http://doi.org/10.1007/s40279-014-0163-0 -
7 Roelands B, Koning J, Foster C, Hettinga F, Meeusen R. Neurophysiological determinants of theoretical concepts and mechanisms involved in pacing. Sports Med. 2013;43(5):301-11. http://doi.org/10.1007/s40279-013-0030-4 PMid:23456493.
» http://doi.org/10.1007/s40279-013-0030-4 -
8 Cohen J, Reiner B, Foster C, Koning JJ, Wright G, Doberstein ST, et al. Breaking away: effects of nonuniform pacing on power output and growth of rating of perceived exertion. Int J Sports Physiol Perform. 2013;8(4):352-7. http://doi.org/10.1123/ijspp.8.4.352 PMid:23070854.
» http://doi.org/10.1123/ijspp.8.4.352 -
9 Koning JJ, Foster C, Bakkum A, Kloppenburg S, Thiel C, Joseph T, et al. Regulation of pacing strategy during athletic competition. PLoS One. 2011;6(1):e15863. http://doi.org/10.1371/journal.pone.0015863 PMid:21283744.
» http://doi.org/10.1371/journal.pone.0015863 -
10 Enoka RM, Duchateau J. Muscle fatigue: what, why and how it influences muscle function. J Physiol. 2008;586(1):11-23. http://doi.org/10.1113/jphysiol.2007.139477 PMid:17702815.
» http://doi.org/10.1113/jphysiol.2007.139477 -
11 Knicker AJ, Renshaw I, Oldham ARH, Cairns SP. Interactive processes link the multiple symptoms of fatigue in sport competition. Sports Med. 2011;41(4):307-28. http://doi.org/10.2165/11586070-000000000-00000 PMid:21425889.
» http://doi.org/10.2165/11586070-000000000-00000 -
12 Millet GY, Martin V, Lattier G, Ballay Y. Mechanisms contributing to knee extensor strength loss after prolonged running exercise. J Appl Physiol. 2003;94(1):193-8. http://doi.org/10.1152/japplphysiol.00600.2002 PMid:12391039.
» http://doi.org/10.1152/japplphysiol.00600.2002 -
13 Tug S, Mehdorn M, Helmig S, Breitbach S, Ehlert T, Simon P. Exploring the potential of cell-free-DNA measurements after an exhaustive cycle-ergometer test as a marker for performance-related parameters. Int J Sports Physiol Perform. 2017;12(5):597-604. http://doi.org/10.1123/ijspp.2016-0157 PMid:27617485.
» http://doi.org/10.1123/ijspp.2016-0157 -
14 Andreatta MV, Curty VM, Coutinho JVS, Santos MÂA, Vassallo PF, Sousa NF, et al. Cell-free DNA as an earlier predictor of exercise-induced performance decrement related to muscle damage. Int J Sports Physiol Perform. 2018;13(7):953-6. http://doi.org/10.1123/ijspp.2017-0421 PMid:29182414.
» http://doi.org/10.1123/ijspp.2017-0421 -
15 Binkley S, Foster C, Cortis C, Koning JJ, Dodge C, Doberstein ST, et al. Summated hazard score as a powerful predictor of fatigue in relation to pacing strategy. Int J Environ Res Public Health. 2021;18(4):1984. http://doi.org/10.3390/ijerph18041984 PMid:33670775.
» http://doi.org/10.3390/ijerph18041984 -
16 Fahs CA, Loenneke JP, Thiebaud RS, Rossow LM, Kim D, Abe T, et al. Muscular adaptations to fatiguing exercise with and without blood flow restriction. Clin Physiol Funct Imaging. 2015;35(3):167-76. http://doi.org/10.1111/cpf.12141 PMid:24612120.
» http://doi.org/10.1111/cpf.12141 -
17 Roelands B, Koning J, Foster C, Hettinga F, Meeusen R. Neurophysiological determinants of theoretical concepts and mechanisms involved in pacing. Sports Med. 2013;43(5):301-11. http://doi.org/10.1007/s40279-013-0030-4 PMid:23456493.
» http://doi.org/10.1007/s40279-013-0030-4 -
18 Bertuzzi R, Lima-Silva AE, Pires FO, Damasceno MV, Bueno S, Pasqua LA, et al. Pacing strategy determinants during a 10-km running time trial: contributions of perceived effort, physiological, and muscular parameters. J Strength Cond. 2014;28(6):1688-96. http://doi.org/10.1519/JSC.0000000000000314 PMid:24343329.
» http://doi.org/10.1519/JSC.0000000000000314 -
19 Foster C, Koning JJ, Hettinga F, Lampen J, La Clair KL, Dodge C, et al. Pattern of energy expenditure during simulated competition. Med Sci Sports Exerc. 2003;35(5):826-31. http://doi.org/10.1249/01.MSS.0000065001.17658.68 PMid:12750593.
» http://doi.org/10.1249/01.MSS.0000065001.17658.68 -
20 Aisbett B, Le Rossignol P, McConell GK, Abbiss CR, Snow R. Effects of starting strategy on 5-min cycling time-trial performance. J Sports Sci. 2009;27(11):1201-9. http://doi.org/10.1080/02640410903114372 PMid:19724963.
» http://doi.org/10.1080/02640410903114372 -
21 Lepers R, Hausswirth C, Maffiuletti N, Brisswalter J, van Hoecke J. Evidence of neuromuscular fatigue after prolonged cycling exercise. Med Sci Sports Exerc. 2000;32(11):1880-6. http://doi.org/10.1097/00005768-200011000-00010 PMid:11079517.
» http://doi.org/10.1097/00005768-200011000-00010 -
22 Padilla S, Mujika I, Orbañanos J, Angulo F. Exercise intensity during competition time trials in professional road cycling. Med Sci Sports Exerc. 2000;32(4):850-6. http://doi.org/10.1097/00005768-200004000-00019 PMid:10776906.
» http://doi.org/10.1097/00005768-200004000-00019 -
23 Tucker R. The anticipatory regulation of performance: the physiological basis for pacing strategies and the development of a perception-based model for exercise performance. Br J Sports Med. 2009;43(6):392-400. http://doi.org/10.1136/bjsm.2008.050799 PMid:19224911.
» http://doi.org/10.1136/bjsm.2008.050799 -
24 Koning JJ, Foster C, Bakkum A, Kloppenburg S, Thiel C, Joseph T, et al. Regulation of pacing strategy during athletic competition. PLoS One. 2011;6(1):e15863. http://doi.org/10.1371/journal.pone.0015863 PMid:21283744.
» http://doi.org/10.1371/journal.pone.0015863 -
25 Binkley S, Foster C, Cortis C, Koning JJ, Dodge C, Doberstein ST, et al. Summated hazard score as a powerful predictor of fatigue in relation to pacing strategy. Int J Environ Res Public Health. 2021;18(4):1984. http://doi.org/10.3390/ijerph18041984 PMid:33670775.
» http://doi.org/10.3390/ijerph18041984 -
26 Joseph T, Johnson B, Battista RA, Wright G, Dodge C, Porcari JP, et al. Perception of fatigue during simulated competition. Med Sci Sports Exerc. 2008;40(2):381-6. http://doi.org/10.1249/mss.0b013e31815a83f6 PMid:18202562.
» http://doi.org/10.1249/mss.0b013e31815a83f6 -
27 Haller N, Helmig S, Taenny P, Petry J, Schmidt S, Simon P. Circulating, cell-free DNA as a marker for exercise load in intermittent sports. PLoS One. 2018;13(1):e0191915. http://doi.org/10.1371/journal.pone.0191915 PMid:29370268.
» http://doi.org/10.1371/journal.pone.0191915