 Accuracy of head circumference measurement: an analysis using different measuring tapes
Abstract
Abstract The aim of this study was to determine the accuracy of measuring tapes and head circumference measurements, analyzing four commercial measuring tapes available on the market. The research included technical analysis of four measuring tape models in the laboratory and their practical application on a training mannequin. Each tape was measured 10 times at two intervals with a calibrated digital caliper in the laboratory. The absolute and relative technical error of measurement (TEM) was calculated, considering deviations between measurements and true values. Tape 3 had the highest TEM, while tape 4 stood out for greater accuracy. The practical application had a training workshop with 25 students. Each participant measured the head circumference three times with each tape and compared them to a standard evaluator’s measurements. Tapes 2 and 4 had more accurate results, while tapes 1 and 3 had greater TEM. Regarding usability, tape 3 was the most difficult to handle, while tapes 1 and 4 were more practical (although tape 1 was considered long), and tape 3 was difficult to fit. It is crucial to standardize measuring tapes and techniques to ensure accurate and consistent measurements. It is recommended to use tapes made of non-stretchable material and to respect the usage time. It is also essential to train professionals constantly for multidisciplinary monitoring, ensuring accurate measures and the effective use of Personal Child Health Records to monitor child growth.
Key words:
Anthropometry; Child development; Growth; Newborn; Pediatrics
Resumo
Resumo Objetivou-se determinar a precisão de fitas métricas e de medidas de PC. Foram analisadas quatro fitas comerciais disponíveis no mercado. A pesquisa incluiu análise técnica em laboratório e aplicação prática em um boneco didático, utilizando quatro modelos de fitas métricas. No laboratório, cada fita foi medida dez vezes em dois intervalos com um paquímetro digital calibrado. Calculou-se o erro técnico de medição (ETM) absoluto e relativo, considerando desvios entre as medições e o valor verdadeiro. A fita 3 apresentou o maior ETM, enquanto a fita 4 destacou-se pela maior precisão. Na aplicação prática, 25 estudantes participaram de uma oficina de treinamento. Cada participante realizou três medições para cada fita, comparadas às medidas de um avaliador padrão. As fitas 2 e 4 apresentaram melhores resultados de precisão, enquanto as fitas 1 e 3 tiveram maior ETM. Quanto à usabilidade, a fita 3 foi considerada a mais difícil de manusear, enquanto as fitas 1 e 4 foram mais práticas, apesar de a fita 1 ser considerada longa e a fita 3 apresentar dificuldades no encaixe. A padronização das fitas métricas e das técnicas de aferição é essencial para garantir medidas acuradas e consistentes. Recomenda-se o uso de fitas de material não extensível e respeito ao tempo de uso. A qualificação constante dos profissionais é fundamental para o acompanhamento multiprofissional, garantindo a precisão das medidas e a utilização eficaz da Caderneta da Criança no monitoramento do crescimento infantil.
Palavras-chave:
Antropometria; Desenvolvimento infantil; Crescimento; Recém-nascido; Pediatria
INTRODUCTION
Child growth is a dynamic, continuous, crucial process influencing physical, cognitive, and emotional development. It is one of the main indicators of health in childhood, influenced by a combination of intrinsic factors (e.g., genetic potential and hormone production) and extrinsic factors (e.g., nutrition, protection against diseases, and adequate sleep)1,2.
Therefore, it is essential to monitor growth systematically. The most appropriate method is to record data such as head circumference (HC), weight, height, and body mass index (BMI) periodically on the Personal Child Health Record’s growth charts. The measures marked on the charts show the child's development over time and identify possible deviations, allowing them to be addressed and treated early1.
In this context, the HC-for-age anthropometric indicator stands out as a logical and accurate measure to assess the risk of neurodevelopmental delays in children3. It can also be used for developmental screening assessments at individual and population levels, especially when performance-based tests are not feasible4.
Thus, it is essential to monitor HC because it is directly related to the speed of brain growth, helping to diagnose developmental changes in combination with medical history surveys and physical examinations5. Moreover, correct measurements may provide more accurate risks of neurodevelopmental delays in young children3.
Although the importance of accurate HC measurement is recognized, professionals often use different measuring tape types and models, many of which are not specific to health use. It is essential to compare measuring tapes, as small differences can influence the diagnosis of conditions such as micro or macrocephaly and affect the identification of child developmental delays. Measurement errors can result in further costs for additional tests and stress families6. Ensuring more accurate measurements can prevent incorrect diagnoses and avoid unnecessary consequences, such as exposure to radiological exams7. Hence, this study aimed to determine the accuracy of measuring tapes and HC measurements.
METHODS
This quantitative observational study is linked to an anchor project entitled, “Qualification of multidisciplinary health monitoring regarding child growth and development in the central region of Rio Grande do Sul, Brazil”, approved by the Research Ethics Committee under evaluation report 4.364.999.
The study was organized in stages, as follows: acquiring three measuring tapes of four different models and brands; analyzing the tapes’ accuracy in a technical laboratory; inviting and qualifying volunteers for HC anthropometry; and taking HC measurements.
The accuracy of the three measuring tapes of each brand and model was analyzed by comparing the metrics in millimeters and centimeters with a standard caliper. The study did not use thin steel tapes because, despite being inextensible, they may not be safe for measuring newborns’ HC.
The tapes were analyzed in a biomedical engineering laboratory with controlled temperature and humidity, where they remained for 24 hours to avoid expansion or contraction errors. Each tape was measured 10 times, five in the 0-15 cm range (Q1) and five in the 45-60 cm range (Q3), ensuring greater standardization.
After the measurements, the researchers calculated the average per tape and between tapes of the same type. The same operator used a calibrated digital caliper for the measurements throughout the study. The technical error of measurement (TEM) was calculated per tape to compare measurements. The true value (TV), obtained with the calibrated caliper, was the parameter for comparing the tapes.
The method of differences obtained the tapes’ TEM, expressed by the standard deviation between the TV and the measurements per tape.
The calculation can be described as follows8:
-
1st stage: Calculating the mean measurement per tape for Q1 and Q3, and then the difference between the TV and the mean per quadrant. This value is the mean deviation of the measurement per quadrant.
-
2nd stage: Squaring the mean deviation values of the measurement.
-
3rd stage: Applying Equation 1 using the values obtained in the second stage.
In which: = sum of the mean squared deviations of the measurement; n = number of measurements taken per quadrant; i = number of deviations.
-
4th stage: Calculating the relative TEM based on the absolute, using Equation 2.
In which: TEMq = Absolute technical error of measurement per quadrant, per tape; MVTq = Mean value of measurements per quadrant, per tape.
After comparing the tape metrics, the authors taught a 4-hour training workshop for volunteers from undergraduate health programs at a higher education institution. It covered the importance of measuring HC as a marker of child growth and development, measurement accuracy and standardization, and HC assessment and diagnosis using the curves in the Personal Child Health Record9. The training aimed to standardize HC measurements, following the recommendations of the Brazilian Food and Nutrition Surveillance System (SISVAN)10.
After the training workshop, participants were invited to sign an informed consent form and take anthropometric measures on a training mannequin. They measured the mannequin’s HC using four different measuring tape models and brands (Figure 1). Participants took measures in triplicate and individually to avoid interference from another evaluator during the measurements.

Examples of measuring tapes used to analyze their accuracy and measure the head circumference (HC). Note. Tape 1 (Flexible measuring tapes), 2 (Brazilian HC measuring tape), 3 (telescopic body measuring tape), and 4 (European HC measuring tape).
The volunteer evaluators recorded the measurements on a form prepared by the authors, containing information on gender, undergraduate program, triplicate measurements with each of the four tapes, level of difficulty to measure (on a Likert scale ranging from 0 to 5, where five was the most difficult), and observations on handling the tapes. An experienced professional specialized in the field also measured the mannequin’s HC – these measurements were used as the standard to evaluate the results.
The method of differences was used to obtain the evaluators' TEM, expressed by the standard deviation between the volunteers' measurements and the evaluator's standard value. The calculation is described as follows8:
-
1st stage: Calculating the mean measurement per tape per participant, and then the difference between the mean value per tape and the evaluator's standard value, resulting in the mean deviation of the measurement per participant.
-
2nd stage: Squaring the mean deviations of the measurement.
-
3rd stage: Applying Equation 3 based on the values obtained in the second stage.
In which: = sum of the mean squared deviations of the measurement; n = number of study volunteers; i = number of deviations.
-
4th stage: Calculating the relative TEM based on the absolute TEM, using Equation 4. This calculation considered the participants' mean measurement per tape, corresponding to the mean measurement of the 25 participants with tapes 1, 2, 3, and 4.
In which: TEM = Technical error of the measurement; MVT = Mean value of participants' measurements per tape.
The researchers performed descriptive statistics and calculated the content value index (CVI) to express the response data regarding tape usability11. For the CVI, responses with values of “4” and “5” per tape were counted and divided by the total number of respondents. This calculation assessed the number of responses expressing difficulty in using the tapes.
Analysis of variance (ANOVA) compared quantitative variables with symmetrical distribution, completed with Tukey's post-hoc test. The analyses were performed using Origin software.
RESULTS
The researchers initially analyzed the measurement accuracy and quality control dimension with the tapes’ TEM in the biomedical engineering laboratory. Figure 2 shows the percentages – tape 3 had the highest TEM percentage, followed by tape 1.
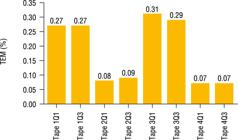
Percentage of the tapes’ technical error of measurement according to their quadrants. Note. TEM, technical error of measurement; Q1, quadrant 1; Q3, quadrant 3.
After analyzing the tapes, the volunteers – 25 students participating in this stage, 7 (28%) males and 18 (72%) females – took measures on a training mannequin. The participants were from undergraduate health programs – 12 (48%) from Medicine, eight (32%) from Nursing, and 5 (20%) from Nutrition.
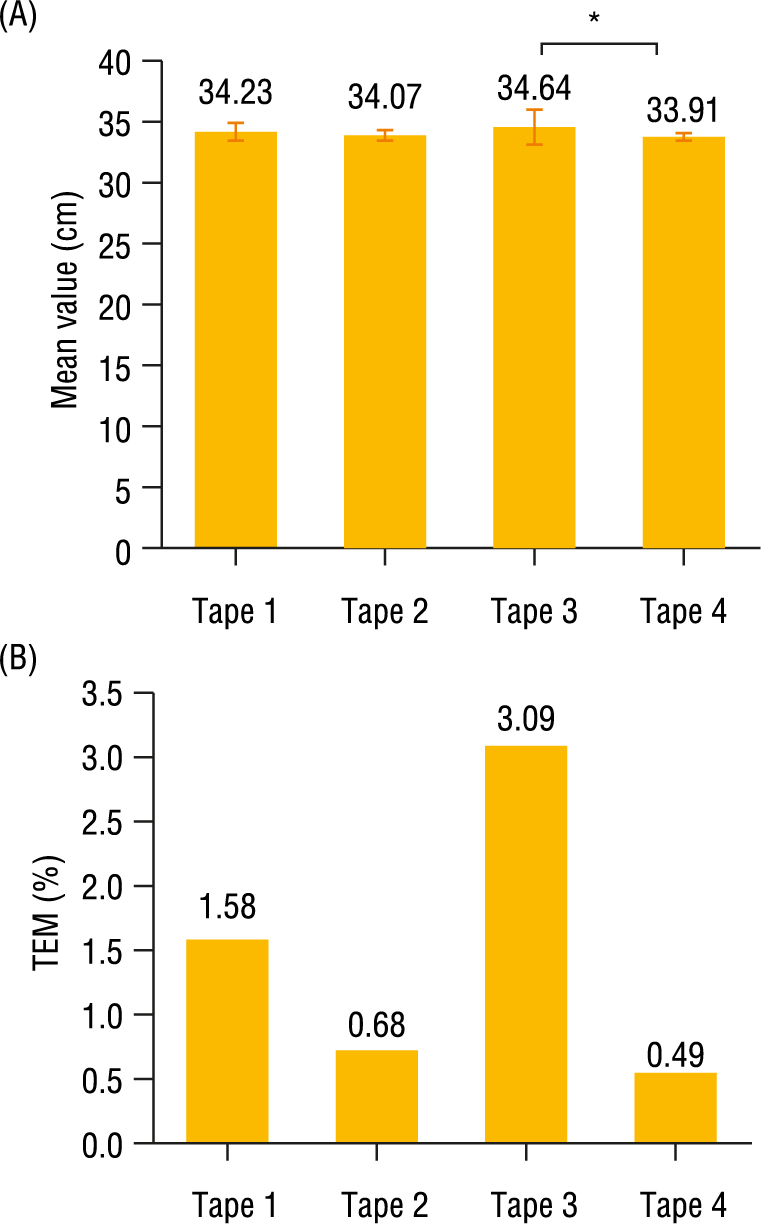
Figure 3 shows the variation in the evaluators' measurements, with a statistically significant difference between the means of tapes 3 and 4 (p > 0.05) – i.e., there was a difference of 2.10% between them. When comparing the TEM percentages of the evaluators' measurements with the standard evaluator (i.e., the accuracy in taking and retaking anthropometric measures), the highest percentages were obtained in tapes 1 and 3.

Evaluators’ mean head circumference measurement (A) and the percentage of the evaluators' technical error of measurement compared to the standard measurement (B). Note. Analysis of variance (ANOVA), Tukey post hoc. *p < 0.05.
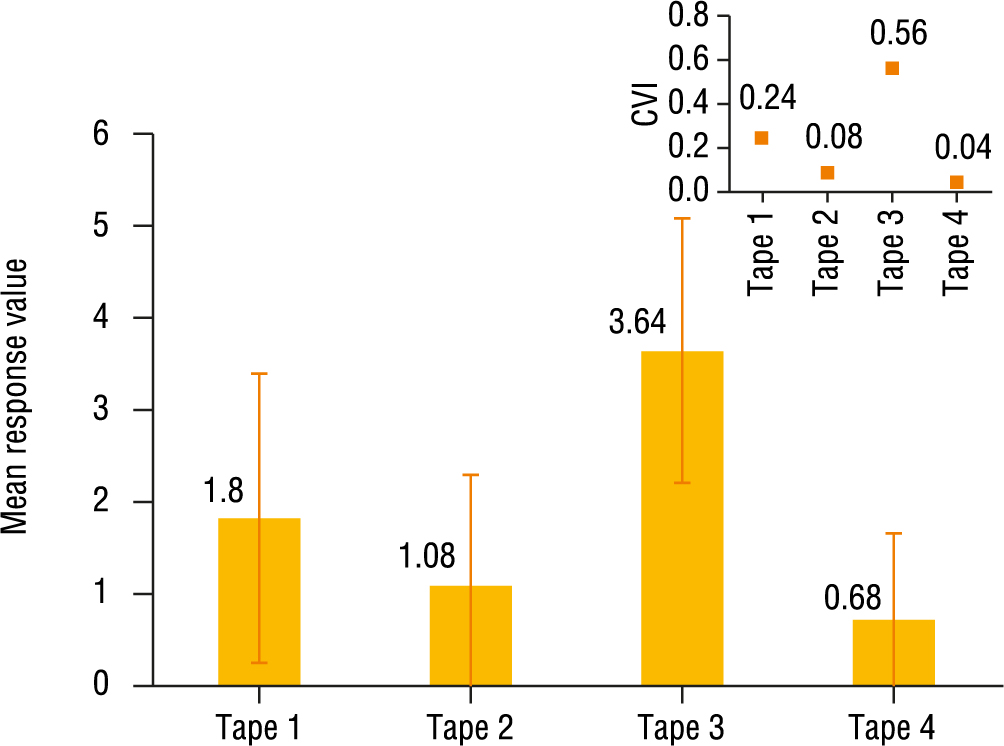
The analysis of the level of difficulty to measure (on a scale from 0 to 5, in which 5 was the most difficult) showed that tape 3 had the highest score in the difficulty level classification by both the mean value and the CVI. The results are shown in Figure 4.

Presentation of the average responses regarding the level of difficulty in measuring head circumference with each of the tapes. Note. CVI, content value index.
Furthermore, volunteers could write observations on tape handling. The responses were categorized into handling indications and model indicators. There was a higher frequency of responses indicating ease in handling tapes 4 and 1 and difficulty in reading tape 3. Regarding the model indicators, tape 1 was considered too long, and tape 3 was difficult to fit.
DISCUSSION
This study selected different types of measuring tapes, considering their material and design, to analyze their measurement accuracy and quality control dimension. Tape 3 had the highest TEM percentage, followed by tape 1. The tapes analyzed are commonly used in healthcare settings and are known to directly impact the diagnosis of diseases. According to RDC no. 546, the characteristics and performance of healthcare products must not compromise the patients’ and consumers’ clinical condition and safety12.
Studies on the accuracy and quality control dimension of tapes are scarce. Thakkar et al.13 compared the measurement accuracy of extensible and inextensible tapes in 35 and 50-cm squares. The research was conducted in a hospital in India, and the measurements were performed on children aged 1 month to 5 years. After the analyses, the authors found no difference between measurements using new tapes. However, after using the tapes for 4 months and from 5 to 8 months, they detected differences of 0.1 to 0.4 cm and 0.5 to 1.0 cm, respectively, according to the months of use.
The present study analyzed tapes commonly used by pediatric health professionals, but the length of the tape was not an exclusion criterion, although Devakumar et al.14 recommended using non-stretchable tapes for robust measures. This decision was considered because the recommended non-stretchable anthropometric tapes are often made of metal, which could injure newborns.
In the study by Conkle et al.15, the authors used data from the Body Imaging for Nutritional Assessment Study (BINA) and compared a 3D imaging system with non-digital manual measurements. This study makes recommendations on the elasticity of measuring tapes, which can introduce significant errors in HC measurements, resulting in inconsistent and inaccurate readings. They also highlight that overly stretched tapes often underestimate the true HC, while loose tapes can overestimate it. Corroborating the authors, a cross-sectional study conducted in the United Kingdom showed that measuring with a tight or loose tape can induce a difference of 0.4 standard deviations (or 0.4-0.5 cm)16. To mitigate this problem, they recommend using non-elastic tapes with greater stability and accuracy.
Therefore, it is essential to evaluate not only the tape types but also the measurement technique – i.e., the measurement position, tension, and reading. For this reason, the volunteers from the health programs participated in a qualification workshop to improve the quality of the measurements collected. Nonetheless, the measurements with tapes 3 and 4 varied, even though the variability in cranial anatomies was minimized by using a training mannequin.
Another aspect to be highlighted is the systematization of the correct and standardized HC measurement. The study found a significant difference between the standard and the volunteers’ measurements. Conkle et al.15 emphasize the importance of specific training and procedure manuals to minimize technical errors in anthropometric measures.
Furthermore, taking repeated measures and providing real-time feedback are effective strategies for increasing measurement accuracy and reliability. These practices not only improve the quality of the data collected but also help identify and correct discrepancies, contributing to consistency and accuracy in child growth assessments. Implementing these approaches is crucial to ensuring that measurements are performed consistently and accurately, facilitating more reliable clinical diagnoses and interventions15.
The difference between measures taken by different evaluators stands out, even after qualification. Conkle et al.15 add that manual measurements are susceptible to human error, as there is still a gap in training and awareness of teams on how to take HC measures correctly15. The results indicate that, despite their training, factors such as inconsistency between evaluators, external time pressures, and fatigue can lead to errors. Additionally, the use of 3D technology proved to be more consistent, highlighting the need for investments in precision technologies and the importance of continuous reviews in the qualification of professionals who take manual measurements.
One way to ensure accuracy is to check the differences between evaluators. In this sense, Thakkar et al.13 point out that a variation in measurements greater than or equal to 0.5 cm between evaluators should not be clinically accepted. The authors reinforce the importance of accurate measures since deviations above this value can compromise the reliability of the results and negatively impact the diagnosis and clinical treatment. However, another study that evaluated pediatric patients using new and used tapes found an inter-observer variability above 1 cm in 9% of the measurements17.
Regarding the evaluators’ difficulty in handling the different tapes, it was observed that tape 3 had the worst evaluation with both the mean value and the CVI. The main difficulty described was in reading the measurement.
Similar findings were highlighted by Sicotte et al.18, who mentioned difficulties in using anthropometric tapes, especially in large-scale studies or those performed by inexperienced individuals. Measures such as circumferences and skinfolds often present reliability problems due to the subjective application and reading of values. The lack of standardization, continuous training of observers, and variations in the participants’ physical state (e.g., hydration and nutrition) aggravate the problem. Moreover, differences in equipment, such as variations between calipers of the same brand, can compromise accuracy. In contexts with limited resources, these challenges are amplified by the difficulty of maintaining adequate training and constant supervision.
It is also necessary to consider the diagnosis based on HC measurements. The measurements reported in the Brisa-RP and Intergrowth-21st cohorts were assessed and compared, identifying a parallel trajectory between them in the 3rd percentile, up to 40 weeks of gestational age. However, preterm newborns had a variation greater than 1 cm with the Brisa-RP reference, which may influence an overestimation of microcephaly19.
This study is one of the few that analyzed the accuracy and quality control dimension of tape measures used to measure HC. Its main limitations include the lack of studies indicating the main tape measures used to measure HC; hence, it selected tape measures based on market availability and the researchers' experience. Moreover, there is a lack of research on the correct HC measurement and TEM. Despite being a marker of child development related to the child's cognition and physiology, this measurement does not receive the same importance given to more common measures such as weight and height.
CONCLUSION
Thus, it is necessary to standardize measuring tapes for correct HC measurements. They should also be made of non-stretchable material to reduce possible TEM, and their time of use must be respected to avoid deformity. Likewise, the measurement must be standardized to monitor the child's growth, and professionals need constant qualification, as various professionals monitor children throughout their development. Well-trained ones can guarantee standard and accurate measurements for adequate multidisciplinary monitoring recorded in the Personal Child Health Record.
-
How to cite this article
Volpato R, Prá PJ, Rangel RF, Rodrigues Júnior LF, Mussoi TD, Benedetti FJ. Accuracy of head circumference measurement: an analysis using different measuring tapes. Rev Bras Cineantropom Desempenho Hum 2025, 27:e105314. DOI: https://doi.org/10.1590/1980-0037.2025v27e105314
-
Compliance with ethical standards
-
Funding
This research did not receive any specific grant from funding agencies in the public, commercial, or not-for-profit sectors. This study was funded by the authors.
-
Data Availability Statement
Research data is only available upon request.
-
Ethical approval
Ethical approval was obtained from the local Human Research Ethics Committee –Universidade Franciscana and the protocol (no. 4.364.999) was written in accordance with the standards set by the Declaration of Helsinki.
REFERENCES
- 1 Brasil. Ministério da Saúde. Secretaria de Atenção à Saúde. Departamento de Ações Programáticas Estratégicas. Política Nacional de Atenção Integral à Saúde da Criança: orientações para implementação. Brasília: Ministério da Saúde; 2018.
- 2 Jezus SV, Pereira BCSN, Bastida FF, Masochini RG, Cunha AN. Influences and interferences in child growth and development. Sci Electron Arch. 2018;11:93-8.
-
3 Lamb MM, Connery AK, Colbert AM, Bauer D, Olson D, Paniagua-Avila A, et al. Anthropometric proxies for child neurodevelopment in low-resource settings: length- or height-for-age, head circumference or both? J Dev Orig Health Dis. 2023;14(1):61-9. http://doi.org/10.1017/S2040174422000423 PMid:35844103.
» http://doi.org/10.1017/S2040174422000423 -
4 Connery AK, Lamb MM, Colbert AM, Bauer D, Olson D, Paniagua-Avila A, et al. A prospective cohort study of head circumference and its association with neurodevelopmental outcomes in infants and young children in rural Guatemala. J Dev Orig Health Dis. 2022;13(6):779-86. http://doi.org/10.1017/S204017442200023X PMid:35450541.
» http://doi.org/10.1017/S204017442200023X - 5 Sociedade Brasileira de Pediatria. Departamento Científico de Nutrologia. Manual de avaliação nutricional. 2ª ed. atual. São Paulo: SBP; 2021. 120 p.
-
6 Victora CG, Schuler-Faccini L, Matijasevich A, Ribeiro E, Pessoa A, Barros FC. Microcephaly in Brazil: How to interpret reported numbers? Lancet. 2016;387(10019):621-4. http://doi.org/10.1016/S0140-6736(16)00273-7 PMid:26864961.
» http://doi.org/10.1016/S0140-6736(16)00273-7 -
7 Davies HE, Wathen CG, Gleeson FV. The risks of radiation exposure related to diagnostic imaging and how to minimise them. BMJ. 2011;342:d947. http://doi.org/10.1136/bmj.d947 PMid:21355025.
» http://doi.org/10.1136/bmj.d947 -
8 Silva DAS, Pelegrini A, Pires-Neto CS, Vieira MFS, Petroski EL. O antropometrista na busca de dados mais confiáveis. Rev Bras Cineantropom Desempenho Hum. 2010;13:82-5. http://doi.org/10.5007/1980-0037.2011v13n1p82
» http://doi.org/10.5007/1980-0037.2011v13n1p82 - 9 Brasil. Ministério da Saúde. Secretaria de Atenção Primária à Saúde. Departamento de Gestão do Cuidado Integral. Coordenação-Geral de Articulação do Cuidado Integral. Coordenação de Atenção à Saúde da Criança e do Adolescente. Caderneta da Criança: passaporte da cidadania. 6ª ed. Brasília: Ministério da Saúde; 2023.
-
10 Brasil. Ministério da Saúde. Secretaria de Atenção à Saúde. Orientações para a coleta e análise de dados antropométricos: SISVAN – Sistema de Vigilância Alimentar e Nutricional [Internet]. Brasília: Ministério da Saúde; 2011 [cited 2025 Apr 7]. Available from: http://bvsms.saude.gov.br
» http://bvsms.saude.gov.br -
11 Alexandre NMC, Coluci MZO. Validade de conteúdo nos processos de construção e adaptação de instrumentos de medidas. Cien Saude Colet. 2011;16(7):3061-8. http://doi.org/10.1590/S1413-81232011000800006 PMid:21808894.
» http://doi.org/10.1590/S1413-81232011000800006 -
12 Brasil. Agência Nacional de Vigilância Sanitária. Resolução da Diretoria Colegiada - RDC nº 546, de 23 de dezembro de 2021. Dispõe sobre as boas práticas de fabricação de produtos de saúde [Internet]. Diário Oficial da União; Brasília; 2021 [cited 2025 Apr 7]. Available from: https://cbdl.org.br/wp-content/uploads/2022/10/RDC-No-546_2021-Seguranca-e-eficacia-para-produtos-para-saude.pdf
» https://cbdl.org.br/wp-content/uploads/2022/10/RDC-No-546_2021-Seguranca-e-eficacia-para-produtos-para-saude.pdf -
13 Thakkar PA, Yagnik K, Parmar NT, Das RR, Thakkar UP. Observer variability in head circumference measurement using routine versus non-stretchable tapes in children. J Nepal Paediatr Soc. 2018;37(3):238-43. http://doi.org/10.3126/jnps.v37i3.19556
» http://doi.org/10.3126/jnps.v37i3.19556 -
14 Devakumar D, Bamford A, Ferreira MU, Broad J, Rosch RE, Groce N, et al. Infectious causes of microcephaly: epidemiology, pathogenesis, diagnosis, and management. Lancet Infect Dis. 2018;18(1):e1-13. http://doi.org/10.1016/S1473-3099(17)30398-5 PMid:28844634.
» http://doi.org/10.1016/S1473-3099(17)30398-5 -
15 Conkle J, Ramakrishnan U, Flores-Ayala R, Suchdev PS, Martorell R. Improving the quality of child anthropometry: Manual anthropometry in the body imaging for nutritional assessment study (BINA). PLoS One. 2017;12(12):e0189332. http://doi.org/10.1371/journal.pone.0189332 PMid:29240796.
» http://doi.org/10.1371/journal.pone.0189332 -
16 Wright CM, Bremner M, Lip S, Symonds JD. Does measurement technique explain the mismatch between European head size and WHO charts? Arch Dis Child. 2017;102(7):639-43. http://doi.org/10.1136/archdischild-2016-311888 PMid:27986698.
» http://doi.org/10.1136/archdischild-2016-311888 -
17 Bartram JL, Rigby AS, Baxter PS. The “Lasso-o” tape: stretchability and observer variability in head circumference measurement. Arch Dis Child. 2005;90(8):820-1. http://doi.org/10.1136/adc.2004.063743 PMid:16040879.
» http://doi.org/10.1136/adc.2004.063743 -
18 Sicotte M, Ledoux M, Zunzunegui M-V, Ag Aboubacrine S, Nguyen V-K. Reliability of anthropometric measures in a longitudinal cohort of patients initiating ART in West Africa. BMC Med Res Methodol. 2010;10(1):102. http://doi.org/10.1186/1471-2288-10-102 PMid:20969785.
» http://doi.org/10.1186/1471-2288-10-102 -
19 Pimenta JRR, Grandi C, Aragon DC, Cardoso VC. Comparison of birth weight, length, and head circumference between the BRISA-RP and Intergrowth‐21st cohorts. J Pediatr. 2020;96(4):511-9. http://doi.org/10.1016/j.jped.2019.03.003 PMid:31026416.
» http://doi.org/10.1016/j.jped.2019.03.003
Edited by
-
Scientific Editor
Diego Augusto Santos Silva
Research data is only available upon request.