 Genetic Diversity of Native Chicken Populations and Red Jungle Fowl in Southern Thailand Based on Mitochondrial a DNA D-loop Region
ABSTRACT
The mtDNA D-loops of four chicken breeds (Betong, Khao Chang, Srivijaya Naked-Neck, and Dang) from the native chicken populations of Narathiwat province and Red jungle fowl from the southern region of Thailand were analyzed to assess their genetic diversity and genetic relationships. The 558 fragments of the mtDNA D-loop were genotyped using PCR, and 20 variation sites and 23 haplotypes were detected in 326 mtDNA D-loop sequences. The haplotype diversity and nucleotide diversity of the Red jungle fowl were 0.936 ± 0.034 and 0.00806 ± 0.00087, respectively. Thai native chicken populations had a haplotype diversity of 0.000 to 0.9050, and a nucleotide diversity of 0.00000 to 0.00856, thus revealing the high genetic diversity of the native Thai chicken breeds. Analysis of molecular variance indicated that most of the variation was within the population (78.20%). The results of the median-joining network and phylogenetic tree were consistent and revealed that Thai local chicken breeds and Red jungle fowl were divided into eight main haplogroups (A-F, H, and V). The greatest number of haplotypes was classified into haplogroup B (6 haplotypes), followed by haplogroup V (5 haplotypes). Moreover, there was no breed-specific haplogroup. These results suggest that the breeds likely originated from multiple matrilineal lines, and the mtDNA D-loops assessed in this study appear to lack breed specificity.
Keywords:
Thai indigenous chicken; mitochondrial DNA D-loop; genetic diversity; domestication
INTRODUCTION
In Thailand, indigenous chickens have a long history of adaptation to multiple farming environments and can be considered a genetically diverse population (Dorji et al., 2011; Mekchay et al., 2014), with unique chicken breeds for each region of the country. The southern region of Thailand is an area where native chickens, as well as other regional chicken breeds such as Betong, Khao Chang, Srivijaya Naked-Neck, and Dang chickens have been historically raised. Indigenous chicken breeds have characteristics such as the ability to resist pathogens and heat, and can be propagated in the rearing environments provided by smallholder farmers (Choprakarn & Wongpichet, 2007). However, most Thai chicken populations are raised in free-range backyard conditions by smallholder farmers (Hata et al., 2021) who might not have a systematic breeding system. Recent genomic studies have revealed concerning levels of genetic introgression from commercial breeds into indigenous populations. For instance, analysis of Chinese indigenous chickens showed extensive gene introgression from commercial broilers, ranging from 0.64% to 21.52% across different native breeds (Zhang et al., 2019). Similar patterns have been observed in other livestock species, where even modest levels of crossbreeding resulted in the substantial loss of private alleles within a few generations (Berthouly‐Salazar et al., 2012). If the genetic diversity of these native species is not preserved, their diversity may gradually disappear, putting them at risk of extinction (Groeneveld et al., 2010; FAO, 2015). Studying genetic diversity via population genetics analyses can elucidate the history of a species, origin of the livestock, and differences between species. This knowledge can provide a basis for planning the improvement of existing chicken breed programs and appropriate selection methodologies (Zhang et al., 2020). Mitochondrial DNA (mtDNA) has several distinctive characteristics: matrilineal inheritance, high copy number, non-recombination, and high variation. Furthermore, the D-loop region, which contains a noncoding region, is not under strong selective pressure. This characteristic allows for a better understanding of inheritance patterns and evolutionary mechanisms. These features make mtDNA a popular marker for genetic diversity, livestock origins, and phylogeny studies (Harrison, 1989; Galtier et al., 2009; El-Mahdy, 2012; Bhuiyan et al., 2013; Novelletto et al., 2016).
Previous research has investigated the history of domesticated chickens using mtDNA markers, the results of which initially suggested that all domestic breeds have a wild ancestor, the Red jungle fowl (Gallus gallus gallus) (Fumihito et al., 1994; Fumihito et al., 1996). However, further studies have found that the domestication of chickens likely involved multiple maternal lines in South Asia, Southeast Asia, and Southwest China (Liu et al., 2006; Miao et al., 2013). In addition, other Red jungle fowl subspecies may also be among the ancestors of the domestic chicken (Nishibori et al., 2005).
Southern Thailand has historically been an important region for native chicken conservation, with several unique breeds that hold both economic and cultural importance. A prime example is the Betong chicken, a native meat breed that commands a premium market price and enjoys high consumer demand. Originally brought over from China’s Guangxi Province by Chinese immigrants settling in Southern Thailand, Betong chickens have adapted to local conditions and now reach market weights of 2.2-2.5 kg. in approximately 6 months. These historical migration patterns, adaptation to local conditions, and the economic importance of such breeds make Southern Thailand a notable region for studying genetic diversity. Therefore, the objective of this study was to evaluate the genetic diversity and relationships of native chicken breeds in Southern Thailand, providing crucial information for their conservation and sustainable utilization.
MATERIALS AND METHODS
Sample collection and sampling populations
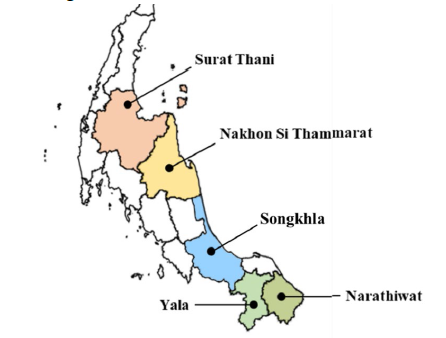
A total of 163 blood samples, including 144 blood samples were collected from four native chicken populations, namely: Betong chickens (BT, n=15) from the Department of Animal Sciences Farm, Faculty of Natural Resources, Prince of Songkla University, Songkla province; BT chickens (n=45) from three farms in Yala province; Srivijaya Naked-Neck chickens (SJ, n=25) from the Nakhon Si Thammarat Livestock Research and Breeding Center, Nakhon Si Thammarat province; Dang chickens (DA, n=23) from the Surat Thani Livestock Research and Breeding Center, Surat Thani province; Khao Chang chickens (KC, n=15) from a small-scale farmer in Surat Thani province; Thai native chicken populations from small-scale farmers (NW, n=21) in Narathiwat province. Additionally, 19 shank tissue samples were collected from Red jungle fowl (RJF) in Surat Thani province. The collection sites of the samples are shown in Figure 1. Blood samples were taken from the wing vein, and DNA was mixed with ethylenediaminetetraacetate acid (EDTA) as an anticoagulant, and stored at 4°C until use.

Sampling location of the Thai native chicken populations and Red jungle fowl in the Southern region of Thailand
DNA extraction, PCR amplification, and sequencing
Genomic DNA was extracted from all whole blood samples using the Thermo Science™ GeneJET Genomic DNA Purification Kit (Thermo Scientific, Waltham, MA, USA). Genomic DNA from shank tissues was extracted using E.Z.N.A.® Tissue DNA Kit (Omega bio-tek) and the DNA concentration and purity were measured using a Nanodrop Lite™ (Thermo Scientific). The final concentration of genomic DNA was adjusted to 20 ng/µL using TE buffer. PCR was used to amplify a 558-bp fragment from the mitochondrial D-loop region using the following primers: forward: 5’-TGCATGATCCAGGACACACT-3’ and reverse: 5’-ACTAGGATAGGACGCAACGC-3’ (Hoque et al., 2011). PCR amplification was performed in a 60 µL mixture containing 6 µL of genomic DNA (20 ng/µL), 6 µL of 10× buffer, 6 µL of 3 µM of each primer, 6 µL of 1 mM dNTP (Thermo Scientific), 4.8 µL of 25 mM MgCl2, 0.6 µL of 5 U Taq DNA polymerase (Thermo Scientific), and 24.6 µL of nuclease-free water. The PCR amplification protocol consisted of the following steps: 95°C for 5 min, followed by 35 cycles of 95°C for 45 s, 58°C for 30 s, 72°C for 45 s, and a final extension at 72°C for 5 min. PCR products were detected on a 1.5% agarose gel. The cycle sequencing reaction was performed using a Big Dye™ Terminator v3.1 Cycle Sequencing Kit (Applied Biosystems Inc., Foster City, California, USA), and the nucleotide sequences were determined using an ABI 3730xl DNA Analyzer (Applied Biosystems).
Data analysis
The DNA chromatograms of the sequenced samples were visually checked using a BioEdit sequence alignment editor (Hall, 1999) to identify and correct missing bases or insert gaps to maintain proper alignment before merging the forward and reverse sequences. All sequences were aligned with the Gallus gallus reference sequence (GenBank number: X52392.1) and edited using the ClustalW multiple alignment algorithm in MEGA11 (Tamura et al., 2021). The position of polymorphic sites, the number of polymorphic sites, and diversity parameters, including the number of haplotypes, haplotype diversity (Hd), nucleotide diversity (π), and Tajima’s D test, were estimated using DnaSP v.6 (Rozas et al., 2017). The same sequences were considered to be one haplotype. The obtained representative haplotypes of the mtDNA D-loop were submitted to GenBank (accession number: PQ801087-PQ801109). Genetic variation among and within breeds was estimated through an analysis of molecular variance (AMOVA) and pairwise fixation index (Fst) in PopART v1.7.2 software (Leigh & Bryant, 2015). The phylogenetic tree was constructed using the native Thai chicken populations and 19 reference breeds from Liu et al. (2006), Miao et al. (2013), and Godinez et al. (2019, 2021, 2022) that were downloaded from the NCBI database. The relationship was estimated using the neighbor-joining (NJ) method, and the genetic distance was computed using the Kimura 2-parameter (K2P) model (Kimura, 1980) with 1,000 bootstrap replications with MEGA11 (Tamura et al., 2021). The median-joining network of the mtDNA D-loop haplotypes was constructed using the PopART v1.7.2 software (Leigh & Bryant, 2015).
RESULTS
mtDNA D-loop sequence variability and genetic diversity of Thai native chicken populations and Red jungle fowl
The length of the mtDNA D-loop sequence of the 163 samples from the native Thai chicken populations was a 558 bp fragment, of which a 412 bp sequence was used in subsequence analysis from nt 87 to 499 of the Gallus gallus reference sequence (GenBank number: X52392.1). 20 variable sites were identified (Table 1). Among them, 4 were singleton variable sites and 16 were parsimony-informative sites. There was no deletion insertion identified in this study.
In total, 23 haplotypes were found in five Thai native chicken populations and Red jungle fowl, as shown in Table 2. In the 326 sequences, three major haplotypes were found, with STH06 being the first major haplotype with 36 sequences. STH06 was found in Red jungle fowl, Betong chickens, Khao Chang chickens, Srivijaya Naked-Neck chickens, and native chickens in Narathiwat province. The second major haplotype was STH03, with 26 sequences, which was found in Red jungle fowl, Betong chickens, Dang chickens, and Srivijaya Naked-Neck chickens. The third major haplotype was STH01, which was found in the Red jungle fowl, Betong chickens, and native chickens in Narathiwat province.
Among the 23 haplotypes, 14 haplotypes specific to the native Thai chicken populations were identified. The Red jungle fowl had the most unique haplotype (six haplotypes, STH13-STH18), followed by native chickens in Narathiwat province (five haplotypes, STH19-STH23), and Dang chickens (three haplotypes, STH09, STH11, STH12). The number of sequences, number of haplotypes, nucleotide diversity, and haplotype diversity of the five Thai native chicken populations and Red jungle fowl are presented in Table 3.
We found that the highest number of haplotypes was in the native chicken in Narathiwat province with 12 haplotypes, and the lowest number of haplotypes was in the Khao Chang chickens. The haplotype diversity values ranged from 0.000 ± 0.000 to 0.936 ± 0.034, and the overall value was 0.883 ± 0.011. The Dang and Srivijaya chickens had similar haplotype diversity. Meanwhile, the value of nucleotide diversity ranged from 0.00000 ± 0.00000 to 0.00856 ± 0.00077, and the overall value was 0.00755 ± 0.00031. The lowest nucleotide diversity was observed in Khao Chang chickens, and the highest nucleotide diversity was found in the native chickens in the Narathiwat province. For all Thai native chicken populations, Tajima’s D statistics for the neutrality test were not significant (p>0.05). Notably, the haplotype diversity, nucleotide diversity, and Tajima’s D statistics values of Khao Chang chickens were not diverse, indicating that all samples in this population have the same DNA sequences.
AMOVA
An AMOVA was performed to determine the genetic variation within and among populations, and is presented in Table 4. The result revealed that 21.79% of the genetic variation was among populations, while the within-population genetic variation was found to be high, amounting to 78.20% in the Thai native chicken populations in this study. Differences among the populations were highly significant (p<0.01).
Phylogenetic tree of the Thai native chicken populations and Red jungle fowl
A phylogenetic tree was constructed using the NJ method from the haplotypes of the Thai native chicken populations and Red jungle fowl with the reference sequence, which is shown in Figure 2. This shows that all haplotypes were clustered into eight haplogroups (A-F, H, and V) based on the complete mitochondrial genome and complete mtDNA D-loop region (Liu et al. 2006; Miao et al. 2013; Godinez et al. 2019, 2021, 2022). All of the haplogroups were observed to be multiple haplotypes and were shared among the different populations. Thai native chickens were in haplogroup B, the primary haplogroup that accounted for six haplotypes. The six haplotypes in this haplogroup were identified in three breeds (BT, DA, and NW), which are closely related to individuals from Indonesia, the Philippines, and China, as well as the Red jungle fowl (Gallus gallus) from Thailand. Thai native chickens were also present in the next most prevalent haplogroup (V), which accounted for five haplotypes.
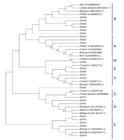
The neighbor-joining phylogenetic tree was constructed based on the mtDNA D-loop sequences from five Thai native chicken populations, Red Junglefowl, and 19 reference sequences obtained from NCBI (Liu et al., 2006; Miao et al., 2013; Godinez et al., 2019, 2021, 2022). Thai native chicken haplotypes are denoted as (STH01-STH23). The numbers at each branch represent the bootstrap values from 1,000 replications, with values below 50% not being shown.
The most common chicken breed in these haplotypes is the RJF, followed by the DA chicken, which is closely related to the Red jungle fowl (Gallus gallus spadiceus) from Thailand. Haplogroup A was found in three haplotypes, which were identified in five breeds (BT, DA, NW, SJ, and RJF), and are closely related to individuals from China and the Philippines, as well as the Red jungle fowl (Gallus gallus) from Thailand, and the Red jungle fowl (Gallus gallus spadiceus) from China. Haplogroup C was only found in one haplotype and identified in one breed (RJF), which was closely related to individuals from China. Haplogroup D was found in two haplotypes and identified in four breeds (DA, BT, NW, and RJF), which were closely related to individuals of indigenous chicken and Red jungle fowl (Gallus gallus bankiva) from Indonesia and Red jungle fowl (Gallus gallus) from the Philippines.
Haplogroup E was present in two haplotypes and identified in five breeds (BT, DA, NW, SJ, and RJF), which were closely related to individuals from China. Thai native chickens in haplogroup F were from two haplotypes and identified in two breeds (DA and NW), which were closely related to individuals from China and the Red jungle fowl (Gallus gallus) from Thailand. Thai native chickens in haplogroup H were from one haplotype and identified in two breeds (BT and NW), which were closely related to individuals from China.
Distribution of each chicken breed in each haplotype
Red jungle fowl individuals were distributed in 11 haplotypes, with the most common being STH16, which accounted for 21.05%. The Betong chicken individuals were primarily from haplotype STH04, accounting for 31.67%, followed by STH01, STH06, and STH05, which represented 25%, 15%, and 10%, respectively. The other haplotypes distributed among the Betong chicken included STH02, STH03, and STH07, accounting for less than 10%. Most Dang chicken individuals primarily had a STH03 haplotype, which accounted for 47.83%, followed by STH08 and STH09, which accounted for 17.39% each. Most Khao Chang individuals were in haplotype STH06, sharing the haplotype with RJF, BT, SJ, and NW, accounting for 100%. Srivijaya Naked-Neck chicken individuals were distributed in four haplotypes, with the most common being STH02, which accounted for 36%, followed by STH03, STH06, and STH07, which accounted for 32%, 28%, and 4%, respectively. Native chickens in the Narathiwat province were distributed in more than ten haplotypes, with the highest distribution in STH01, accounting for 28.51%, followed by STH06, accounting for 14.29%.
Network analysis of the haplotypes
The results of the median-joining network based on the 23 haplotypes that was constructed using the PopART v1.7.2 software are shown in Figure 3. This figure shows that the haplotypes of the Thai native chicken populations were divided into eight groups. We found that STH06, STH03, and STH01 were mainly distributed in the center of the median-joining network with the derivative haplotypes spreading from it.
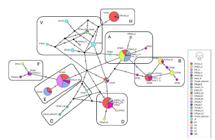
Median-joining network for 23 haplotypes from the Thai native chicken populations, Red Junglefowl, and nineteen reference sequences by Liu et al. (2006), Miao et al. (2013) and Godinez et al. (2019, 2021, 2022) were downloaded from NCBI. Circle sizes are proportional to the haplotype frequencies, and the different colors represent distinct populations. Thai native chicken haplotypes are denoted as (STH01-STH23). Population abbreviations: RJF (Red jungle fowl), BT (Betong chicken), DA (Dang chicken), KC (Khao Chang chicken), SJ (Srivijaya Naked-Neck chicken), and NW (Native chicken in Narathiwat province).
DISCUSSION
In Thailand, approximately 80% of rural households raise local chickens for domestic consumption and sale (Haitook et al., 2003). The lower southern region is an area where indigenous chickens are raised, similar to the other parts of Thailand. In each area, different breeds of chickens are preferred, such as Dang, Srivijaya Naked-Neck, Betong, and Khao chang chickens. Presently, local chicken meat is popular among consumers. The native Betong chicken, for instance, is accepted by both Thai and foreign consumers, given its quality, chewy texture, and good taste (Chanjula et al., 2004), and is often used to make minced chicken, steamed chicken, braised chicken with Chinese herbs, and chicken rice, among other recipes (Nualhnuplong et al., 2019). The study of genetic diversity provides important background information that can be used in planning, selection, and breeding programs to improve genetic traits for increased farm productivity and efficiency. Although there have been reports of genetic diversity in Thai native chickens (Pramual et al., 2013), this has not been evaluated in southern native chickens. Therefore, in this study, the genetic diversity of southern local chickens, including Betong, Khao Chang, Srivijaya Naked-Neck, Dang, and native chickens in Narathiwat province, was investigated using the mtDNA D-loop. In estimating genetic diversity, haplotype and nucleotide diversity are important parameters, and animals with high genetic and haplotype diversity will likely be exploited in the future (Guo et al., 2017). The aim was to elucidate the genetic differences between the native chicken populations and the Red jungle fowl populations. These studied breeds exhibited different evolutionary characteristics, some of which remain unclear. Genetic and archeological studies have indicated that domestic chickens worldwide originated from two ancestral Red jungle fowl subspecies of the Gallus gallus, native to Thailand and Southeast Asia (West & Zhou, 1989; Crawford, 1995).
The mtDNA D-loop sequence variability observed in our study can be contextualized through comparison with other chicken diversity studies. For example, the reported nucleotide diversity values for Chinese indigenous chickens ranged from 0.0035 to 0.02504 (Sha et al., 2019; Yu et al., 2019), whereas commercial chickens showed values of 0.00212 ± 0.00136 (Nisar et al., 2019). Southeast Asian native chickens typically demonstrate diversity values between 0.00500 and 0.00579 (Godinez et al., 2021), with Thai indigenous chickens specifically showing a diversity value of 0.00579 (Teinlek et al., 2018). In our study, the nucleotide diversity of Thai chickens ranged from 0.000 ± 0.000 in Khao Chang chickens to 0.00856 ± 0.00077 in Red jungle fowl. This range of values suggests varying levels of genetic conservation across the different populations, with some breeds showing concerning signs of genetic erosion that may require conservation attention. Notably, Khao Chang chickens exhibited the lowest haplotype diversity (0.000 ± 0.000) among all the native chickens in Southern Thailand, while the high diversity in Red jungle fowl is consistent with their status as an ancestral population. The extremely low diversity in Khao Chang chickens likely reflects their critically small population size, which has been declining due to decreased consumer demand. This breed may be at risk of extinction if conservation measures are not implemented.
The haplotype diversity of Thai native chickens was estimated to be in the range of 0.000 ± 0.000 for Khao Chang chickens to 0.936 ± 0.034 for Red jungle fowl, with an overall value of 0.883 ± 0.011. This was lower than that of the Chinese native chicken (0.916 ± 0.014) (Guo et al., 2017) and the Philippine chicken (0.915 ± 0.011) (Godinez et al., 2021), likely because Southern Thailand represents a more geographically confined region compared to the broader geographical areas covered in the Chinese and Philippine studies. In addition, native chicken breeds in Southern Thailand have relatively smaller effective population sizes, and their breeding practices typically involve small-scale, village-based systems. However, this value was higher than that of the Indonesian chicken (0.88045) (Sulandari et al., 2008) and the indigenous Thai chicken (0.8607) (Teinlek et al., 2018). The higher diversity observed in our study can be attributed to our comprehensive sampling approach, which captured a broader representation of genetic lineages, including the Red jungle fowl, an ancestral population known for high genetic diversity. Moreover, traditional breeding practices have helped maintain multiple distinct maternal lineages in these populations.
From the AMOVA results, a higher proportion of genetic variation was found within the populations (78.20%) than between the populations, which provides important insights into the population dynamics of Southern Thai chickens. This pattern suggests substantial histological gene flow between populations, which is consistent with traditional farming practices in Southern Thailand, where chickens from different villages often intermingle via trade and the sharing of breeding stock.
In this study, the median-joining network (Figure 2) and phylogenetic tree analysis (Figure 3) based on 23 haplotypes and 19 reference sequences from Liu et al. (2006), Miao et al. (2013), and Godinez et al. (2019, 2021, 2022) revealed consistent patterns that could be divided into eight haplogroups (A-F, H, and V). Haplogroups A and B have maternal lineages that are widely distributed throughout Eurasia, including the Asian region, Europe, and the Pacific (Liu et al., 2006; Miao et al., 2013). In haplogroup A, haplotype STH03 contained the highest number of Dang chicken haplotypes (11 individuals). Dang chicken, established by the Thai Department of Livestock Development as an indigenous breed of Southern Thailand, showed genetic similarity to the Red jungle fowl, sharing the common haplotypes STH03 and STH18. In haplogroup B, Betong, Dang, and native chickens from Narathiwat province were clustered with indigenous chickens from China, Indonesia, and the Philippines, which suggests possibly shared multiple matrilineal origins. Haplogroup D, occurring in Africa, South Asia, Southeast Asia, and East Asia, includes gamecocks, Red jungle fowl, and Pacific populations (Liu et al., 2006; Miao et al., 2013; Godinez et al., 2021). Our study found that Betong, Dang, and Narathiwat chickens were clustered with Red jungle fowl (Gallus gallus bankiva) from Indonesia and Red jungle fowl (Gallus gallus) from the Philippines. Haplogroup E exhibits a widespread distribution across East and South Asia. Within this haplogroup, the majority of Khao Chang chickens (STH06) were clustered with indigenous chickens from Yunnan Province, China (China3_E1), and shared major haplotypes with Betong chickens, thus supporting their Chinese origin. Furthermore, these breeds showed haplotype sharing with the Srivijaya Naked-Neck chicken, possibly because of their similar large body conformations. Haplogroup H is a rare haplogroup that is only found in domestic chickens and Red jungle fowl from East and South Asia (Liu et al., 2006; Miao et al., 2013). It included the majority of the Betong chickens, which were clustered with indigenous chickens from Yunnan Province, China (China5_H). This finding supports the historical hypothesis of the Betong chickens’ Chinese origin. Most of the Red jungle fowl specimens in our study were classified within haplogroup V, which is consistent with the findings of Godinez et al. (2022). This newly identified haplogroup is divided into two sub-haplogroups: V1, predominantly found in Thai Red jungle fowl, and V2, exclusively found in Cambodian and Laotian domestic chickens and Thai Red jungle fowl.
Therefore, we found that Thai native chicken populations were grouped together according to the reference sequence, which might suggest that they originate from multiple matrilineal species, and that the separation of the species may not have occurred long ago enough to separate into specific haplogroups similar to those reported by Teinlek et al. (2018). Furthermore, more than one population was found within the same haplotype, and some haplotypes were specific, which may be due to the sharing of haplotypes in some variation sites. Therefore, they cannot be separated into specific groups.
CONCLUSION
In summary, this study suggests that Thai native chicken populations, including Betong, Srivijaya Naked-Neck, and Dang chickens, as well as native chicken populations in Narathiwat province and the Red jungle fowl, have high genetic diversity. The genetic variations primarily occurred within the populations. These likely originated from multiple matrilineal lines and mtDNA D-loops, yet this study was unable to identify breed specificity. Our findings of high genetic diversity in Southern Thai chicken populations have several important implications for conservation and breeding programs, which include the need to establish systematic breeding programs to maintain this genetic diversity, while also allowing for the selective improvement of economically important traits, particularly in breeds such as Betong chickens that have considerable commercial value. Moreover, conservation strategies should be developed, focusing on preserving pure breeding lines while monitoring genetic introgression from commercial breeds.
ACKNOWLEDGEMENTS
The authors would like to thank Dr. Cyrill John P. Godinez for his advice in manuscript preparation.
REFERENCES
-
Berthouly-Salazar C, Thevenon S, Van TN, et al. Uncontrolled admixture and loss of genetic diversity in a local Vietnamese pig breed. Ecology and evolution. 2012;2(5):962-75. https://doi.org/10.1002/ece3.229
» https://doi.org/10.1002/ece3.229 -
Bhuiyan M, Chen S, Faruque S, et al. Genetic diversity and maternal origin of Bangladeshi chicken. Molecular Biology Reports 2013;40:4123-8. https://doi.org/10.1007/s11033-013-2522-6
» https://doi.org/10.1007/s11033-013-2522-6 - Chanjula P, Wanichapichart W, Thongchumroon T, et al. Village Betong chicken production in three Southernmost Thailand:A study of phenotypic characteristics, growth, carcass yield and egg performance of Betong chickens. Journal of Agriculture 2004;20(3):278-8.
- Choprakarn K, Wongpichet K. Village chicken production systems in Thailand. Proceedings of the International Poultry Conference; 2007. Bangkok. Thailand; 2007 Nov 5-7.
- Crawford RD. Origin, history, and distribution of commercial poultry. In: Hunton P, editor. Poultry production. Amsterdam: Elsevier Science Publishers; 1995. p.1-20.
-
Dorji N, Daungjinda M, Phasuk Y, et al. Genetic characterization of Thai indigenous chickens compared with commercial lines. Tropical Animal Health and Production 2011;43:779-85. https://doi.org/10.1007/s11250-010-9763-3
» https://doi.org/10.1007/s11250-010-9763-3 -
El-Mahdy O. Mitochondrial DNA as a marker for genetic diversity and evolution. Advances in Genetic Engineering & Biotechnology 2012;1:1. https://doi.org/ 10.4172/2324-9021.1000e102
» https://doi.org/ -
FAO. The second report on the state of the world's animal genetic resources for food and agriculture. Rome; 2015 [cited 2022 Oct 26]. Available from,: http://www.fao.org/3/a-i4787e/index.html
» http://www.fao.org/3/a-i4787e/index.html -
Fumihito A, Miyake T, Sumi SI, et al. One subspecies of the Red jungle fowl (Gallus gallus gallus) suffices as the matriarchic ancestor of all domestic breeds. Proceedings of the National Academy of Sciences USA 1994;91:12505-9. https://doi.org/10.1073/pnas.91.26.12505
» https://doi.org/10.1073/pnas.91.26.12505 -
Fumihito A, Miyake T, Takada M, et al. Monophyletic origin and unique dispersal patterns of domestic fowls. Proceedings of the National Academy of Sciences USA 1996;93:6792-5. https://doi.org/10.1073/pnas.93.13.6792
» https://doi.org/10.1073/pnas.93.13.6792 -
Galtier N, Nabholz B, GlÉMin S, et al. Mitochondrial DNA as a marker of molecular diversity:a reappraisal. Molecular Ecology 2009;18:4541-50. https://doi.org/10.1111/j.1365-294X.2009.04380.x
» https://doi.org/10.1111/j.1365-294X.2009.04380.x -
Godinez CJP, Nishibori M, Matsunaga M, et al. Phylogenetic studies on red jungle fowl (Gallus gallus) and native chicken (Gallus gallus domesticus) in Samar Island, Philippines using the mitochondrial DNA D-Loop region. The Journal of Poultry Science 2019;56:237-44. https://doi.org/10.2141/jpsa.0180131
» https://doi.org/10.2141/jpsa.0180131 -
Godinez CJP, Dadios PJD, Espina DM, et al. Population genetic structure and contribution of Philippine chickens to the Pacific chicken diversity inferred from mitochondrial DNA. Frontiers in Genetics 2021;12:698401. https://doi.org/10.3389/fgene.2021.698401
» https://doi.org/10.3389/fgene.2021.698401 -
Godinez CJP, Layos JKN, Yamamoto Y, et al. Unveiling new perspective of phylogeography, genetic diversity, and population dynamics of Southeast Asian and Pacific chickens. Scientific Reports 2022;12:14609. https://doi.org/10.1038/s41598-022-18904-3
» https://doi.org/10.1038/s41598-022-18904-3 -
Groeneveld L, Lenstra J, Eding H, et al. Genetic diversity in farm animals-a review. Animal Genetics 2010;41:6-31. https://doi.org/10.1111/j.1365-2052.2010.02038.x
» https://doi.org/10.1111/j.1365-2052.2010.02038.x -
Guo H, Li C, Wang X, et al. Genetic diversity of mtDNA D-loop sequences in four native Chinese chicken breeds. British Poultry Science 2017;58:490-7. https://doi.org/10.1080/00071668.2017.1332403
» https://doi.org/10.1080/00071668.2017.1332403 - Haitook T, Tawfik E, Zöbisch M, et al. Options for native chicken (Gallus domesticus) production in Northeastern Thailand. Proceedings of the Conference on International Agricultural Research for Development; 2008. Deutsher Tropentag, Göttingen; 2003 Oct 8-10.
- Hall, T.A. BioEdit: a user-friendly biological sequence alignment editor and analysis program for Windows 95/98/NT. Nucleic Acids Symposium Series 1999;41:95-8.
-
Harrison RG. Animal mitochondrial DNA as a genetic marker in population and evolutionary biology. Trends in Ecology & Evolution 1989;4:6-11. https://doi.org/10.1016/0169-5347(89)90006-2
» https://doi.org/10.1016/0169-5347(89)90006-2 -
Hata A, Nunome M, Suwanasopee T, Duengkae P, et al. Origin and evolutionary history of domestic chickens inferred from a large population study of Thai Red jungle fowl and indigenous chickens. Scientific Reports 2021;11:2035. https://doi.org/10.1038/s41598-021-81589-7
» https://doi.org/10.1038/s41598-021-81589-7 -
Hoque MR, Lee SH, Jung KC, et al. Discrimination of korean native chicken populations using SNPs from mtDNA and MHC polymorphisms. Asian-Australasian Journal of Animal Sciences 2011;24:1637-43. https://doi.org/10.5713/ajas.2012.12459
» https://doi.org/10.5713/ajas.2012.12459 -
Kimura M. A simple method for estimating evolutionary rates of base substitutions through comparative studies of nucleotide sequences. Journal of Molecular Evolution 1980;16:111-20. https://doi.org/10.1007/BF01731581
» https://doi.org/10.1007/BF01731581 -
Leigh JW, Bryant D. POPART:f ull-feature software for haplotype network construction. Methods in Ecology and Evolution 2015;6:1110-6. https://doi.org/10.1111/2041-210X.12410
» https://doi.org/10.1111/2041-210X.12410 -
Liu YP, Wu GS, Yao YG, et al. Multiple maternal origins of chickens: out of the Asian jungles. Molecular Phylogenetics and Evolution 2006;38:12-9. https://doi.org/10.1016/j.ympev.2005.09.014
» https://doi.org/10.1016/j.ympev.2005.09.014 -
Mekchay S, Supakankul P, Assawamakin A, et al. Population structure of four Thai indigenous chicken breeds. BMC Medical Genetics 2014;15:1-9. https://doi.org/10.1186/1471-2156-15-40
» https://doi.org/10.1186/1471-2156-15-40 -
Miao Y, Peng MS, Wu GS, et al. Chicken domestication: an updated perspective based on mitochondrial genomes. Heredity 2013;110:277-82. https://doi.org/10.1038/hdy.2012.83
» https://doi.org/10.1038/hdy.2012.83 -
Nisar A, Waheed A, Khan S, et al. Population structure, genetic diversity and phylogenetic analysis of different rural and commercial chickens of Pakistan using complete sequence of mtDNA D-loop. Mitochondrial DNA Part A. 2019;17;30(2):273-80. https://doi.org/10.1080/24701394.2018.1484118
» https://doi.org/10.1080/24701394.2018.1484118 -
Nishibori M, Shimogiri T, Hayashi T, et al. Molecular evidence for hybridization of species in the genus Gallus except for Gallus varius. Animal genetics. 2005;36(5):367-75. https://doi.org/10.1111/j.1365-2052.2005.01318.x
» https://doi.org/10.1111/j.1365-2052.2005.01318.x -
Novelletto A, Testa L, Iacovelli F, et al. Polymorphism in mitochondrial coding regions of Mediterranean loggerhead turtles:evolutionary relevance and structural effects. Physiological and Biochemical Zoology. 2016;89(6):473-86. https://doi.org/10.1086/688679
» https://doi.org/10.1086/688679 - Nualhnuplong P, Wattanachant C, Wattansit S, et al. Market structure marketing channel and supply chain of Betong chicken in Pattani Yala and Narathiwat provinces. Journal of Agricultural Research and Extension 2019;36:78-85.
- Pramual P, Meeyen K, Wongpakam K, et al. Genetic diversity of Thai native chicken inferred from mitochondrial DNA sequences. Tropical Natural History 2013;13:97-106.
-
Rozas J, Ferrer-Mata A, Sánchez-DelBarrio JC, et al. DnaSP 6:DNA sequence polymorphism analysis of large data sets. Molecular Biology and Evolution 2017;34:3299-302. https://doi.org/10.1093/molbev/msx248
» https://doi.org/10.1093/molbev/msx248 -
Sha Y, Gao C, Liu M, et al. Evaluation of the genetic diversity of six Chinese indigenous chickens. Asian-Australasian Journal of Animal Science 2019;33(10):1566. https://doi.org/10.5713/ajas.19.0606
» https://doi.org/10.5713/ajas.19.0606 -
Sulandari S, Zein MSA, Sartika T, et al. Molecular characterization of Indonesian indigenous chickens based on mitochondrial DNA displacement (D)-loop sequences. HAYATI Journal of Biosciences 2008;15:145-54. https://doi.org/10.4308/hjb.15.4.145
» https://doi.org/10.4308/hjb.15.4.145 -
Tamura K, Stecher G, Kumar S, et al. MEGA11:molecular evolutionary genetics analysis version 11. Molecular Biology and Evolution 2021;38:3022-7. https://doi.org/10.1093/molbev/msab120
» https://doi.org/10.1093/molbev/msab120 -
Teinlek P, Siripattarapravat K, Tirawattanawanich C, et al. Genetic diversity analysis of Thai indigenous chickens based on complete sequences of mitochondrial DNA D-loop region. Asian-Australasian Journal of Animal Sciences 2018;31:804. https://doi.org/10.5713/ajas.17.0611
» https://doi.org/10.5713/ajas.17.0611 -
West B, Zhou BX. Did chickens go north? New evidence for domestication. World's Poultry Science Journal. 1989;45(3):205-18. https://doi.org/10.1079/WPS19890012
» https://doi.org/10.1079/WPS19890012 -
Yu C, Qiu M, Jiang X, et al. Genetic diversity and phyletic evolution of eleven Chinese indigenous and three commercial chicken breeds by mtDNA sequences. Brazilian Journal of Poultry Science. 2019;21(04):eRBCA-2018. https://doi.org/10.1590/1806-9061-2018-0807
» https://doi.org/10.1590/1806-9061-2018-0807 -
Zhang C, Lin D, Wang Y, et al. Widespread introgression in Chinese indigenous chicken breeds from commercial broiler. Evolutionary Applications. 2019;12(3):610-21. https://doi.org/10.1111/eva.12742
» https://doi.org/10.1111/eva.12742 -
Zhang J, Nie C, Li X, et al. Genome-wide population genetic analysis of commercial, indigenous, game, and wild chickens using 600K SNP microarray data. Frontiers in Genetics 2020;11:543294. https://doi.org/10.3389/fgene.2020.543294
» https://doi.org/10.3389/fgene.2020.543294
-
FUNDING
This work was supported by the Prince of Songkla University, the Center of Excellence in Agricultural and Natural Resources Biotechnology (CoE-ANRB) phase 2 and National Science, Research and Innovation Fund (NSRF) and Prince of Songkla University (Grant No NAT6505171S).
-
DATA AVAILABILITY STATEMENT
The data that support the findings of this study are available from the corresponding author upon reasonable request.
-
ETHICAL ISSUES
This study was approved by the Animal Ethics Committee of Prince of Songkhla University (PSU) (2022-FNR01-003).
-
DISCLAIMER/PUBLISHER’S NOTE
The published papers’ statements, opinions, and data are those of the individual author(s) and contributor(s). The editor(s) disclaim responsibility for any injury to people or property resulting from any ideas, methods, instructions, or products referred to in the content.
The data that support the findings of this study are available from the corresponding author upon reasonable request.