 Evaluation of Color Performance of Video Cameras for Poultry House Monitoring Applications
ABSTRACT
This study examined the critical role of image color accuracy in surveillance systems, particularly in poultry houses, using affordable video cameras. Variations in commercial camera color processing can lead to inconsistent metrics. Therefore, common cameras were evaluated on the Raspberry Pi platform, aiming to minimize color differences through a three-stage correction process. The analysis without correction revealed significant color discrepancies, particularly in the PI cameras using an automatic white balance, with differences of approximately 50. Gamma correction was applied to improve accuracy, thereby reducing the color differences to within 20 for most cameras. Polynomial regression further decreased the differences to less than 10 across various temperatures, demonstrating superior performance, especially for large initial discrepancies. Field experiments with and without color charts confirmed the effectiveness of color restoration using correction matrices. The study concluded that polynomial regression significantly enhances color accuracy on the Raspberry Pi platform, offering valuable applications across different temperatures and scenarios, thereby contributing to advancements in related fields.
Keywords:
Video camera; poultry house; color correction; color difference; polynomial regression; Internet of things
INTRODUCTION
Video cameras are widely used imaging tools that play an indispensable role in modern technological applications. These devices are extensively utilized for capturing images and color information across multiple domains, including agriculture, healthcare, industrial inspection, and security surveillance. Rapid advancements in imaging technology have enabled the precise recording and analysis of visual information.
In these application scenarios, the Raspberry Pi has emerged as an ideal tool for monitoring, data collection, automation, and remote control because of its accessibility and high customizability. Raspberry Pi has gained widespread adoption across various fields, making significant contributions to agriculture, which requires stable, cost-effective, and efficient solutions. It has been extensively employed in product monitoring, smart irrigation systems (Hassine et al., 2023), and environmental data collection (Morchid et al., 2024); thereby enhancing the quality and efficiency of agricultural production (Al Mamun et al., 2025).
However, the color accuracy of video cameras significantly affects their effectiveness in practical applications. For instance, in industrial inspections, color inaccuracies may affect product quality and consequently reduce production efficiency (Goñi et al., 2017). In medical imaging, color deviations can influence diagnostic results and treatment plans, potentially impeding patient recovery (Desale et al., 2024). Maintaining color accuracy under varying lighting and illumination conditions is crucial in imaging technology. With the widespread adoption of the Raspberry Pi in agricultural applications, its potential as a platform for data collection and image processing has garnered increasing attention.
This study aims to minimize the color discrepancy among different cameras for a comprehensive understanding of the color performance of video cameras on Raspberry Pi. Three common types of video cameras, with different parameter settings, were evaluated under seven distinct color-temperature conditions. Color samples were captured and analyzed against reference values to calculate the color differences. Subsequently, color correction was performed using surveillance cameras in poultry houses to enhance accuracy.
RELATED WORKS
Applications based on Raspberry Pi
Raspberry Pi, a compact and cost-effective single-board computer, has found widespread application in diverse fields. With the integration of Internet of Things (IoT) technology, wireless sensors have become increasingly prevalent in agricultural applications. Kamath et al. (2019) developed a wireless visual sensor network utilizing Raspberry Pi for precision agriculture, specifically to monitor weeds in rice fields. Using Raspberry Pi, Chen et al. (2021) developed a real-time monitoring system capable of identifying six distinct cat behaviors: sleeping, eating, sitting, walking, using the litterbox, and tipping over garbage bins. Their system captured images in real time and sent immediate warning messages when cats spent excessive time in the litterbox or disturbed garbage bins, thereby enabling instantaneous preventive measures. In healthcare applications, Raspberry Pi has demonstrated significant potential in digital diagnostics through color analysis, providing improved detection accuracy via color-tracking technology (Reddy et al., 2019; Yusoff et al., 2021).
Color difference
The Commission on Illumination (CIE) introduced the CIELAB color space in 1976, which is an extension of the CIE XYZ color space. CIELAB provides a more intuitive and practical method for perception, including lightness L* and chromaticity coordinates (a* and b*). The color-difference formula plays an important role in evaluating color accuracy and is widely used in fields such as textile, printing, clinical dentistry, and agricultural applications (Perez et al., 2011; Pecho et al.,2016; Wei et al., 2024). In the CIELAB color space, the Euclidean distance between two color samples (L 1*, a 1*, b 1*) and (L 2*, a 2*, b 2*) is recognized as color difference ΔE*ab ΔE*ab. Over decades, the color difference was modified to ΔE*94 ΔE*94 and ΔE*00 ΔE*oo, displaying better uniformity (Luo et al., 2001; Melgosa, 2023), as announced by CIE in 1994 and 2000, respectively.
Color correction technology
Color correction is a crucial image-processing technique designed to adjust color representation in images to ensure consistency in display and output across different devices. This technology has applications in various fields, including display calibration, printer color characterization, color encoding, and color management. Because of the differences in spectral sensitivity between camera sensors and the human vision system, the colorimetric characterization of digital cameras usually requires mapping RGB values to the CIEXYZ color space to ensure device independence (Westland et al., 2012).
Applications of color correction technology include printing, digital image processing, digital archives, product quality control, and agricultural sciences (Cheung et al., 2004; You et al., 2020; Zhang et al., 2022; Baek et al., 2023; Kucuk et al., 2023 Meng et al., 2024). In these domains, color accuracy and consistency are vital for the final product quality and performance. Color correction helps rectify color deviations caused by lighting conditions, camera characteristics, or display device variations, thus achieving a more authentic and accurate visual representation.
Gamma correction
The external stimuli for human perception follow an exponential relationship. In low-brightness environments, the human eye exhibits a heightened sensitivity to changes in physical brightness, and subtle variations significantly affect visual perception. However, this sensitivity diminishes as ambient brightness increases. In camera systems, image signal processors incorporate gamma encoding to enhance color saturation. Images undergo gamma encoding when saved as JPG-compressed files and displayed on monitors with inherent gamma encoding. Consequently, brightness values typically undergo three gamma encoding adjustments prior to human perception (Poynton, 1998).
Typically, digital camera sensors demonstrate a linear conversion relationship when transforming the input light intensity into digital values. However, most commercial digital cameras perform internal image preprocessing to ensure image quality. Typically, cameras adjust the gamma value to 1/2.2 for images intended for display in the standard RGB (sRGB) color space, corresponding to the sRGB color space gamma value of 2.2 (Anderson 1996).
Polynomial regression
Polynomial regression is a popular method for fitting nonlinear data. Hong et al. (2001) introduced a color correction method utilizing polynomial transformation, mapping colors from input to target color space using polynomial formulas. By incorporating nonlinear terms, polynomial regression effectively improves the correction accuracy for nonlinear color distributions. This method accommodates multiple polynomial degrees, such as quadratic and cubic terms to achieve optimal correction effects in different application scenarios. Finlayson et al. (2015) implemented polynomial matrix expansion using quadratic, cubic, and quartic terms, enhancing color mapping accuracy by expanding the matrix dimensions used in least-squares regression. Compared with the linear regression 3×3 matrix, they employed larger 3×9, 3×19, and 3×34 matrices, providing greater flexibility and adjustment range to achieve higher color accuracy.
MATERIALS AND METHODS
Cameras and reference color
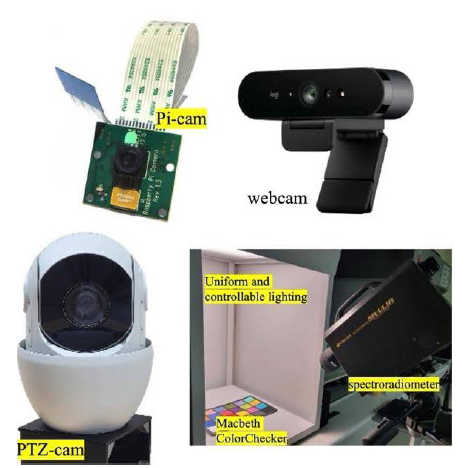
Three models were used to evaluate the color performance of the most common cameras in Raspberry Pi, namely “Pi-cam,” “webcam,” and “PTZ-cam” (pan-tilt-zoom).
-
Pi-cam: The Pi camera is the official module of Raspberry Pi. The version of Pi camera used in this study was 1.3, equipped with an OV5647 sensor from OmniVision, Inc.
-
Webcam: The Brio 4 K camera (Logitech Inc.) was used for the evaluation of common video devices in computers.
-
PTZ-cam: A 5-mega pixel IP camera with PTZ features, manufactured by Saqicam Inc., was used to evaluate images transmitted via the Internet. In the experiment, (real-time streaming protocol) was used to access the images.
The reference color chart used in this study was the Macbeth Color Checker of McCamy et al. (1976). The Macbeth ColorChecker consists of 24 square-colored patches, among which, 12 represent the primary colors of color film processing and grayscale brightness from white to black. The remaining colors are designed to represent common natural colors, such as human skin, foliage, and sky. The three cameras and ColorChecker are shown in Figure 1.

The ground truths of the colors were measured using the Topcon SR-UL1R instrument, which is a spectroradiometer used to measure the luminance and chromaticity of the color patches in this study. The measurement followed the 0o/45o configuration which is recommended by CIE and ISO 7724. All measurement data are listed in Table 1. To simulate the illumination scenario in poultry houses, the color temperatures were measured at different hours of the day. However, different latitudes and seasons may produce divergent results. For example, the measured correlated color temperature (CCT) of daylight in Taiwan usually ranges from 5000 - 7000 K. To extend feasibility, a well-controlled light chamber capable of accurately simulating uniformly distributed illumination at different color temperatures was used. In the experiments, the camera performance was evaluated at color temperatures ranging from 4000 - 7000 K.
To understand the controllable features of cameras in typical IoT environments, the open-source library OpenCV was used to access the controllable functions of the cameras. Different operation systems use different drivers to control cameras. For example, the Windows system utilizes the Microsoft DirectX driver; in contrast, V4L (Video4Linux) is a common driver on the Raspberry Pi platform.
All controllable features that may affect the color difference of the three cameras were tested on Raspberry Pi. The controllable conditions are listed in Tables 2 and 3. Table 2 lists the features based on image post-processing. Table 3 lists the features used to control the cameras prior to forming images. However, the white balance in the PI-cam and webcam was categorized into different stages to make them comparable. We intentionally selected “white_balance_automatic” and “white_balance_temperature” of webcam and “white_balance_auto_preset” red_balance and blue_balance of Pi-cam as the testing parameters.
During the experiments, each camera was configured with at least two sets of parameter combinations: automatic and manual white balances. The automatic white balance setting automatically adjusts the color temperature according to changes in ambient lighting to adapt to different lighting conditions. The auto-white balance function may differ depending on the image signal processor (ISP) of the manufacturer. In the manual white balance settings, the red and blue gain levels were fixed at the same ratio to maintain consistent white balance parameters. Each parameter set was used to capture ColorChecker images under different lighting conditions to evaluate color performance under varying conditions. The detailed settings for each parameter are listed in Table 4.
All other settings were kept consistent to minimize the influence of other variables on color performance. These consistent settings include resolution, aspect ratio, and compression format. All three cameras had a resolution of 1920×1080 (FHD) and used the uncompressed PNG image format.
Gamma correction of each camera
Six grayscale color patches from ColorChecker were used to determine the gamma properties of each camera. These samples served as reference ground truths from light to dark. Their luminances were normalized and calculated against the reference values measured using a spectroradiometer. The gamma curve was plotted by fitting the squares in Figure 2. The regressed gamma value was derived using Equations (1) and (2).

In Equation (1), C represents the luminance of the image captured by the camera; γ is the gamma; and L is the physical luminance from spectroradiometer. All gamma values were determined by the regression process of Equation (2) once the luminances of six grayscale color patches were obtained from the spectroradiometer. The estimated gamma values of PI-cam, webcam, and PTZ-cam were 0.9, 1.28, and 0.82, respectively. During color space conversion, the gamma value of the image was adjusted back to 1 to ensure that the image luminance matched the actual luminance. Therefore, in Equation (1), the reciprocal of gamma is used for gamma correction.
Polynomial regression
Polynomial regression was used to correct the RGB values of the captured images, verifying color performance after correction. Following the definition in Wei et al. (2024), the raw RGB values of the reference color on ColorChecker (A in Equation (3)) were obtained by the spectroradiometer, as shown in the rightmost part of Figure 1, under different color temperatures. M is a matrix with 3×10 elements used to convert the RGB values of the images into the reference ground truth (b in Equations (3) and (4)); M can be obtained using Equation (5). In practice, the values of A and b are normalized to achieve better numerical stability during many matrix operations. A color calibration card with 24 color patches was selected. To avoid overfitting due to insufficient color samples, a 3×10 linear transformation matrix of M was used for color correction. This matrix was applied to images captured under different camera parameters and lighting conditions, which had already undergone gamma correction to achieve more accurate color correction results.
Evaluation metrics of color difference
To comprehensively evaluate the color performance of the cameras at various color temperatures, seven color temperatures and seven conditions of the three cameras were selected. Figure 3 shows all the combinations. After capturing the photos, the three groups were subjected to different correction types. The CIEDE2000 color differences between the images from the cameras and ground truth were used to evaluate performance under different scenarios. The evaluation results convey the accuracy of the camera colors.

RESULTS AND DISCUSSION
Image without correction
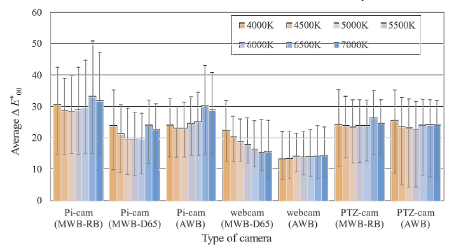
The color differences of the images without correction were determined, as shown in Figure 4. The setting of type of camera can be seen in Table 4 and Figure 3. The error bars indicate the upper and lower bounds of the color differences of the 24 patches within each dataset. The RGB values are the average values of the cropped regions at the center of each patch. Each chart in the figure shows the average color difference between the 24 patches. The maximum color difference is observed in the images captured by Pi-cam at a color temperature of 6500 K. Although Pi-cam has more controllable parameters, it exhibits poor color accuracy. Among the seven camera conditions, the webcam (Logitech Brio 4 K) exhibited the lowest average color difference with its built-in auto-white balance function. For the PTZ-cam, the maximum color difference values were approximately 35, and their averages were relatively consistent. However, among the three PI-cam conditions, the auto-white balance function did not improve significantly.

Considering the effect of color temperature on environmental illumination, a change in color temperature may have an impact on color performance. The experimental results show that the color difference exhibits a relatively consistent trend. No significant differences were observed for the color temperatures.
Image with gamma correction
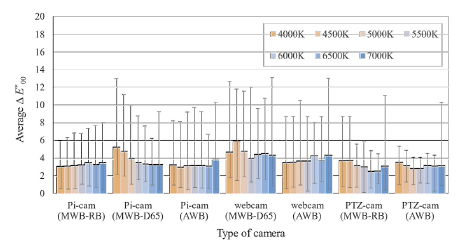
After analyzing the images without correction, gamma correction was performed on the images captured by each camera to adjust the tone curve, allowing images to better reproduce colors. Figure 5 shows the average color differences in the images captured using different camera parameters and color temperatures after gamma correction. Compared with those without correction, the color-difference values after gamma correction showed significant improvement, with the overall average color-difference range of 10-30 reduced to below 20 and a maximum color difference of less than 32. The highest color difference appeared in the PI-cam under a manual white balance, with the color difference decreasing from approximately 30 to 20.

Cameras with a manual white balance at lower color temperatures showed a larger color difference than cameras with higher color temperatures. However, after gamma correction, the color difference values for each camera generally decreased, especially for automatic white balance, whereby the color difference values were significantly reduced to below 12. Compared with Figure 4, the color-difference values for most cameras significantly decreased after gamma correction, particularly for camera parameters with larger initial color differences, with substantially reduced corrected color differences.
Image with gamma and polynomial correction
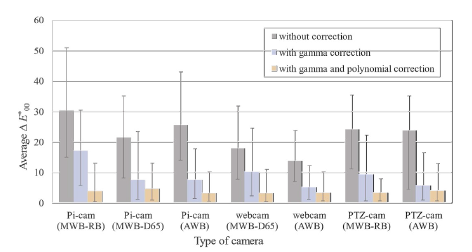
To achieve a more accurate color correction, we used a 3 ×10 polynomial regression matrix, which included both linear and quadratic terms of the RGB values, as in Equation (4). Figure 6 shows the average color differences of the images captured under different camera parameters and color temperatures after polynomial correction. The color-difference values for each camera decreased significantly, with all parameters showing a color difference of less than 10. Compared to gamma correction, polynomial regression was more effective in reducing color differences, particularly for Pi-cam and PTZ-cam, where the correction effect was even more pronounced. After correction, the differences in color-difference between color temperatures decreased, and this trend was relatively consistent.

For most cameras, the color difference values decreased significantly after correction. Additionally, the color-difference values between the different camera parameters were reduced to a similar range, further demonstrating the role of the correction process in standardizing the color performance of different cameras. The results in Figure 7 indicate that an appropriate correction can reduce the color differences between cameras, improve image consistency and accuracy, and better meet the color accuracy demands of various application scenarios.

Applications in poultry houses
In this section, the previous section results were applied to real-world scenarios to demonstrate their practical effects. Two poultry houses were selected for verification: one was an environment that already had a reference color chart, and the other was an environment without it. Both poultry houses were located at the center of Taiwan; their buildings were oriented north-south and had a semi-open structure. Therefore, sunlight affected the color of the camera from morning to evening.
Poultry house with reference color chart
A PTZ camera of model AXIS Q6128-E was used in this poultry house. The conditions of white balance could be set automatically or manually through the manufacturer’s preset “outdoor.” All images were collected between 08:00 AM and 04:00 PM on sunny days in May, 2024.
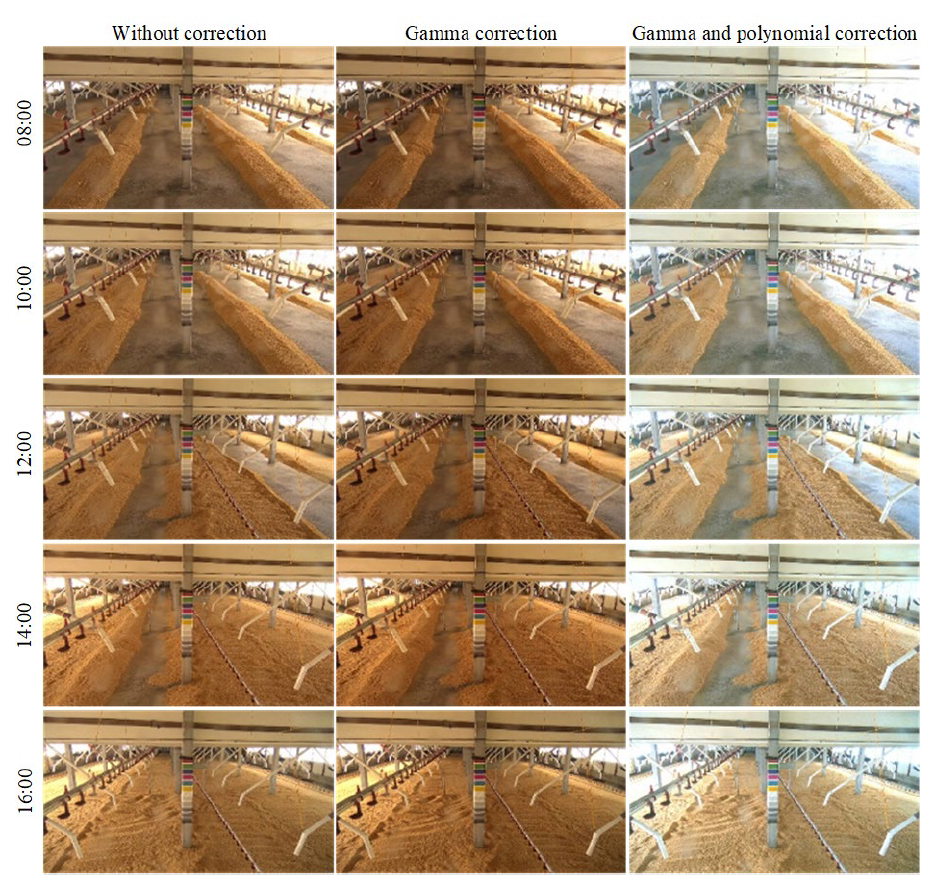
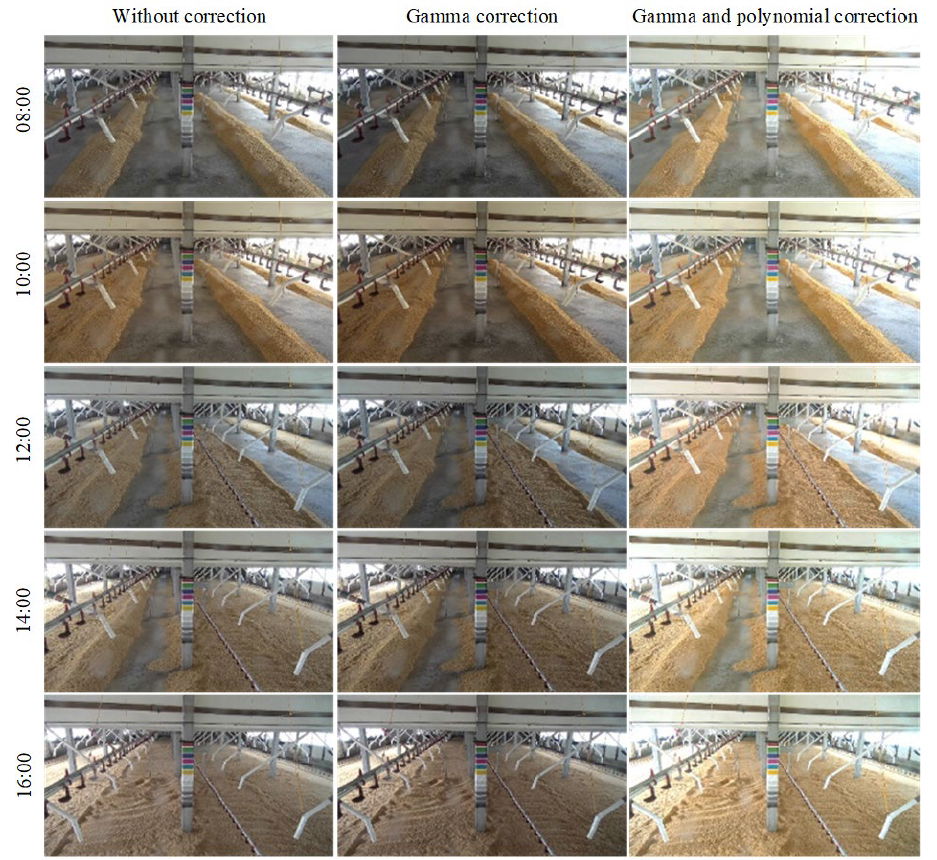
Figures 8 and 9 show the results of photos captured under different white-balance conditions and their corrected outcomes. The first column of Figures 8 and 9 indicates the most common surveillance cameras in poultry houses. In Figure 10, the automatic white balance (AWB) mode performs slightly better than manual white balance (MWB). However, gamma correction has not improved, possibly because the color chart was small, and illumination was non-uniform. After additional polynomial correction, the color difference was reduced from approximately 20 to less than 5. The AWB mode continuously adjusted the ratio between R, G, and B channels, which resulted in a lower deviation.
Comparison of images under the manual white balance of outdoor mode (with reference color chart).


Poultry house without reference color chart
In the scenario of a poultry house without a color chart, the building was oriented north-south, and a 2 K PTZ camera was installed near the east window. The AWB and MWB modes used in this field were the same as those used for the PTZ-cam (AWB) and PTZ-cam (MWB-RB) in Section 3. Because there was no ground truth to verify the corrected images, only corrected images were evaluated qualitatively. This experiment attempted to simulate the setting of many surveillance cameras in a poultry house, which is the most common scenario, since calibrating all cameras individually is unlikely during a massive deployment.
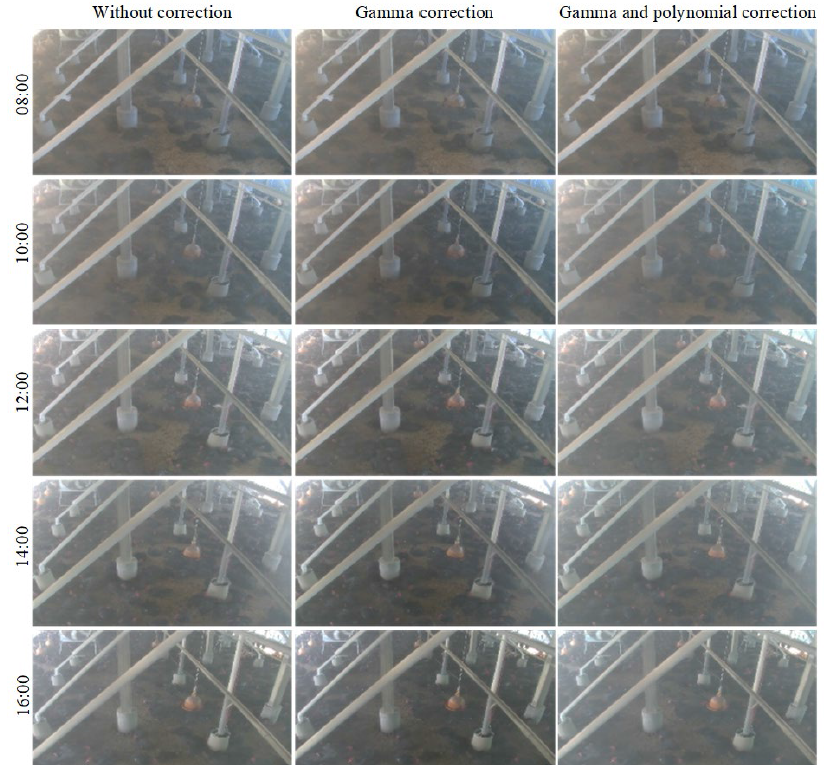
In this experiment, the same model of the PTZ camera shown in Table 4 was used. The corrected gamma and polynomial correction factors were duplicated and deployed on the PTZ camera in the poultry house, which had a dusty environment, whereby large amounts of dust accumulated on the lenses. Figures 11 and 12 demonstrate the correction effect for different time periods. The images captured in the MWB mode have successfully shifted from an abnormal yellow-green tone to a warm tone commonly found in poultry houses. The colors of the feeding tubes appear to be correct. Meanwhile, images taken with AWB have restored more detailed tones, such as the gray-blue canvas used for summer shading at the top right of the image, which reverted to aqua-blue in the field.


Based on the experimental results, this study compared several commonly used camera models on the Raspberry Pi platform, particularly focusing on their differing control parameters and conditional limitations. Additionally, this study concluded that polynomial regression can significantly improve color accuracy in experimental environments. For practical applications, we used PTZ cameras, which have fewer controllable parameters, as examples, and verified that their color accuracy could still be improved. This further provides useful strategies for setting up surveillance systems in the poultry house. Regarding limitations, since we only selected the three most common types of cameras on the Raspberry Pi system for color performance evaluation, the characteristics of cameras (e.g. gamma response) from different brands may vary due to their unique pipelines.
CONCLUSION
This study investigated the color performance of video cameras on a Raspberry Pi platform under diverse lighting conditions, focusing on the color performance and efficacy of various correction methods. The assessments revealed pronounced color discrepancies among the cameras, with the Pi-cam exhibiting approximately a maximum error of 50 by ΔE*00 ΔE*oo metric. The subsequent gamma correction was significantly reduced to within 20. Further refinement through polynomial regression, employing a 3×10 matrix, decreased the deviations across various temperatures to below 10, demonstrating superior effectiveness, particularly in scenarios with substantial initial deviations.
Experiments pertaining to practical applications were conducted with and without the use of color charts. In the scenarios utilizing color charts, the average color deviation was reduced from an initial range of 10-30 to less than 10. In the absence of color cards, the application of a correction matrix derived from experimental data successfully normalized the image tones, demonstrating efficacy even without direct reference tools. When color difference is significantly reduced, it can effectively assist pet owners or veterinarians in practical applications. They can remotely and instantly assess the health condition of animals in the poultry house, especially by identifying symptoms based on the change of color. This study highlights the potential of polynomial regression in significantly enhancing color accuracy across various settings.
ACKNOWLEDGEMENTS
This work was supported in part by the Ministry of Agriculture, Taiwan. The authors also thank the lab held by professor Y. C. Tasi for their assistance in the setup of devices and poultry house data collection.
REFERENCES
-
Al Mamun MdR, Ahmed AK, Upoma SM, et al. IoT-enabled solar-powered smart irrigation for precision agriculture. Smart Agricultural Technology 2025;10:100773. https://doi.org/10.1016/j.atech.2025.100773
» https://doi.org/10.1016/j.atech.2025.100773 - Anderson M, Motta R, Chandrasekar S, et al. Proposal for a standard default color space for the internet-sRGB. Proceedings of 4th Color and Imaging Conference; 1996 Nov 19-22; Scottsdale, Arizona: Society for Imaging Science and Technology; 1996. p238-245.
-
Baek SH, Jeon JS, Kwak TY. Color calibration of moist soil images captured under irregular lighting conditions. Computers and Electronics in Agriculture 2023;214:108299 https://doi.org/10.1016/j.compag.2023.108299
» https://doi.org/10.1016/j.compag.2023.108299 -
Chen RC, Saravanarajan VS, Hung HT. Monitoring the behaviours of pet cat based on YOLO model and raspberry Pi. International Journal of Applied Science and Engineering 2021;18(5):1-12. https://doi.org/10.6703/IJASE.202109_18(5).016
» https://doi.org/10.6703/IJASE.202109_18(5).016 -
Cheung V, Westland S, Connah D, et al. A comparative study of the characterisation of colour cameras by means of neural networks and polynomial transforms. Coloration Technology 2004;120(1):19-25. https://doi.org/10.1111/j.1478-4408.2004.tb00201.x
» https://doi.org/10.1111/j.1478-4408.2004.tb00201.x -
Desale RP, Patil PS. An efficient multi-class classification of skin cancer using optimized vision transformer. Medical and Biological Engineering and Computing 2024;62(3):773-89. https://doi.org/10.1007/s11517-023-02969-x
» https://doi.org/10.1007/s11517-023-02969-x -
Finlayson GD, Mackiewicz M, Hurlbert A. Color Correction Using Root-Polynomial Regression. IEEE Transactions on Image Processing 2015;24(5):1460-70. https://doi.org/10.1109/TIP.2015.2405336
» https://doi.org/10.1109/TIP.2015.2405336 -
Goñi SM, Salvadori VO. Color measurement: comparison of colorimeter vs. computer vision system. Food Measure 2017;11(2):538-47. https://doi.org/10.1007/s11694-016-9421-1
» https://doi.org/10.1007/s11694-016-9421-1 -
Hassine IB, Mezghani D, Belkadi A, et al. Design of smart vertical hydroponic system. Engenharia Agrícola 2023;43(5):e20220205. https://doi.org/10.1590/1809-4430-eng.agric.v43n5e20220205/2023
» https://doi.org/10.1590/1809-4430-eng.agric.v43n5e20220205/2023 - Hong G, Luo MR, Rhodes PA. A study of digital camera colorimetric characterization based on polynomial modeling. Color Research & Application 2001;26(1):76-84. https://doi.org/10.1002/1520-6378(200102)26:1<76::AID-COL8>3.0.CO;2-3
-
Kamath R, Balachandra M, Prabhu S. Raspberry Pi as visual sensor nodes in precision agriculture: a study. IEEE Access 2019;7:45110-22. https://doi.org/10.1109/ACCESS.2019.2908846
» https://doi.org/10.1109/ACCESS.2019.2908846 -
Kucuk A, Finlayson GD, Mantiuk R, et al. Performance comparison of classical methods and neural networks for colour correction. Journal of Imaging 2023;9(10):214. https://doi.org/10.3390/jimaging9100214
» https://doi.org/10.3390/jimaging9100214 -
Luo MR, Cui G, Rigg B. The development of the CIE 2000 colour-difference formula: CIEDE2000. Color Research & Application 2001;26(5):340-50. https://doi.org/10.1002/col.1049
» https://doi.org/10.1002/col.1049 - McCamy, SC, Marcus H, Davidson J. A color-rendition chart. Journal of Applied Photographic Engineering 1976;2(3):95-99.
-
Melgosa M. CIE94, History, Use, and performance. In: Shamey R, editor. Encyclopedia of color science and technology. Cham: Springer International Publishing; 2023:236-9. https://doi.org/10.1007/978-3-030-89862-5_13
» https://doi.org/10.1007/978-3-030-89862-5_13 -
Meng R, Yu Z, Fu Q, et al. Smartphone-based colorimetric detection platform using color correction algorithms to reduce external interference. Spectrochimica Acta Part A: Molecular and Biomolecular Spectroscopy 2024;316:124350. https://doi.org/10.1016/j.saa.2024.124350
» https://doi.org/10.1016/j.saa.2024.124350 -
Morchid A, Oughannou Z, Alami RE, et al. Integrated internet of things (IoT) solutions for early fire detection in smart agriculture. Results in Engineering 2024;24:103392. https://doi.org/10.1016/j.rineng.2024.103392
» https://doi.org/10.1016/j.rineng.2024.103392 -
Pecho OE, Ghinea R, Alessandretti R, et al. Visual and instrumental shade matching using CIELAB and CIEDE2000 color difference formulas. Dental Materials 2016;32(1):82-92. https://doi.org/10.1016/j.dental.2015.10.015
» https://doi.org/10.1016/j.dental.2015.10.015 -
Perez M del M, Ghinea R, Herrera LJ, et al. Dental ceramics: A CIEDE2000 acceptability thresholds for lightness, chroma and hue differences. Journal of Dentistry 2011;39:e37-e44. https://doi.org/10.1016/j.jdent.2011.09.007
» https://doi.org/10.1016/j.jdent.2011.09.007 -
Poynton CA. Rehabilitation of gamma. Proceedings of the SPIE 3299, 3rd Human Vision and Electronic Imaging; 1998 Jul 17; 1998. San Jose. CA: Photonics West '98 Electronic Imaging; 1998. p.232-49. https://doi.org/10.1117/12.320126
» https://doi.org/10.1117/12.320126 -
Reddy APC, Sandilya BVH, Annis Fathima A. Detection of eye strain through blink rate and sclera area using raspberry-pi. The Imaging Science Journal 2019;67(2):90-9. https://doi.org/10.1080/13682199.2018.1553343
» https://doi.org/10.1080/13682199.2018.1553343 -
Wei TY, Lin TH, Tasi YC. Comb color analysis of broilers through the video surveillance system in a poultry house. Brazilian Journal of Poultry Science 2024;26(1):1-8. https://doi.org/10.1590/1806-9061-2023-1891
» https://doi.org/10.1590/1806-9061-2023-1891 -
Westland S, Ripamonti C, Cheung V. Computational colour science using MATLAB. Haboken: John Wiley & Sons; 2012. https://doi.org/10.1002/9780470710890
» https://doi.org/10.1002/9780470710890 -
You M, Liu J, Zhang J, et al. A novel chicken meat quality evaluation method based on color card localization and color correction. IEEE Access 2020;8:170093-100. https://doi.org/10.1109/ACCESS.2020.2989439
» https://doi.org/10.1109/ACCESS.2020.2989439 - Yusoff ISM, Tamrin SBM, Ismail MH. Ergonomic perspective: Mismatch between seat drivers and anthropometric measures of elderly taxi drivers in Malaysia. International Journal of Integrated Engineering 2021;13(5):156-62.
-
Zhang TH, Yang T. Research on colour correction algorithm of art works based on mapping rules. International Journal of Arts and Technology 2022;14(1):24-39. https://doi.org/10.1504/IJART.2022.122449
» https://doi.org/10.1504/IJART.2022.122449
-
FUNDING
Ministry of Agriculture, Taiwan (113FI-17.1.2-AD-02).
-
DATA AVAILABILITY STATEMENT
The data underlying the results presented in this paper are not publicly available at this time, but may be obtained from the authors upon reasonable request.
-
DISCLAIMER/PUBLISHER’S NOTE
The published papers’ statements, opinions, and data are those of the individual author(s) and contributor(s). The editor(s) disclaim responsibility for any injury to people or property resulting from any ideas, methods, instructions, or products referred to in the content.
The data underlying the results presented in this paper are not publicly available at this time, but may be obtained from the authors upon reasonable request.