 Research on Early Diagnosis Methods for Broiler Chicken Diseases Based on Swarm Intelligence Optimization Algorithms and Random Forest
ABSTRACT
The persistent emergence of poultry epidemics (e.g., Newcastle disease) jeopardizes operational stability and sustainability in commercial poultry production systems. Current diagnostic approaches for broiler diseases predominantly rely on subjective clinical assessments. These methodological limitations compromise operational efficiency through diagnostic delays and production chain disruptions, requiring automated detection systems capable of real-time pathological evaluation. A baseline Random Forest (RF) model achieved 94.01% diagnostic accuracy for broiler diseases. To optimize performance, we developed RF_WOA_DBO-an integrated algorithm combining RF with enhanced Whale Optimization Algorithm (WOA) for global feature selection and modified Dung Beetle Optimizer (DBO) for local parameter tuning. The optimized parameters were subsequently implemented in the RF classifier training. The composite algorithm reduced feature redundancy by approximately 30% while ensuring the effective retention of critical diagnostic indicators. The RF_WOA_DBO hybrid model achieved an accuracy of 98.29%, representing a 4.28% improvement over the baseline RF model. Comparative analysis revealed that traditional PCA methods risk losing essential pathological features by disregarding nonlinear data relationships, whereas deep learning requires substantial computational resources and high-quality datasets. In contrast, RF_WOA_DBO provides computationally efficient solutions suitable for resource-constrained poultry farming environments. This study introduces a novel methodology for broiler disease diagnosis and prediction, substantially improving accuracy and efficiency while maintaining low computational costs. The proposed framework can be seamlessly integrated into IoT-based broiler health monitoring platforms, offering valuable theoretical foundations and technical support for disease detection and prevention in poultry farming.
Keywords:
Broiler diseases; random forest; whale optimization algorithm; dung beetle optimization
INTRODUCTION
Poultry diseases are a critical constraint in poultry production and have long impeded the development of the industry, especially in broiler farming (Xu et al., 2023). Early diagnosis of broiler diseases is essential for promoting sustainable and healthy development in the broiler industry (Milosevic et al., 2019). Traditional methods primarily rely on manual monitoring, which is time-consuming, labor-intensive, and prone to human error due to subjective judgment (Ojo et al., 2022). The health status of poultry is often reflected in their physiological, physical, and behavioral clinical symptoms, such as abnormal vocalizations caused by respiratory diseases, elevated body temperature due to fever, and behavioral abnormalities resulting from pathogen infections (He et al., 2022; Nakrosis et al., 2023). As such, symptom detection technologies can monitor broiler health in a continuous, non-invasive, and automated manner, which could assist in the early warning decision-making process.
With technological advancements, machine learning has increasingly been used in medical diagnosis (Dong et al., 2024; Sadr et al., 2024), but its application in poultry health monitoring remains in the exploratory stage. For instance, in dairy sheep farms, a model using Support Vector Machines achieved a high accuracy rate for predicting subclinical mastitis prevalence, highlighting the potential of machine learning in animal health prediction (Kiouvrekis et al., 2024). When dealing with complex, multidimensional data, feature selection and parameter optimization are two key challenges. Feature selection identifies the most representative symptoms or behavior patterns, while parameter optimization affects model performance and accuracy. Researchers have recently explored optimization algorithms for feature selection and parameter optimization in machine learning models, aiming to improve the accuracy and efficiency of poultry disease prediction. Common algorithms include stepwise variable selection, the Boruta algorithm, cross-validation, grid search, and the Tree-based Pipeline Optimization Tool (TPOT). For example, researchers used stepwise variable selection to identify key features and the Boruta random forest algorithm for feature importance evaluation, achieving risk prediction for infectious bronchitis in broilers through machine learning models (Campler et al., 2024). In pig disease prediction, 10-fold cross-validation combined with XGBoost adjusted key tree parameters, enabling prediction of Porcine Epidemic Diarrhea Virus (PEDV) two weeks in advance (Paploski et al., 2021). In dairy cow disease prediction, the XGBoost algorithm predicted ketosis risk using prepartum indicators, with five-fold cross-validated grid search optimizing key parameters (Wang et al., 2023). For white-feathered broiler health monitoring, labeled audio datasets were used to train classification models, and grid search optimized the best-performing model’s parameters, yielding a reliable classification model (Sun et al., 2023). Another study on dairy cow behavior used the TPOT machine learning method, followed by grid search hyperparameter optimization to enhance the early diagnosis of digital dermatitis in dairy cows (Magana et al., 2023).
In these studies, algorithm performance varied across different datasets. Stepwise variable selection reduces feature dimensionality but can lead to local optima and overfitting in high-dimensional data (Suarez et al., 2023). The Boruta algorithm handles high-dimensional data well and offers comprehensive feature evaluation, though it is computationally intensive. Grid search explores the entire parameter space but has high computational complexity and time costs, particularly for large datasets (Bergstra & Bengio, 2012). The TPOT method automates model pipeline optimization but may encounter efficiency issues with big data. Researchers often treat feature selection and parameter optimization separately, a single-optimization approach that may limit model performance improvement. Thus, applying hybrid algorithms that combine feature selection and parameter optimization offers a new perspective for our research.
Poultry disease detection typically relies on multidimensional data such as physiological and behavioral metrics, and extracting key features to build high-accuracy predictive models is a major challenge. Traditional methods like deep learning, principal component analysis (PCA), and individual evolutionary algorithms each have their strengths and weaknesses in feature extraction and parameter optimization. Deep learning can automatically capture complex features, but it often requires massive amounts of labeled data and high computational resources, making it impractical for small to medium-sized farms. Although PCA can effectively reduce data dimensionality, its linear assumptions may overlook non-linear relationships, potentially leading to the loss of critical pathological features(Jolliffe & Cadima, 2016). While individual evolutionary algorithms offer global search capabilities, they often struggle to balance feature selection with model parameter tuning, making them prone to local optima. Given the complex farming environment, low data standardization, and diverse manifestations of disease symptoms, data collection faces many challenges, resulting in a scarcity of poultry disease symptom datasets. Exploring algorithms that are less dependent on initial parameters and capable of adaptive model parameter tuning is therefore crucial for the early diagnosis of poultry health.
To tackle these challenges, this study proposes a hybrid optimization strategy (WOA_DBO), combining the Whale Optimization Algorithm (WOA) and the Dung Beetle Optimizer (DBO). High-dimensional data include many features, and global search ensures no potentially optimal feature combinations are missed (Chen et al., 2012). There are no relevant studies on the use of swarm optimization algorithms such as WOA and DBO in poultry disease detection; however, research on WOA with heart disease data indicates that this algorithm can effectively identify optimal features (Atimbire et al., 2024). The WOA algorithm has strong global search capabilities, effectively handling high-dimensional, nonlinear problems by identifying optimal feature subsets to reduce data redundancy (Mirjalili & Lewis, 2016). The DBO algorithm simulates dung beetle foraging behavior and adaptability, efficiently exploring complex parameter spaces, avoiding local optima, and identifying optimal parameter combinations for machine learning models (Xue & Shen, 2023). The WOA_DBO hybrid algorithm uses both feature selection and parameter optimization, reducing feature redundancy and ensuring the model operates with optimal parameters, maximizing predictive performance.
To address the misdiagnosis caused by non-critical symptom features in broilers and the impact of machine learning models being trapped in local optima rather than achieving global generalization, this study applies the WOA_DBO algorithm to a broiler disease symptom feature database. It automatically screens key features from abnormal physiological and behavioral data while simultaneously optimizing model parameters to ensure an optimal balance between global search and local adjustment. Compared to traditional methods, the algorithm demonstrates enhanced robustness, providing strong technical support for early warning and precise prevention and control of broiler diseases.
MATERIALS AND METHODS
This study primarily employs the Random Forest (RF) model to train high-dimensional, small-sample broiler disease data and compares it with three other machine learning models: Decision Tree (DT), Adaptive Boosting (AdaBoost), and Support Vector Machine (SVM). To enhance model accuracy, we use the Whale Optimization Algorithm (WOA) for feature selection, known for its strong global search capabilities and suitability for high-dimensional data. Additionally, we use the Dung Beetle Optimization Algorithm (DBO) to fine-tune the key parameters of the machine learning models, which excels in local search optimization.
Feature and Class Selection in the Datase
This study has established a database of symptom characteristics for broiler diseases, providing an important resource for research and diagnosis in broiler disease. The database compiles detailed veterinary records from 12 institutions, including Dexiang Group, the National Broiler Industry Technology System Hebei Comprehensive Experimental Station, and Wens Group in China, covering multidimensional symptom characteristics and anatomical results of 398 diseased white-feathered broilers from September 8, 2017, to August 10, 2023. The age of the white-feathered broilers (chicks, pullets and adults) is included as a feature for disease diagnosis. Feature selection focused on physiological and behavioral changes observed in broilers affected by diseases. Although some diseases share similar features, certain characteristics are unique to specific diseases. Veterinarians from the 12 companies recorded detailed observations of physiological and behavioral abnormalities in diseased broilers, with diagnoses confirmed via necropsy. This comprehensive dataset enables a thorough assessment of various infectious broiler diseases. After consulting veterinarians, we identified five highly infectious diseases with high mortality rates to which broilers are particularly susceptible. These diseases were Newcastle Disease (ND), Infectious Bursal Disease (IBDV), Infectious Bronchitis (IB), Avian Infectious Laryngotracheitis (AILT), and Infectious Coryza (IC), as shown in Table 1. These 264 characteristics were grouped into 39 feature classes, as shown in Table 2.
The dataset is high-dimensional and multi-categorical. Details on the number of classes, samples, and features are provided in Table 3. The dataset needs to be preprocessed before classification training.
Data Preprocessing
To avoid data redundancy during training, we removed four duplicate records from the collected broiler disease data. Next, we addressed outliers. After consulting veterinarians, we identified three records where symptoms were clearly inconsistent with the final diagnosis. Given likely data entry errors and the inability to verify the original data promptly, these records were deleted. We identified a common issue in the dataset: many feature records were missing. To handle these missing feature data, we first analyzed the distribution of the missing values. If a feature is missing in over 75% of the records, it was considered unreliable and removed. Among the 398 collected records, we identified and removed 11 outlier records, resulting in a final dataset of 387 records. For features with missing value ratios between 60% and 75%, imputation was performed based on expert knowledge using the mode (the most frequently occurring value) to ensure data consistency.
After consulting industry experts, we identified 20 features that did not affect the diagnosis of the five broiler infectious diseases. These features added unnecessary dimensionality without contributing meaningful information, so they were removed. To standardize feature representation, we scaled the features based on the symptom-disease-weight relationships. The original dataset did not contain numerical values but rather categorical descriptions such as ‘elevated body temperature’ or ‘summer.’ Using the weight matrix from the ‘Poultry Infectious Disease Intelligent Diagnosis Card’( Zhang & Yang., 2023), these descriptions were converted into numerical values. For example, for ND and IC diseases, the weight for ‘elevated body temperature’ is 0 and 5, respectively, while the weight for ‘summer’ is 5 and 3. This conversion ensures that the scaled features reflect their importance while maintaining clinical relevance. After data preprocessing, the final dataset is shown in Table 3, and the deleted redundant features are listed in Table 4.
Machine Learning Classification Algorithm
Currently, machine learning algorithms are widely used to analyze high-dimensional biomedical data (Kaur & Kumari, 2020). After data cleaning and preprocessing, the dataset is ready for training and testing. In this study, we split the dataset 7:3, meaning that 70% of the data is used for training and 30% for testing. We investigated a combination of machine learning algorithms in this work.
Random Forest
Random Forest is a powerful and flexible ensemble learning algorithm that follows the basic principles of decision tree classifiers, but combines multiple decision trees to leverage the advantages of ensemble learning (Parmar et al., 2019). This approach improves model performance and generalization capabilities. Random Forest overcomes the complexity, local optimal convergence, and overfitting issues of individual decision trees by combining them into a multi-classifier system.
An important parameter in Random Forest that significantly affects the overall results is the number of decision trees, commonly referred to as the number of trees in the forest (n_estimators). Increasing the number of trees helps improve model stability and generalization, as the vote from multiple trees reduces the risk of overfitting. However, too many trees can increase computational costs. Another critical parameter in Random Forest is max_depth, which influences each tree’s depth. Both n_estimators and max_depth need to be considered for their combined effect on the performance of the Random Forest model.
Decision Tree
The Decision Tree algorithm is widely used in classification, prediction, and rule extraction in artificial intelligence (Tulpan, 2023). It is a supervised learning algorithm that constructs a tree-like structure where decisions are made based on input features, progressively organizing the dataset into smaller subsets to classify and predict different disease conditions. Decision Trees typically consider local optimal choices, which can lead to overfitting and underfitting risks. The most important parameter influencing a Decision Tree’s overall performance is its depth (max_depth) (Chao et al., 2023). The depth determines the tree’s complexity and its fit to the training data. Increasing the depth allows the model to better fit the training data, but excessive depth can cause the model to overfit, learning the noise or specific samples in the training data.
Adaptive Boosting
AdaBoost is an ensemble learning method that improves classification performance by sequentially training multiple weak classifiers and combining them into a strong classifier. Compared to traditional algorithms like KNN, AdaBoost can better handle high-dimensional data and offers higher classification accuracy and generalization ability. In AdaBoost, each base classifier (usually a decision tree) is trained to minimize the classification errors of the previous classifiers. The training process focuses on “difficult” regions of the sample space, where samples were misclassified by previous classifiers. By adjusting the sample weights in each training round, AdaBoost increasingly concentrates on misclassified samples, enhancing classifier performance. Since the weak learner in AdaBoost for this study is a decision tree, we chose to adjust the max_depth parameter for better comparison and optimization.
Support Vector Machine
SVM is a powerful supervised learning algorithm used for classification and regression problems, though it is more commonly applied to classification. SVM excels in solving complex problems and handling large-scale data. In SVM, the most critical parameter affecting the overall results is the penalty term (C value). The C value represents the degree to which misclassification is tolerated during training. A higher C value makes the model focus more on training data accuracy, potentially making it sensitive to noise, while a lower C value allows more classification errors, potentially making the model more robust.
Swarm Intelligence Optimization Algorithms
Metaheuristic intelligent algorithms encompass two types of nature-inspired algorithms: evolutionary algorithms and swarm intelligence optimization algorithms that mimic the collective behavior of organisms (Abu Khurma et al., 2022). Swarm intelligence optimization algorithms can be applied to encapsulated feature selection approaches. Some swarm intelligence optimization algorithms that have been applied to high-dimensional feature selection include WOA , Bat Algorithm (BA) (Yang, 2010), Grey Wolf Optimization (GWO) (Mirjalili et al., 2014), DBO, and so on.
Whale Optimization Algorithm
WOA simulates the hunting behavior of whales to perform search optimization. The algorithm employs three strategies-encircling, spiral updating, and global search-to balance exploration and exploitation. In feature selection tasks, WOA is primarily used to select highly correlated features while avoiding local optima. It dynamically adjusts its search parameters so that individual whales gradually converge to the optimal solution. For a detailed description, please refer to the appendix.
Dung Beetle Optimization Algorithm
DBO mimics the navigational behavior of dung beetles rolling dung balls, utilizing rolling strategies, dancing behavior, reproduction, and foraging mechanisms to achieve global optimization. With its strong randomness and ability to escape local optima, DBO is especially effective in hyperparameter optimization. In this study, DBO is mainly used to adjust the key hyperparameters of the machine learning model to enhance classification performance. For a detailed description, please refer to the appendix.
Combined Algorithm
Multidimensional complex data is characterized by high dimensionality, high redundancy, low value density, and massive volume of data. If the number of feature sets is denoted as “m”, the number of searches required when using a basic solution will be 2m (Zhong et al., 2001). Thus, feature selection is a combinatorial non-deterministic polynomial-time hard (NP-hard) problem, with the solution time growing exponentially (Gheyas & Smith, 2010). Therefore, feature selection is one of the most critical preprocessing steps in machine learning when dealing with high-dimensional data (Liu & Yu, 2005). In machine learning problems, classification accuracy is closely related to the choice of features in the dataset. The primary objective of feature selection is to minimize redundant and irrelevant features, and subsequently identify the optimal subset of features from the dataset that leads to the best modeling performance, thus improving the algorithm’s performance (Wang et al., 2016). Currently, the use of metaheuristic algorithms for feature selection is a highly promising technique.
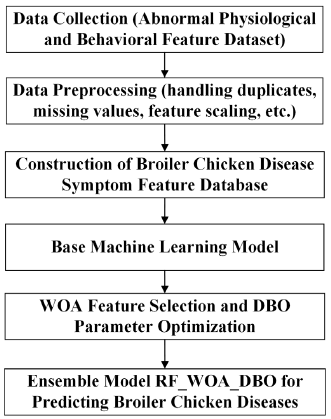
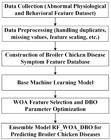
Figure 1 shows the workflow of the combination algorithm (e.g. RF_WOA_DBO). We use WOA as the method for feature selection method in the broiler disease dataset. However, this new algorithm has a pressing problem to solve, which is to find a balance between the number of selected features and the final classification accuracy. Therefore, in the algorithm proposed in the paper, we introduce the weight parameter ω (omega), and iteratively optimize the accuracy and select features according to the different fitness values of ω, aiming to find a better solution. An “onecnt” function is defined to complete the counting function for the selected features, recording the selected features with a value of “1”. A sigmoid activation function is introduced to control the selected features. The algorithm ultimately determines the accuracy of the test set (testAcc), the count of selected features (featCnt) and the best individual (bestpop), the highest accuracy in the final output iteration, and its selected features.
Additionally, in the optimization of parameters, to prevent the Dung Beetle Optimization (DBO) algorithm from getting stuck in local optima, Tent chaotic mapping is used to initialize the population, enhancing the randomness of the initial population. Tent mapping:
In the Dung Beetle Optimization algorithms (DBO), utilizing values generated by the Tent chaotic map with 0 < a < 1 as the initial population can prevent the algorithm from falling into local optima, thus enhancing its global search capability and optimization precision. Additionally, Equation (1) mentions the convergence factor R , where in the traditional DBO, R decreases linearly. However, the convergence process of the algorithm is often nonlinear. Therefore, R is modified to decrease nonlinearly instead of linearly, as shown in Equation (2). This improvement can enhance the algorithm’s global search ability and prevent it from getting trapped in local optima.
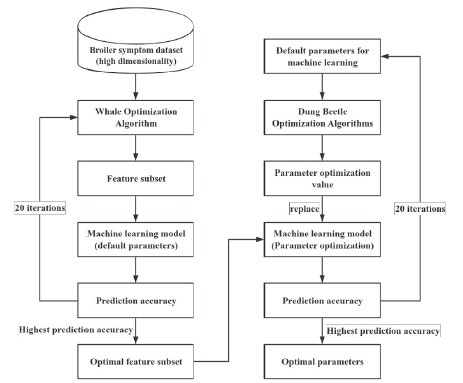
Figure 2 illustrates the basic workflow of the combined algorithm, where the WOA is utilized to obtain the optimal feature subset and the DBO algorithm is employed to acquire the optimal parameter values. In the Random Forest algorithm, the selection of the parameters “n_estimators” and “max_depth” was approached using two methods. The first method involved setting “max_depth” to its default value and iterating “n_estimators” 20 times, and recording the value of “n_estimators” that achieved the highest accuracy. Then, while keeping the selected “n_estimators” value fixed, “max_depth” was iterated 20 times, recording the value of “max_depth” that achieved the highest accuracy. This method resulted in the identification of two key parameters. The second method used an improved DBO algorithm to adaptively iterate the two parameters “n_estimators” and “max_depth,” 20 times to find the optimal solution.

Fundamental process of the combined algorithm for obtaining the optimal feature subset and optimal parameter values.
For the decision tree and adaptive boosting parameter selection, we chose “max_depth.”. In decision trees, “max_depth” is a crucial parameter, whereas in AdaBoost, although “max_depth” is not a fundamental parameter, we still selected it for adjustment. This choice was made for two main reasons: first, in this study, the weak learner for AdaBoost was a decision tree, and “max_depth” is an important parameter for decision trees; second, we aimed to compare the impact of “max_depth” when used in decision trees as standalone classifiers and as weak learners in AdaBoost. Two methods were used: one involved iterating “max_depth” 20 times and recording the value that achieved the highest accuracy, and the other used the dung beetle optimization algorithm to adaptively iterate the “max_depth” parameter 20 times to find the optimal solution.
For the SVM parameter “C,” we also used two methods. One involved iterating “C” 20 times and recording the value that achieved the highest accuracy, and the other used the dung beetle optimization algorithm to adaptively iterate the “C” parameter 20 times to find the optimal solution. In summary, by introducing the weight parameter ω and the S-shaped activation function, and combining the global exploration capability of the whale optimization algorithm with the local exploitation capability of the dung beetle optimization algorithm, we found a balance between feature selection and classification accuracy. The effectiveness of the proposed method was verified through experiments.
RESULTS
To implement the proposed method, we used Python version 3.7.13 on a Windows 10 laptop equipped with an Intel Core i5-8250U processor (1.6 GHz) and 8GB of RAM.
Feature Selection
We combine Random Forest and three other machine learning methods with the improved feature selection Whale Optimization Algorithm (WOA). This model reduces the dimensionality of the feature set by eliminating redundant features in the data space, thereby reducing computation time and complexity while improving the accuracy of broiler disease classification. The maximum number of iterations was set to 20. While WOA eliminates redundant features, it strives to retain those most critical for disease classification. Through feature importance analysis, we found that several features significantly contribute to classifying broiler diseases-specifically, diarrhea, respiratory distress, reduced appetite, and disheveled feathers, all of which rank highly in the model. Table 5 and Table 6 show the number of features selected and the classification accuracy for each iteration of the four machine learning methods. It can be observed that the number of selected features does not directly correlate with classification accuracy. We recorded the maximum classification accuracy achieved and the number of features selected at that point for subsequent training.
- The number of features selected and classification accuracy of WOA in the first 10 iterations of four machine learning methods. N stands for the number of features, and A stands for classification accuracy.
- The number of features selected and classification accuracy of WOA in the last 10 iterations of four machine learning methods.
From Table 5 and Table 6, the RF achieved a maximum accuracy of 0.959 with 178 selected features. The DT achieved a maximum accuracy of 0.863 with 155 selected features. The AdaBoost achieved a maximum accuracy of 0.901 with 189 selected features. The SVM achieved a maximum accuracy of 0.959 with 171 selected features. We used the feature sets corresponding to these maximum accuracies for further training. This approach demonstrates the effectiveness of combining machine learning algorithms with feature selection optimization to enhance the accuracy and efficiency of broiler disease diagnosis.
Parameter Optimization
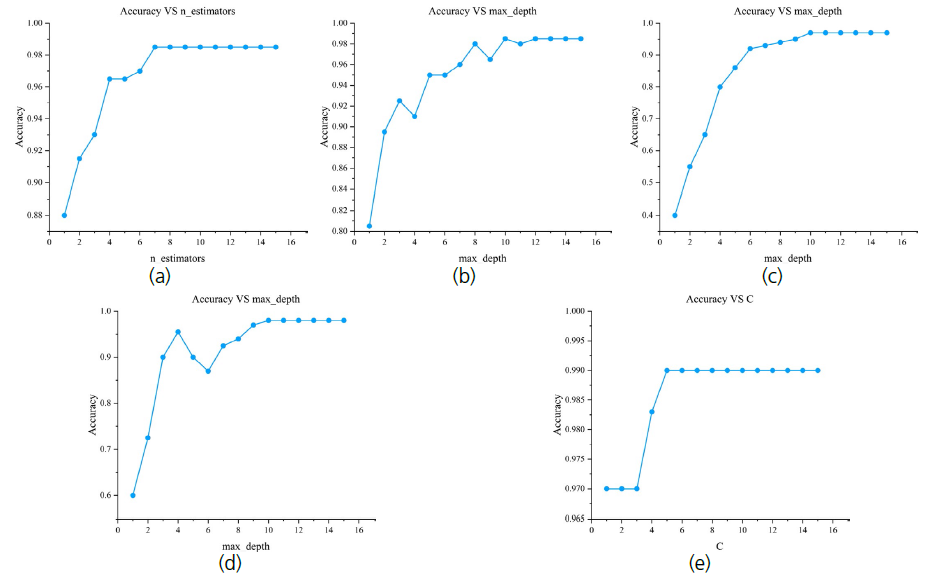
Next, we used the optimization method mentioned in the “combination algorithm” for each of the four machine learning methods, starting with the first method. For Random Forest, we iterated over two parameters. As shown in Figure 3, comparison of classification accuracy and key parameter iterations for four machine learning methods: (a) Iterations of the n_estimators parameter for Random Forest; (b) Iterations of the max_depth parameter for Random Forest; (c) Iterations of the max_depth parameter for Decision Tree; (d) Iterations of the max_depth parameter for Adaptive Boosting; (e) Iterations of the C parameter for Support Vector Machine., we can see that when the highest accuracy is achieved, the value of n_estimators is 7 and the value of max_depth is 10. For Decision Tree, the highest accuracy is obtained when max_depth is set to 10. For Adaptive Boosting, the highest accuracy is also achieved when max_depth is set to 10. For Support Vector Machine, the highest accuracy is achieved when the value of C is 5.

Comparison of classification accuracy and key parameter iterations for four machine learning methods: (a) Iterations of the n_estimators parameter for Random Forest; (b) Iterations of the max_depth parameter for Random Forest; (c) Iterations of the max_depth parameter for Decision Tree; (d) Iterations of the max_depth parameter for Adaptive Boosting; (e) Iterations of the C parameter for Support Vector Machine.
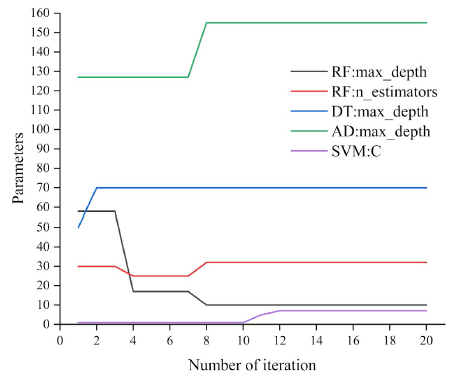
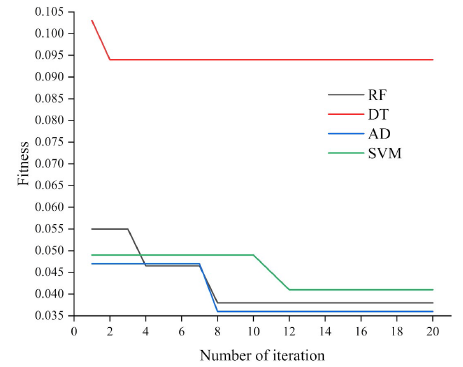
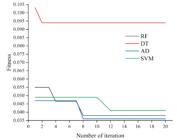
The second method involves using the DBO algorithm to optimize key parameters for the four machine learning methods. Figure 4 shows the rapid convergence of two parameters over 20 iterations using the DBO algorithm. When the highest accuracy is achieved, the value of n_estimators for Random Forest is 31, and the value of max_depth is 10. For Decision Tree, the value of max_depth is 70. For Adaptive Boosting, the value of max_depth is 155. For Support Vector Machine, the value of C is 7. These parameter values are the optimal values selected by the DBO algorithm in this iteration and are used as important parameters for model training. Figure 5 shows the fitness values of DBO during the iterative process, reflecting the quality of the optimal solution found during the algorithm’s iterations, where a smaller fitness value indicates a better solution.
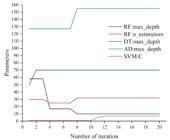
The DBO algorithm quickly converges on the important parameters of the classifier over 20 iterations.
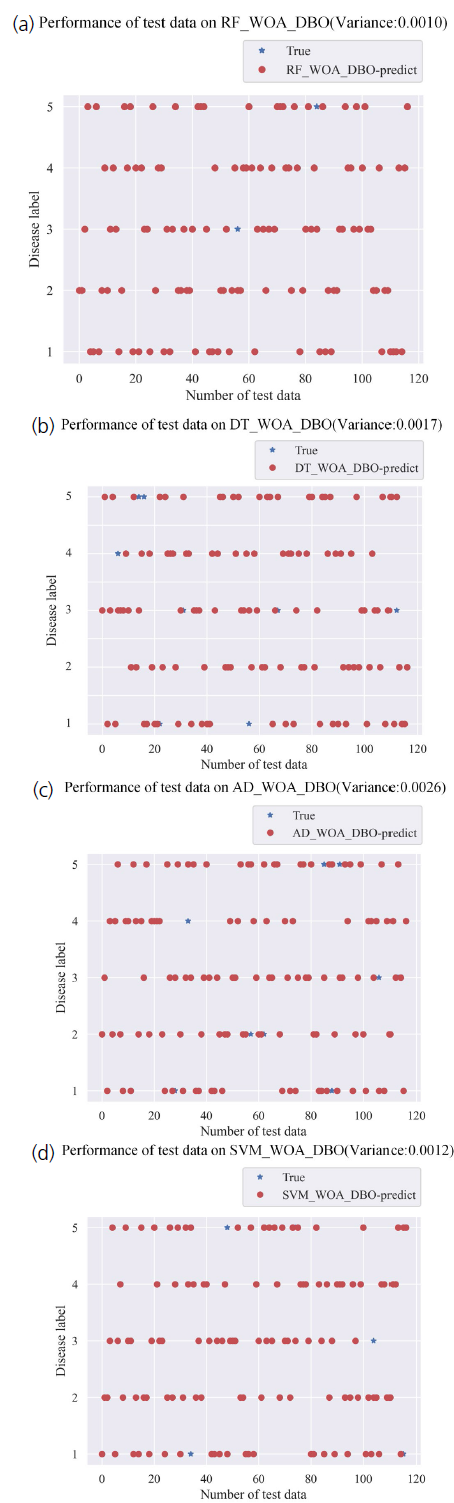
As shown in Table 7, through 20 iterations and a comparison of feature selection and parameter optimization using the DBO method, the selected features and iteratively optimized parameters were used with four machine learning algorithms for broiler disease classification. The accuracy on both the training set and the test set was relatively high. Compared to the results from 20 iterations, the classification performance using the DBO selection method was better. Among them, RF_WOA_DBO had the highest prediction accuracy according to statistical validation methods using variance and p-values. As shown in Figure 6(a), the RF_WOA_DBO hybrid model achieved a classification accuracy of 98.29% with a variance of 0.0010. The corresponding p-value was less than 0.01, indicating that the results are statistically significant and robust. Although its computation time is relatively longer, a runtime of 20.83 seconds remains within acceptable limits. This hybrid model exhibits optimal memory usage, making it a highly optimized choice in terms of both performance and resource consumption. After using the WOA algorithm with the four machine learning methods, parameter optimization was performed using both a 20-iteration method and the DBO algorithm. The comparison includes parameter optimization, model classification accuracy, runtime and memory usage and is shown in Table 7.
- Parameter optimization, model classification accuracy, runtime and memory usage of the 4 combined algorithms.

Comparison of the classification fit plots and variance values for the four combined machine learning algorithms: (a) Fit between the predicted and actual values for RF_WOA_DBO; (b) Fit between the predicted and actual values for DT_WOA_DBO; (c) Fit between the predicted and actual values for AD_WOA_DBO; (d) Fit between the predicted and actual values for SVM_WOA_DBO.
DISCUSSION
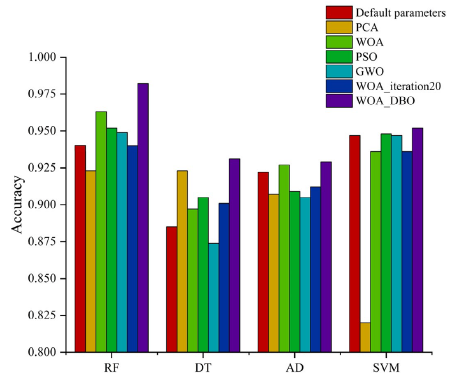
The experimental results demonstrate that the synergistic integration of feature selection and parameter optimization via the WOA_DBO algorithm is the core mechanism for enhancing broiler disease diagnosis performance. Compared with traditional manual approaches, this method not only accelerates diagnostic speed but also effectively reduces human error. In high-dimensional datasets, the WOA-based feature selection method successfully reduced feature dimensionality by approximately 30% while preserving critical diagnostic indicators (e.g., diarrhea, respiratory distress, appetite loss, and feather ruffling), thereby providing more concise and efficient data inputs for subsequent classification. As illustrated in Figure 7, we evaluated four machine learning models using different feature selection methods and optimization techniques. Without feature selection or dimensionality reduction and using default parameters, the RF model achieved an accuracy of 94.01%. Except for the decision tree model, all other models underperformed with PCA-based feature selection compared to using raw data. While PCA excels at dimensionality reduction and redundancy elimination, its retention of limited principal components risks discarding crucial predictive information (Vinutha et al., 2023). Although researchers have employed PCA and PLS regression to extract valuable insights from behavioral variables and performance parameters (e.g., milk production)(Dittrich et al., 2021), PCA’s variance explanation exhibited increasing bias during test iterations, potentially eliminating low-variance information critical for disease classification.
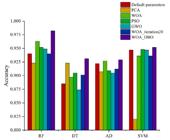
Comparison of classification accuracy for four machine learning methods using different optimization methods.
Comparative analysis with other swarm intelligence optimization algorithms revealed WOA’s superior performance in Random Forest and AdaBoost models. Despite implementing an enhanced WOA algorithm with 20 parameter tuning iterations, most models (excluding decision trees) experienced accuracy degradation, underscoring the importance of appropriate parameter optimization in machine learning. This challenge was addressed through DBO-based parameter optimization, which demonstrated superior adaptability across various machine learning models compared to alternative algorithms.
In the original dataset, Random Forest exhibited suboptimal accuracy without feature selection (Yan et al., 2023). However, WOA implementation enabled it to surpass other machine learning methods, achieving peak performance. These findings emphasize feature selection’s pivotal role in model enhancement. Thus, optimal operational efficiency and accuracy require careful selection of machine learning models coupled with task-specific feature engineering and parameter tuning. While WOA_DBO demonstrates advantages in feature selection and parameter optimization, its complex search mechanism incurs notable computational resource demands, necessitating careful balance between performance optimization and practical feasibility.
Compared to the dynamic CSA algorithm (DCSA) (Jiang et al., 2024), this research balances exploration and exploitation using the WOA_DBO algorithm, enabling flexible feature selection across different datasets. DCSA’s reliance on KNN classifiers as feature subset evaluators limits flexibility when alternative classifiers are required. In recent years, deep learning techniques have achieved remarkable success in tasks such as image processing. However, this success often depends on large-scale labeled datasets and significant computational resources. Moreover, the vast parameter space of neural networks, along with the complexity of the tuning process and the propensity to become trapped in local optima, poses substantial implementation challenges for many small to medium-sized farms (Kamilaris & Prenafeta-Boldú, 2018).
Some researchers have applied image processing techniques to analyze the skeletal conditions of diseased broilers for early disease detection (Zhuang et al., 2018; Zhuang & Zhang, 2019). Others have used deep learning to classify the state of poultry litter to assist in disease detection (Wang et al., 2019). Yet, these approaches are limited in that they cannot directly determine the type of disease, and their performance may be affected by the natural anatomical variations of the birds. They also require a large number of high-quality images and detailed annotations, resulting in high data collection costs. Additionally, the feature extraction process in deep learning lacks interpretability, rendering the diagnostic basis less transparent and potentially making it difficult for farm personnel to understand the model’s decision-making process.
In another study, researchers input both explicit and implicit features of diseased cows into a BiLSTM-CNN hybrid network, which enabled accurate disease diagnosis (Haodong Wang et al., 2023). However, the dataset contained many artificially simulated cases that might differ in distribution from real-world cases. Moreover, constructing and maintaining a knowledge graph requires continuous investment, and the accuracy of entity linking directly affects the extraction of implicit features. The BiLSTM-CNN hybrid network also has a large number of parameters, leading to high training and inference costs that could restrict its deployment in resource-limited environments, such as on edge devices.
In contrast, the RF_WOA_DBO composite algorithm utilizes WOA for global feature selection and DBO for local parameter optimization under small dataset conditions, thereby fully leveraging the strengths of both global and local search strategies to improve model accuracy. However, it is important to recognize the complexity of the WOA_DBO search mechanism and the challenges associated with acquiring poultry disease symptom data. These factors must be carefully considered when applying the model in real-world scenarios.
The RF_WOA_DBO model, with its high accuracy, acceptable runtime, and low memory usage, shows tremendous potential in broiler disease diagnosis. Although its runtime may be slightly insufficient in scenarios that demand extreme responsiveness (such as sudden outbreaks or rapidly spreading epidemics), the integration of the WOA_DBO_RF model with IoT systems enables the construction of a highly intelligent broiler health monitoring platform. This platform deploys various devices-such as temperature and humidity sensors, cameras, and gas detectors-at poultry farms, using image processing, audio analysis, and cloud data uploading techniques to achieve real-time collection of environmental, physiological, and behavioral data. After initial processing at the edge, the data is transmitted to the cloud and added to a broiler disease symptom database, where the model performs data fusion for diagnostic purposes to provide early warning of disease indicators. Once abnormalities are detected, the system can automatically trigger alerts, adjust environmental parameters, or isolate sick birds, thereby facilitating rapid intervention and effectively reducing the risk of epidemic spread.
Future work will expand the broiler disease symptom dataset’s scale and diversity, incorporating multimodal data from image recognition, acoustic analysis, and thermal imaging to capture subtle disease indicators. These multimodal inputs will be converted into structured textual data for RF_WOA_DBO-based prediction, establishing a comprehensive early diagnosis system. We plan to extract poultry domain knowledge from open-source large models (e.g., DeepSeek) to construct symptom-disease association graphs, enhancing model interpretability and generalization. Exploration of alternative machine learning algorithms integrated with advanced swarm intelligence techniques aims to further optimize accuracy while reducing dimensionality. Practical deployment challenges-including dynamic data updates, real-time computation, and IoT integration-will be addressed through investigations combining swarm intelligence with edge computing, cloud platforms, and sensor networks, ultimately advancing sustainable poultry industry development through intelligent health monitoring systems.
CONCLUSION
This study introduces a high-dimensional, small-sample broiler disease symptom dataset covering five common infectious diseases in broilers along with 246 physiological and behavioral features. By employing an improved WOA for global feature selection (reducing dimensions by approximately 30%) and combining it with DBO for key parameter optimization, the hybrid WOA_DBO algorithm was integrated with four machine learning methods. Notably, the RF_WOA_DBO model demonstrated a disease prediction accuracy of 98.29%-an improvement of 4.28% over the baseline RF model-while maintaining low cost, high robustness, and interpretability. These findings provide valuable theoretical and technical support for the detection and prevention of diseases in poultry farming. Future work will expand the scale and diversity of the broiler disease symptom dataset and explore the integration of perceptual technologies such as image recognition, audio analysis, and infrared thermography to capture more subtle multi-source symptom data including external manifestations, abnormal vocalizations, and temperature anomalies in broilers. In addition, plans are underway to leverage poultry-related knowledge extracted from open-source large models like DeepSeek to construct a symptom-disease association graph, thereby enhancing the model’s interpretability and generalization capabilities.
ACKNOWLEDGEMENTS
We thank the anonymous reviewers and editors for their constructive feedback and suggestions, which significantly improved the quality of this paper. Thanks to the poultry farming enterprises and farmers for providing essential data, resources, and practical insights, which were vital to this research. We also thank the technical support of Pycharm, Python, scikit-learn, and MySQL.
REFERENCES
-
Abu Khurma R, Aljarah I, Sharieh A, et al. A review of the modification strategies of the nature inspired algorithms for feature selection problem. Mathematics 2022;10:464. https://doi.org/10.3390/math10030464
» https://doi.org/10.3390/math10030464 -
Atimbire SA, Appati JK, Owusu E. Empirical exploration of whale optimisation algorithm for heart disease prediction. Scientific Reports 2024;14:4530. https://doi.org/10.1038/s41598-024-54990-1
» https://doi.org/10.1038/s41598-024-54990-1 -
Bergstra J, Bengio Y. Random search for hyper-parameter optimization. Journal of Machine Learning Research 2012;13:281-305. https://doi.org/10.5555/2503308.2188395
» https://doi.org/10.5555/2503308.2188395 -
Cao R, Bao L, Cui J, et al. Review of database system parameter optimization methods. Journal of Computer Research and Development 2023;60(3):635-53. https://doi.org/10.7544/issn1000-1239.202110976
» https://doi.org/10.7544/issn1000-1239.202110976 -
Campler MR, Cheng T-Y, Lee C-W, et al. Investigating the uses of machine learning algorithms to inform risk factor analyses: The example of avian infectious bronchitis virus (IBV) in broiler chickens. Research in Veterinary Science 2024;171:105201. https://doi.org/10.1016/j.rvsc.2024.105201
» https://doi.org/10.1016/j.rvsc.2024.105201 -
Chen H-L, Yang B, Wang G, et al. Support vector machine based diagnostic system for breast cancer using swarm intelligence. Journal of Medical Systems 2012;36:2505-19. https://doi.org/10.1007/s10916-011-9723-0
» https://doi.org/10.1007/s10916-011-9723-0 -
Dittrich I, Gertz M, Maassen-Francke B, et al. Combining multivariate cumulative sum control charts with principal component analysis and partial least squares model to detect sickness behaviour in dairy cattle. Computers and Electronics in Agriculture 2021;186:106209. https://doi.org/10.1016/j.compag.2021.106209
» https://doi.org/10.1016/j.compag.2021.106209 -
Dong M, Wang Y, Todo Y, et al. A novel feature selection strategy based on the harris hawks optimization algorithm for the diagnosis of cervical cancer. Electronics 2024;13(13):2554. https://doi.org/10.3390/electronics13132554
» https://doi.org/10.3390/electronics13132554 -
Gheyas IA, Smith LS. Feature subset selection in large dimensionality domains. Pattern Recognition 2010;43:5-13. https://doi.org/10.1016/j.patcog.2009.06.009
» https://doi.org/10.1016/j.patcog.2009.06.009 -
He P, Chen Z, Yu H, et al. Research progress in the early warning of chicken diseases by monitoring clinical symptoms. Applied Sciences 2022;12:5601. https://doi.org/10.3390/app12115601
» https://doi.org/10.3390/app12115601 -
Huan Liu, Lei Yu. Toward integrating feature selection algorithms for classification and clustering. IEEE Transactions on Knowledge and Data Engineering 2005;17:491-502. https://doi.org/10.1109/TKDE.2005.66
» https://doi.org/10.1109/TKDE.2005.66 -
Jiang H, Yang Y, Wan Q, et al. Feature selection based on dynamic crow search algorithm for high-dimensional data classification. Expert Systems with Applications 2024;250:123871. https://doi.org/10.1016/j.eswa.2024.123871
» https://doi.org/10.1016/j.eswa.2024.123871 -
Jolliffe IT, Cadima J. Principal component analysis: a review and recent developments. Philosophical Transactions of the Royal Society A: Mathematical, Physical and Engineering 2016;374:20150202. https://doi.org/10.1098/rsta.2015.0202
» https://doi.org/10.1098/rsta.2015.0202 -
Kamilaris A, Prenafeta-Boldú FX. Deep learning in agriculture: A survey. Computers and Electronics in Agriculture 2018;147:70-90. https://doi.org/10.1016/j.compag.2018.02.016
» https://doi.org/10.1016/j.compag.2018.02.016 -
Kaur H, Kumari V. Predictive modelling and analytics for diabetes using a machine learning approach. Applied Computing and Informatics 2020;18:90-100. https://doi.org/10.1016/j.aci.2018.12.004
» https://doi.org/10.1016/j.aci.2018.12.004 -
Kiouvrekis Y, Vasileiou NGC, Katsarou EI, et al. The use of machine learning to predict prevalence of subclinical mastitis in dairy sheep farms. Animals 2024;14:2295. https://doi.org/10.3390/ani14162295
» https://doi.org/10.3390/ani14162295 -
Magana J, Gavojdian D, Menahem Y, et al. Machine learning approaches to predict and detect early-onset of digital dermatitis in dairy cows using sensor data. Frontiers: Veterinary Science 2023;10:1295430. https://doi.org/10.3389/fvets.2023.1295430
» https://doi.org/10.3389/fvets.2023.1295430 -
Milosevic B, Ciric S, Lalic N, et al. Machine learning application in growth and health prediction of broiler chickens. World's Poultry Science Journal 2019;75:401-10. https://doi.org/10.1017/S0043933919000254
» https://doi.org/10.1017/S0043933919000254 -
Mirjalili S, Lewis A. The whale optimization algorithm. Advances in Engineering Software 2016;95:51-67. https://doi.org/10.1016/j.advengsoft.2016.01.008
» https://doi.org/10.1016/j.advengsoft.2016.01.008 -
Mirjalili S, Mirjalili SM, Lewis A. Grey wolf optimizer. Advances in Engineering Software 2014;69:46-61. https://doi.org/10.1016/j.advengsoft.2013.12.007
» https://doi.org/10.1016/j.advengsoft.2013.12.007 -
Nakrosis A, Paulauskaite-Taraseviciene A, Raudonis V, et al. Towards early poultry health prediction through non-invasive and computer vision-based dropping classification. Animals 2023;13(19):3041. https://doi.org/10.3390/ani13193041
» https://doi.org/10.3390/ani13193041 -
Ojo RO, Ajayi AO, Owolabi HA, et al. Internet of things and machine learning techniques in poultry health and welfare management: a systematic literature review. Computers and Electronics in Agriculture 2022;200:107266. https://doi.org/10.1016/j.compag.2022.107266
» https://doi.org/10.1016/j.compag.2022.107266 -
Paploski IAD, Bhojwani RK, Sanhueza JM, et al. Forecasting viral disease outbreaks at the farm-level for commercial sow farms in the U.S. Preventive Veterinary Medicine 2021;196:105449. https://doi.org/10.1016/j.prevetmed.2021.105449
» https://doi.org/10.1016/j.prevetmed.2021.105449 -
Parmar A, Katariya R, Patel V. A review on random forest: an ensemble classifier. international conference on intelligent data communication technologies and internet of things (ICICI) 2018 Chaim: Springer; 2019, p.758-63. https://doi.org/10.1007/978-3-030-03146-6_86
» https://doi.org/10.1007/978-3-030-03146-6_86 -
Sadr H, Salari A, Ashoobi MT, et al. Cardiovascular disease diagnosis: a holistic approach using the integration of machine learning and deep learning models. European Journal of Medical Research 2024;29(1):455. https://doi.org/10.1186/s40001-024-02044-7
» https://doi.org/10.1186/s40001-024-02044-7 -
Suarez F, Bruno C, Kurina Giannini F, et al. Marriage between variable selection and prediction methods to model plant disease risk. European Journal of Agronomy 2023;151:126995. https://doi.org/10.1016/j.eja.2023.126995
» https://doi.org/10.1016/j.eja.2023.126995 -
Sun Z, Zhang M, Liu J, et al. Research on white feather broiler health monitoring method based on sound detection and transfer learning. Computers and Electronics in Agriculture 2023;214:108319. https://doi.org/10.1016/j.compag.2023.108319
» https://doi.org/10.1016/j.compag.2023.108319 -
Tulpan D. 65 machine and deep learning modelling strategies for body weight prediction of cattle and swine. Journal of Animal Science 2023;101:141-2. https://doi.org/10.1093/jas/skad281.172
» https://doi.org/10.1093/jas/skad281.172 -
Vinutha MR, Chandrika J, Krishnan B, et al. EPCA-Enhanced Principal Component Analysis for medical data dimensionality reduction. SN Computer Science 2023;4:243. https://doi.org/10.1007/s42979-023-01677-5
» https://doi.org/10.1007/s42979-023-01677-5 -
Wang Haodong, Shen W, Zhang Y, et al. Diagnosis of dairy cow diseases by knowledge-driven deep learning based on the text reports of illness state. Computers and Electronics in Agriculture 2023;205:107564. https://doi.org/10.1016/j.compag.2022.107564
» https://doi.org/10.1016/j.compag.2022.107564 -
Wang Haoran, Guo T, Wang Z, et al. PreCowKetosis: a shiny web application for predicting the risk of ketosis in dairy cows using prenatal indicators. Computers and Electronics in Agriculture 2023;206:107697. https://doi.org/10.1016/j.compag.2023.107697
» https://doi.org/10.1016/j.compag.2023.107697 -
Wang J, Shen M, Liu L, et al. Recognition and classification of broiler droppings based on deep convolutional neural network. Journal of Sensors 2019;2019:3823515. https://doi.org/10.1155/2019/3823515
» https://doi.org/10.1155/2019/3823515 -
Wang L, Wang Y, Chang Q. Feature selection methods for big data bioinformatics: a survey from the search perspective. Methods 2016;111:21-31. https://doi.org/10.1016/j.ymeth.2016.08.014
» https://doi.org/10.1016/j.ymeth.2016.08.014 -
Xu H, Zhang Z, Deng K, et al. Comparison of characteristics and differences in early immune organ development in different strains of tianfu broiler. Brazilian Journal of Poultry Science 2023;25:eRBCA. https://doi.org/10.1590/1806-9061-2022-1741
» https://doi.org/10.1590/1806-9061-2022-1741 -
Xue J, Shen B. Dung beetle optimizer: a new meta-heuristic algorithm for global optimization. Journal of Supercomput 2023;79:7305-36. https://doi.org/10.1007/s11227-022-04959-6
» https://doi.org/10.1007/s11227-022-04959-6 -
Yan H, Cai S, Li E, et al. Study on the influence of PCA pre-treatment on pig face identification with random forest. Animals 2023;13:1555. https://doi.org/10.3390/ani13091555
» https://doi.org/10.3390/ani13091555 -
Yang X S. A new metaheuristic bat-inspired algorithm. nature inspired cooperative strategies for optimization (NICSO 2010). Berlin: Springer; 2010. p.65-74. https://doi.org/10.1007/978-3-642-12538-6_6
» https://doi.org/10.1007/978-3-642-12538-6_6 - Zhang X, Yang B. Animal disease intelligent card diagnosis series: smart card diagnosis and prevention of chicken diseases. Beijing: Jindun Publishing House; 2012.
-
Zhong N, Dong J, Ohsuga S. Using rough sets with heuristics for feature selection. Journal of Intelligent Information Systems 2001;16:199-214. https://doi.org/10.1023/A:1011219601502
» https://doi.org/10.1023/A:1011219601502 -
Zhuang X, Bi M, Guo J, et al. Development of an early warning algorithm to detect sick broilers. Computers and Electronics in Agriculture 2018;144:102-13. https://doi.org/10.1016/j.compag.2017.11.032
» https://doi.org/10.1016/j.compag.2017.11.032 -
Zhuang X, Zhang T. Detection of sick broilers by digital image processing and deep learning. Biosystems Engineering 2019;179:106-16. https://doi.org/10.1016/j.biosystemseng.2019.01.003
» https://doi.org/10.1016/j.biosystemseng.2019.01.003
-
FUNDING
This research was Supported by China Agriculture Research System of MOF and MARA (CARS-41), Supported by National Key R&D Program of China (2023YFD2000800).
-
DATA AVAILABILITY STATEMENT
The data that support the findings of this study are available from the corresponding author, upon reasonable request.
-
DISCLAIMER/PUBLISHER’S NOTE
The published papers’ statements, opinions, and data are those of the individual author(s) and contributor(s). The editor(s) disclaim responsibility for any injury to people or property resulting from any ideas, methods, instructions, or products referred to in the content.
The data that support the findings of this study are available from the corresponding author, upon reasonable request.