
 INFLUENCE OF ADJACENT MATRIX AND EDGE EFFECTSON NATURAL REGENERATION OF A TERRA FIRMEFOREST IN CENTRAL AMAZONIA
ABSTRACT
One of the main consequences of deforestation in the Amazon rainforest is the edge effect, which in turn alters the microclimatic conditions of the environment and impacts the remaining forests, affecting natural regeneration and the functional characteristics of plants. These changes influence the forest’s ability to recover over time. This study evaluates how the edge effect impacts regeneration in a terra firme forest in Central Amazonia, considering different adjacent matrices, such as pastures and regenerating forests. Conducted at the Experimental Farm of the Federal University of Amazonas, the study used three 100 x 100 m plots, with two near the matrices and one inside the forest. Microclimatic variables, canopy openness, and leaf traits of regenerating individuals were collected to analyze their functional characteristics, focusing on the C.S.R. ecological strategy and chlorophyll fluorescence. The results showed that microclimatic variables and light-use efficiency vary along the edge-to-center gradient, with particular emphasis on the first meters of the edge. Furthermore, the edge effect favors competitive traits in regenerating individuals but also promotes stress tolerance. Even after 47 years, the edge effects persists, although they are partially mitigated by adjacent regenerating forests, especially when compared to pasture edges, highlighting differences in community structure and eco-physiological responses of the regenerating individuals.
Keywords:
C.S.R. ecological strategy; Fluorescence; Functional traits
RESUMO
Uma das principais conseqüências do desmatamento da floresta Amazônica é o efeito de borda, que por sua vez, altera as condições microclimáticas do ambiente e impacta as florestas remanescentes, afetando a regeneração natural e as características funcionais das plantas, sendo que essas mudanças influenciam na capacidade de recuperação da floresta ao longo do tempo. Este estudo avalia como o efeito de borda impacta a regeneração em uma floresta de terra firme na Amazônia Central, considerando diferentes matrizes adjacentes, como pastagens e florestas em regeneração. Realizado na Fazenda Experimental da Universidade Federal do Amazonas, o estudo utilizou três parcelas de 100 x 100 m, sendo duas próximas às matrizes e uma no interior da floresta. Foram coletadas variáveis microclimáticas, abertura do dossel e foliares dos indivíduos regenerantes para analisar suas características funcionais, com foco na estratégia ecológica C.S.R. e na fluorescência da clorofila. Os resultados mostraram que as variáveis microclimáticas e a eficiência no uso da luz variam ao longo do gradiente borda-centro, com destaque para os primeiros metros da borda. Além disso, o efeito de borda favorece características competidoras nos indivíduos regenerantes, mas também promove a tolerância ao estresse. Mesmo após 47 anos, os efeitos de borda ainda persistem, embora sejam parcialmente mitigados por florestas em regeneração adjacente, especialmente em comparação com bordas de pastagem, evidenciando diferenças na estrutura da comunidade e nas respostas ecofisiológicas dos regenerantes.
Palavras-Chave:
Estratégia ecológica C.S.R.; Fluorescência; Atributos funcionais
1. INTRODUCTION
The Amazon, the world’s largest continuous tropical forest, spans approximately 5.3 million km2 and accounts for nearly 40% of the global tropical forest cover (Ometto et al., 2023). Although recent years have seen a decline in deforestation rates (David & Macfarlane, 2025), the environmental consequences including biodiversity loss, habitat fragmentation, and climate alteration persist. These human-induced changes give rise to the edge effect, a primary ecological impact of deforestation (Fearnside, 2005; Broadbent et al., 2008; Souza et al., 2013; Aragao et al., 2014; Carreira et al., 2023).
Globally, approximately 70% of forests are situated within 1 km of an edge, with 20% of the remaining forest area lying within 100 m (Haddad et al., 2015). In the Amazon, this condition is even more pronounced, with a 75% reduction in forest area located more than 1 km from an edge. This pattern is closely associated with the expansion of agricultural frontiers, particularly for pasture establishment, and subsequent secondary forest regeneration.
The conversion of natural landscapes alters forest structure and ecological processes up to 100 m from the edge, modifying local microclimatic conditions and influencing the functional traits of regenerating individuals. Given their high phenotypic plasticity, these individuals respond dynamically to environmental variables during development, and their traits are crucial for understanding adaptive responses to selective pressures over time (Evans & Poorter, 2001; Laurance et al., 2002; Santos, 2023).
Functional leaf traits such as leaf area (LA), specific leaf area (SLA), and leaf dry matter content (LDMC) provide critical insights into the ecological strategies of forest species. These parameters are predictive of global patterns of functional variation and are fundamental for assessing how plants acquire, utilize, and conserve essential resources such as water and and nutrients (Wright et al., 2004; Adler et al., 2014). A widely adopted conceptual framework for evaluating plant survival strategies is Grime’s C–S–R model (1977), which classifies species into Competitors (C), Stress-Tolerant (S), and Ruderals (R) (Grime & Pearce, 2012).
Chlorophyll a fluorescence analysis is a well-established approach for assessing plant photochemical performance and detecting light-induced stress. This technique enables the evaluation of physiological status by monitoring Photosystem II (PSII) activity and determining the efficiency with which absorbed photons are utilized in the photochemical phase (Dos Santos et al., 2019).
Understanding these functional traits is essential for elucidating ecosystem functioning and plant responses to environmental transformations across ecological gradients. Such traits are strongly influenced by the physical environment and microclimatic variability, which may differ according to the type of adjacent edge matrix (Evans & Poorter, 2001; Westoby & Wright, 2006; Diaz et al., 2007; De Paiva et al., 2024).
Most research on the Amazon has focused on edge effects in fragmented landscapes, often overlooking the critical influence of the surrounding matrix, whether abandoned pasture or regenerating forest. In this study, we integrate the influence of adjacent matrices and time since disturbance to examine natural regeneration processes and improve the understanding of forest resilience mechanisms.
The aim of this study was to assess how the edge effect, modulated by distinct adjacent matrices, drives microclimatic variation within a terra firme forest in Central Amazonia. We further evaluated the persistence and magnitude of these edge effects and their influence on the functional traits of regenerating species, thereby providing new insights into the resilience and ecological dynamics of tropical forests.
2. MATERIAL AND METHODS
The study was conducted at the Experimental Farm of the Federal University of Amazonas (FAEXP/UFAM). The FAEXP covers approximately 3,000 hectares and forms part of a large continuous forest block (Cruz, 2001). Relative humidity ranges between 75% during the dry season and 85% during the wet season, with moderate seasonality (INMET, 2019).
Three study areas were established: two influenced by edge effects with distinct adjacent matrice: one adjacent to pasture (PE) and another to a regenerating forest (RFE) and a control area located in the interior of a mature forest (MF), unaffected by edge influence (Figure 1).
Two 100 × 100 m plots were established perpendicular to the edge line: one in the pasture-edge matrix (PE) and one in the regenerating forest matrix (RFE). A third plot was installed within the interior of the mature forest (MF), free from edge influence and without any discernible environmental gradients. The pasture and regenerating forest plots were located 1 km and 500 m from the mature forest, respectively. Each plot was divided into ten 10 × 10 m subplots along a 100 m edge-to-interior gradient. Subplots were further subdivided into 5 × 5 m sampling units, with three subplots randomly selected per gradient, totaling 30 subplots per area.
In total, 1,185 regenerating individuals with heights ranging from 50 cm to 2 m were analyzed, as shown in Figures 1 and 2.

Location map of the Experimental Farm of the Federal University of Amazonas, the study areas, and the distribution of plots within each area
Figura 1
Mapa de localização das Fazenda experimental da Universidade Federal do Amazonas e das áreas de estudo e distribuição das parcelas dentro de cada área

Schematic of the sampling design in the three study areas and the arrangement of plots and subplots distributed randomly. The larger squares represent the subplots, and the smaller ones represent the useful collection areas in each gradient, with the colored squares indicating the locations where collections took place
Figura 2
Croqui do delineamento amostral nas três áreas de estudo e disposição das parcelas e subparcelas distribuídas aleatoriamente. Os quadrados maiores representam as subparcelas e os menores as áreas úteis de coleta em cada gradiente, sendo que os quadrados coloridos são aqueles em que ocorreram as coletas
2.1 Structural and microclimatic variables
Solar irradiance levels were measured using two sensors: a line quantum sensor (MQ-301) installed in the subplots along the gradients, and a PPFD sensor (MQS-B/ULM-500 logger) positioned in an open area to determine light transmittance (TL). Data from the line sensor were collected over nine days, three consecutive days per sampling period, during morning (07:00–09:00 h), midday (10:00–12:00 h), and afternoon (14:00–16:00 h) intervals. Measurements from the PPFD sensor were recorded every 30 seconds. Daily mean air temperature (Tair) and relative humidity (RHair) were measured using a thermo-hygrometer (HMP45AC, Vaisala) concurrently with irradiance measurements..
2.2 Leaf functional traits
Chlorophyll a fluorescence was measured in the field using a portable fluorometer (PEA, MK2-9600, Hansatech) between 08:00 and 10:00 h. Leaves were dark-adapted for 30 minutes before measurement to ensure complete oxidation of the photosystems. Subsequently, a saturating light pulse (3000 μmol m2 s-1, 650 nm por 1 performance index on an absorption basis s). was applied. From the recorded data, the (Plabs) and total performance index (PItotal) maximum quantum yield of PSII (Fv/Fm), were calculated following Strasser et al. (2010).
One or two leaves per individual were collected, depending on availability, to determine LA and calculate SLA and LDMC. Leaf area was measured using a CI-202 area meter immediately after collection. SLA and LDMC were obtained following the standardized protocol described by Perez-Harguindeguy et al. (2016).
To classify individuals into the C–S–R ecological strategies, LA, SLA, and LDMC data were analyzed using the “Stratefy” spreadsheet developed by Pierce et al. (2017). To assess the relative importance of each strategy, individuals were plotted on a ternary diagram representing the 19 possible C–S–R categories observed across the study areas.
2.3 Statistical analyses
Microclimatic and leaf trait data were tested for normality and homogeneity of variances using the Shapiro-Wilk and Levene tests, respectively, with a significance level of 0.05. When necessary, logarithmic or square-root transformations were applied.
A generalized linear model (Gamma family) with a log-link function was used to compare areas, based on Akaike’s information criterion (AIC). To assess differences along the gradients within each area, a two-way ANOVA was performed, followed by Tukey’s post hoc test for multiple comparisons.
All data were compiled in electronic spreadsheets, and statistical analyses were conducted using RStudio software.
3. RESULTS
3.1 Microclimatics variables
Significant differences (p ․ 0.001) in air temperature (Tair) were observed among the three environments, mature forest (MF), pasture edge (PE), and regenerating forest edge (RFE) (Figure 3). The highest mean Tair was recorded in PE (30.07 °C), followed by RFE (29.11 °C) and MF (28.76 °C), corresponding to increases of 4.55% and 1.21% in PE and RFE, respectively, relative to MF. However, no significant differences were detected along the edge-to-interior gradients within the same area. In PE, mean values ranged from 30.1 °C to 29.9 °C, while in RFE, they varied from 29.7 °C to 28.8 °C, the latter showing the greatest variation. Both gradients exhibited a decreasing trend in air temperature with increasing distance from the edge.
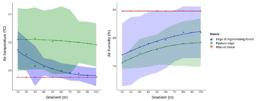
Graph of variation in average air temperature and humidity in a mature forest area without edge effect interference, compared to areas influenced by edge effect along a 100 m gradient toward the interior of a Central Amazon forest. The points represent average values of temperature and humidity, while the trend lines show behavior patterns along the gradients, shading the minimum and maximum daily range observed on collection days
Figura 3
Gráfico de variação da temperatura média do ar e umidade média do ar em uma área de floresta madura sem a interferência do efeito de borda e em áreas influenciadas pelo efeito de borda ao longo de um gradiente de 100 m para o interior de uma floresta da Amazônia Central. Os pontos representam os valores médios de temperatura e umidade, as linhas de ajustes mostram a tendência de comportamento ao longo dos gradientes sombreamento a amplitude mínima e máxima diária encontrada nos dias de coleta
Relative humidity (RH) also differed significantly among the three environments (p ․ 0.001). The highest mean RH was found in MF (84.7%), followed by RFE (79.4%) and PE (77.9%), representing reductions of 6.3% and 8% in the edge areas relative to MF. Although no significant variation was detected along the subplots within each gradient, a general increasing trend in RH toward the forest interior was evident. In PE, mean RH values ranged from 75.6% to 79.2%, and in RFE from 77% to 81% (Figure 3).
Light transmittance (TL) in MF differed significantly only from RFE (p ․ 0.001), and the two edge areas also differed significantly from each other (p ․ 0.001). Mean TL values were 4.89% for RFE, 2.19% for MF, and 2.14% for PE. In PE, the first 10 and 20 m gradients showed significantly higher TL values compared to MF.
Significant differences in TL were also observed along the edge-to-interior gradients. In RFE, the 10 m gradient differed significantly (p ․ 0.05) from the 70, 80, 90, and 100 m gradients. Similarly, in PE, the 10 m gradient differed significantly from all other distances, while the 20 and 30 m gradients differed significantly from those beyond 40 m.
From the 10 m mark onward, TL values showed a pronounced decline toward the forest interior in both edge areas (Figure 3). In RFE, TL decreased from 10.67% to 3%, whereas in PE, it dropped from 7.55% to 1% along the same gradient.
3.2 Canopy openness
Statistical analyses revealed significant differences in mean canopy openness (CO) between MF and RFE (p ․ 0.01), as well as between the two edge areas (p ․ 0.01). The mean CO values were 7.73% for RFE, 5.10% for PE, and 5.00% for MF (Figures 4 and 5).

Graph of light transmittance variation in a mature forest area without edge effect interference, compared to areas influenced by the edge effect along a 100 m gradient toward the interior of a Central Amazon forest. The points represent average TL values, the trend lines show behavior patterns along the gradients, and the shading indicates the minimum and maximum daily range observed on collection days
Figura 4
Gráfico de variação da transmitância de luz em uma área de floresta madura sem a interferência do efeito de borda e em áreas influenciadas pelo efeito de borda ao longo de um gradiente de 100 m para o interior de uma floresta da Amazônia Central. Os pontos representam os valores médios de TL, as linhas de ajustes mostram a tendência de comportamento ao longo dos gradientes e o sombreamento a amplitude mínima e máxima diária encontrada nos dias de coleta

Bar graph of average canopy openness values in a mature forest area without edge effect interference, compared to areas influenced by the edge effect along a 100 m gradient toward the interior of a Central Amazon forest
Figura 5
Gráfico de barras dos valores médios de abertura do dossel em uma área de floresta madura sem a interferência do efeito de borda e em áreas influenciadas pelo efeito de borda ao longo de um gradiente de 100 m para o interior de uma floresta da Amazônia Central
A pattern similar to that of TL was observed, with higher mean CO values near the edge in PE (10 and 20 m) showing a higher proportion compared to the MF mean. In RFE, significant differences were found only between the 10 m and the 90–100 m gradients (p ․ 0.05), while in PE, the 10 m gradient differed significantly from gradients beyond 40 m (p ․ 0.05).
Mean CO values in both edge areas showed a decreasing trend from edge to interior. In PE, values ranged from 12.33% to 3%, and in RFE, from 15.66% to 5.33% along the same gradient (Figure 4 and 5).
3.3 Chlorophyll a fluorescence parameters
Significant differences in the maximum quantum yield of PSII (Fv/Fm) were observed only between PE and MF (p ․ 0.01), whereas RFE did not differ significantly from either. The mean Fv/Fm value in MF was 0.81, while in PE, it was 0.79 at 10 m from the edge. Across the internal gradients of both edge areas, Fv/Fm values ranged from 0.81 to 0.82, showing no clear edge-to-interior pattern. In RFE, significant differences occurred between 20 m and the 50-60 m gradients, which showed higher mean values. In PE, the 10 m gradient differed significantly from all others (p ․ 0.05).
Figure 6 illustrates the variation in Fv/Fm along the edge distances, highlighting maximum and minimum values among regenerating individuals, with outliers indicating stress levels induced by edge conditions. Most individuals in RFE maintained values comparable to MF; however, some at 20 m exhibited lower means, resulting in significant differences at this distance.

Box plot graph of the maximum quantum efficiency values of the photochemical step for regenerating individuals in a mature forest area without edge effect interference and in areas influenced by the edge effect along a 100 m gradient into the interior of a Central Amazon forest
Figura 6
Gráfico de box plot dos valores de eficiência quântica máximo da etapa fotoquímica dos indivíduos regenerantes em uma área de floresta madura sem a interferência do efeito de borda e em áreas influenciadas pelo efeito de borda ao longo de um gradiente de 100 m para o interior de uma floresta da Amazônia Central
The performance index on an absorption basis (Plabs) differed significantly only between PE and MF. Mean Plabs values varied irregularly across edge gradients, without a consistent edge-to-center pattern. The mean Plabs in MF was 5.06, compared to 4.31 at 10 m in PE—14.8% lower. In RFE, the 20 m gradient averaged 3.59, 29% lower than MF. In RFE, the 20 m gradient differed significantly from the 30, 40, 50, 60, and 80 m gradients (mean reduction of 36.31%), while in PE, the 10 m gradient differed significantly from the 90 and 100 m gradients (mean reduction of 33.72%).
Regenerating individuals exhibited substantial variation in PIabs, irrespective of gradient distance. Most individuals with lower Plabs values were located near the edge, as indicated by comparison with the MF median (Figure 7).

Box plot graph of performance index values at the ABS base of the photochemical step for regenerating individuals in a mature forest area without edge effect interference and in areas influenced by the edge effect along a 100 m gradient into the interior of a Central Amazon forest
Figura 7
Gráfico de box plot dos valores de índice de desempenho na base ABS da etapa fotoquímica dos indivíduos regenerantes em uma área de floresta madura sem a 40 interferência do efeito de borda e em áreas influenciadas pelo efeito de borda ao longo de um gradiente de 100 m para o interior de uma floresta da Amazônia Central

Box plot graph of total performance index values of the photochemical step for regenerating individuals in a mature forest area without edge effect interference and in areas influenced by the edge effect along a 100 m gradient into the interior of a Central Amazon forest
Figura 8
Gráfico de box plot dos valores de índice de desempenho total da etapa fotoquímica dos indivíduos regenerantes em uma área de floresta madura sem a interferência do efeito de borda e em áreas influenciadas pelo efeito de borda ao longo de um gradiente de 100 m para o interior de uma floresta da Amazônia Central
Total performance index (PItotal) values varied independently across gradients. Significant differences were found between PE and MF, as well as between the two edge areas (p ․ 0.05). The lowest mean PItotal (1.74) occurred at 10 m in PE, representing a 13.86% reduction compared with MF (2.02). Although MF and RFE did not differ significantly, the 20 m gradient in RFE showed a 35.14% lower mean (1.31) relative to MF.
Overall, PItotal displayed high variability among regenerating individuals along the edge gradients. The lowest values were consistently found near the edges, with gradual increases toward the forest interior. In RFE, significant differences occurred between the 20 m gradient and the 30, 40, and 60 m gradients (p ․ 0.05), representing an average reduction of 44.06%. In PE, significant differences were found between 10 m and the 90-100 m gradients (mean reduction of 31.87%).
3.4 C–S–R ecological strategies (Competitor, Stress-Tolerant, and Ruderal)
Analysis of the community’s ecological strategies revealed that 44.60% of individuals were Stress-Tolerant (S), 39.05% Competitor (C), and 16.34% Ruderal (R) (Figure 9a). Most individuals were classified as CS/CSR (30.67%) or CS (16.67%). Although this represents the overall community distribution, the dominance of particular strategies varied along the environmental gradients.

(a) Global CSR ternary plots with all individuals found in the study areas (n = 708 individuals), (b) with individuals from mature forest (n = 304 individuals), (c) with individuals from forest with regenerating forest edge matrix (n = 109 individuals), and (d) with individuals from forest with pasture edge (n = 292 individuals)
Figura 9
(a) Gráficos ternários CSR global com todos os indivíduos encontrados nas áreas de estudo (n = 708 indivíduos), (b) com os indivíduos da floresta madura (n = 30 43 indivíduos), (c) com os indivíduos da floresta com matriz de borda de floresta em regeneração (n = 109 indivíduos) (c) e com os indivíduos da floresta com borda de pastagem (n = 292 indivíduos)
In MF, vegetation was predominantly Stress-Tolerant (C:S:R = 29.86:52.12:18.02) (Figure 9b), with intermediate strategies such as CS/CSR, CS, S/CSR, S/SC, and S/SR being common. In RFE, individuals showed a stronger tendency toward the Competitor strategy, though many were still StressTolerant, with few Ruderal types (47.75:36.44:15.80) (Figure 9c). Most regenerants were categorized as CS/CSR, CS, C/CSR, or C/CR.
The pattern observed in PE was similar to that in RFE, with individuals predominantly adopting Competitor strategies, also influenced by Stress-Tolerant traits and minimal Ruderal presence (45.41:39.85:14.75). Most regenerants in PE were classified into intermediate categories such as CS/CSR, CS, C/CSR, and C/CS (Figure 9d).
Across edge gradients, ecological strategies displayed varying dominance patterns compared with MF. In RFE, Competitor-type individuals were more frequent near the edge, while Stress-Tolerant individuals increased toward the interior, reflecting a shift in community strategies along the gradient (Figure 10a).

Bar chart indicating the proportion of regenerating individuals found in each gradient of the RFE (a) and PE (b) areas, specifying the average dominance degree of the observed strategy through colors that represent RGB allocation in the participation space of the C, S, and R categories. Bar chart (c) also represents the proportion of regenerating individuals found in the MF, but in each sampling point, specifying the average dominance degree of the observed strategy through colors that represent RGB allocation in the participation space of the C, S, and R categories
Figura 10
Gráfico de barras indicando a proporção de indivíduos regenerantes encontrados em cada gradiente das áreas de RFE (a) e PE (b) especificando o grau de dominância média da estratégia observada através das cores que representam a alocação RGB no espaço de participação das categorias C, S, R. Gráfico de barras (c) também representando a proporção de indivíduos regenerantes encontrados na MF, mas em cada ponto de coleta, especificando o grau de dominância média da estratégia observada através das cores que representam a alocação RGB no espaço de participação das categorias C, S, R
In the PE, a greater homogeneity of C strategies is observed along the edge-to-center gradient. However, there is a higher proportion of individuals with S strategies across the gradients compared to the RFE, although still lower than the C strategy. In this environment, there is a noticeable trend of increasing proportions of individuals oriented toward S in the inner gradients compared to those near the edge (Figure 10b).
Although there is an overall stronger strategic tendency toward C, the individuals in the edge areas were shaped by the variation in the relative importance of each strategy. These areas showed a more homogeneous distribution of the dominance of the intermediate CS/CSR and CS strategies along the edge-to-center gradient. The MF showed a dominance of the S/CS, S/CSR, and S/SR strategies among the regenerating individuals (Figure 10c).
4. DISCUSSION
Our results demonstrate that even after several decades of edge formation, microclimatic modifications in air temperature (Tair) e and relative humidity (RHair) persist in areas affected by edge influence, as evidenced by differences among the studied environments. Tair e RHair exhibited an inverse relationship along the edge-to-interior gradient, consistent with patterns reported for tropical forests under edge effects, (Tomimatsu & Ohara, 2004; Ewers & Leite, 2013, Graham et al., 2021), with temperature decreasing and humidity increasing toward the forest interior.
The absence of statistically significant variation along the gradients suggests a potential attenuation of edge effects 47 years after edge establishment. This attenuation may be related to the structural evolution of the forest edge over time, which contributes to microclimatic stabilization within the forest interior.
The role of the adjacent matrix appears to be critical in mitigating these effects, as indicated by the intermediate microclimatic conditions observed in RFE (Border with Forest Regeneration). Although this edge is more recent, its surrounding regenerating forest likely buffers the penetration of abiotic effects into the interior. A forested adjacent matrix can reduce the intensity of microclimatic alterations when compared with pasture edges (Laurance et al., 2018).
Over time, edge-induced microclimatic gradients tend to stabilize because such changes are strongest in structurally open edges, particularly within the first five years following disturbance (D’Angelo et al., 2004; Laurance et al., 2018). This process may explain the limited temperature variation observed along the PE (Border with Pasture) gradient.
The PE edge, established 47 years ago, supports a vegetation structure dominated by mature pioneer species capable of partially regulating internal microclimatic conditions. Nevertheless, despite this buffering, the PE area still experiences more pronounced environmental variation than RFE, and both differ significantly from MF (Mature Forest).
In RFE, greater temperature variability was observed along the gradient; however, Tair decreased toward the interior, converging with MF in the final meters, whereas PE maintained higher temperatures throughout. Although regenerating forest matrices can act as wind barriers, this may lead to localized heat accumulation near the edge, explaining the sharper microclimatic transitions observed in RFE (Wright et al., 2010; Muscolo et al., 2014; Sun et al., 2025).
These results are consistent with previous research conducted in northern Amazonian forest fragments influenced by distinct matrices, which reported higher edge temperatures (27.29–27.18 °C at 10 m in PE) and minimal variation toward the interior, as well as elevated RHair in forest-edge matrices (Meza-Elizalde & Armenteras-Pascual, 2021).
The patterns of light transmittance TL and and canopy openness (CO) observed in this study were strongly correlated, both showing elevated values near the edge and declining toward the interior. In PE, TL and CO approached MF levels in inner gradients, suggesting that subcanopy vegetation densification over time has contributed to reduced light penetration via natural regeneration of pioneer species (Almeida et al., 2019).
RFE exhibited higher mean TL and CO values, likely reflecting the early-stage edge effects of a younger matrix (<20 years) undergoing more recent successional processes. The adjacent regenerating forest may function as a partial buffer, reducing incident light in the interior by up to 35% (Do Nascimento et al., 2010). However, variation in canopy height among native species (Wieland et al., 2011) may limit this buffering capacity in the first meters of the gradient, contrasting with PE, where a more established structure reduces light infiltration. The higher canopy openness in RFE may also be linked to early tree mortality along forest edges (Nascimento & Laurance, 2006).
In matrices composed of native Amazonian tree species with varying ages and growth patterns (Wieland et al., 2011), the height heterogeneity of species may not be sufficient to prevent the intense penetration of light in the first meters of the gradient. This contrasts with secondary forests, which favor the rapid growth of pioneer species with distinct regeneration processes. The greater canopy openness in highly fragmented forests may also be linked to the elevated tree mortality along edges during the first years (Nascimento & Laurance, 2006).
The influence of adjacent matrices, such as pasturelands and regenerating forests, has been documented in Central Amazonia, where it was concluded that the type of regenerating forest can modify the capacity to buffer edge effects toward the interior, given the diversity of tree growth strategies and architectural traits (Mesquita et al., 1999). Our observations indicate that microclimatic variations driven by edge effects are shaped both by the type of adjacent matrix and by temporal factors, considering the ages of the edges studied. This is because it is still possible to detect certain microclimatic alterations in edge environments over time.
Fluorescence parameters revealed that photochemical alterations were most pronounced at 10 m in PE, explaining the significant differences relative to MF. Fv/Fm values ranged from 0.69 to 0.82 in this gradient, indicating elevated stress levels among many individuals and suggesting persistent sensitivity to high irradiance. In contrast, inner gradients exhibited values similar to MF, reflecting acclimation to subcanopy conditions.
The photochemical performance of PE individuals may be attributed to secondary vegetation development, favoring shade-tolerant species adapted to understory conditions (Laurance et al., 2002). However, the pasture matrix intensifies microclimatic extremes, exposing regenerants near the edge to higher irradiance and temperature, resulting in reduced light-use efficiency in sensitive species.
In contrast, individuals in RFE demonstrated greater physiological acclimation to high light, as reflected by more stable fluorescence parameters. The 10 m gradient in RFE showed no significant differences compared to MF, suggesting the dominance of species adapted to this environment, mainly pioneer and early secondary species with efficient photosynthetic apparatuses (Carter et al., 2020).
Some individuals at 20 m in RFE displayed reduced photochemical efficiency, likely representing more shade-adapted successional groups less tolerant of high irradiance. These results indicate a gradient-driven filtering process in which shade-tolerant species are gradually replaced by light-tolerant ones closer to the edge.
Overall, individuals located at 10 m exhibited lower Plabs and PItotal values than those in MF. However, along the gradient, these indices improved toward the interior, suggesting a progressive recovery in photochemical performance. Variability at 20 m reflected both acclimated and stressed individuals, indicating that environmental filtering remains active even decades after edge formation.
Along the 20m gradient, some individuals exhibited the lowest photochemical performance, while others showed values comparable to those in the mature forest. This suggests that, although an environmental filter favors the colonization of species acclimated to microclimatic modifications at forest edges, shade-tolerant individuals that persist in these areas over time may still be affected by light and microclimatic stress, even after 20 years. Nevertheless, a slight improvement in indicators of light stress can be observed over the long term, facilitating the establishment of more shade-tolerant species, potentially influenced by the type of adjacent matrix.
PItotal the most sensitive fluorescence parameter (Strasser et al., 2010), revealed that individuals near the edge remain more susceptible to light stress, which compromises overall performance. These results are consistent with observed differences in PItotal between PE and MF, particularly at 10 m.
Photochemical efficiency offers insight into damage caused by excessive irradiance in the photosynthetic apparatus (Rodrigues & Gonçalves, 2014; Dos Santos et al., 2020). In dense terra firme forests, shade-adapted species possess structural and biochemical mechanisms that enhance light interception and optimize energy use in the early stages of electron transport (Dos Santos et al., 2019).
Along the edge-to-interior gradient, excessive light becomes less limiting, allowing plants to use available light more efficiently. The asymmetric pattern of photochemical efficiency observed here suggests that responses depend more on species-specific traits than on edge proximity, particularly since these are mature edges with established vegetation adapted to understory conditions.
Ecophysiological studies have shown that under variable light intensities, interspecific variation in leaf traits exceeds intraspecific variation. This indicates that even within the same habitat, species exhibit distinct adaptive mechanisms (Kitajima, 1996; Valladares & Niinemets, 2008; Fajardo & Siefert, 2016; Yang et al., 2023). Although individuals from the same site may share similar leaf traits, their developmental strategies can differ substantially, reinforcing the importance of analyzing responses along environmental gradients (Santiago & Wright, 2007).
Given that the study sites form part of a continuous forest, the intensity of edge effects must be considered when interpreting trait variation. Despite the modest magnitude of physiological differences, our results indicate that edge influence continues to affect light-use efficiency, especially in PE.
The global C–S–R ternary diagram revealed a wide diversity of functional strategies among regenerating individuals. This diversity reflects the high species richness of Amazonian forests, where coexistence within a shared habitat promotes heterogeneous adaptive strategies driven by environmental filtering (Tameirão et al., 2021).
Tropical rainforests typically exhibit intermediate ecological strategies centered around CS/CSR combinations (Pierce et al., 2017), a pattern consistent with our findings. Most individuals clustered in the central-left region of the ternary plot, indicating the prevalence of these intermediate strategies along the edge gradients. These results confirm the applicability of the C–S–R framework in Amazonian systems and suggest that the observed differences reflect local ecological dynamics.
Low-productivity environments often favor conservative, Stress-Tolerant strategies. In tropical forests, microclimatic variability influences resource availability, favoring individuals adapted to shaded conditions, particularly in the understory where light is a limiting factor for productivity and growth (Chapin, 1993; Grime & Pierce, 2012; Tameirão et al., 2021). This explains the dominance of Stress-Tolerant strategies in MF.
Environmental factors often act as ecological filters that shape functional trait distributions and, consequently, ecological strategies (Negreiros et al., 2014, 2016). Canopy openness can also serve as such a filter, favoring Competitive species as succession progresses toward a closed canopy (Pierce et al., 2017; Zhou et al., 2023).
Esse comportamento reflete as estratégias observadas nas bordas, onde, nos gradientes iniciais, predominam indivíduos mais competidores, adaptados a maior intensidade de luz. Na área de PE, foram encontrados indivíduos com características S nos gradientes internos, possivelmente devido à menor abertura do dossel e transmitância de luz, mais próximas às condições da MF.
This pattern was evident at the edges, where Competitive individuals dominated the outer gradients, while Stress-Tolerant species became more abundant toward the interior. In PE, the inner gradients exhibited a greater proportion of Stress-Tolerant individuals, likely due to lower light transmittance and canopy openness—conditions similar to MF.
Edge-induced environmental variation may therefore shift the functional composition of regenerating communities toward Competitive traits. The prevalence of Competitive strategies at the edges aligns with findings from Christmann et al. (2021), who observed increased competitiveness in tree islands of the Atlantic Forest due to resource competition and facilitative processes promoting acquisitive traits under environmental stress.
Although individuals exhibiting similar C–S–R strategies showed variability in fluorescence responses, this suggests that physiological performance may be decoupled from C–S–R classification. The lack of species-level identification in this study limits mechanistic interpretation, but the results offer an initial perspective on how community-level ecological strategies function in Amazonian systems under longterm edge influence.
C–S–R strategies can provide valuable insight into successional stages, as intermediate strategies often indicate mid-successional dynamics characterized by increasing diversity and competition (Chai et al., 2016).
The predominance of CS, CS/CSR, C/CSR, and C/CR strategies at the edges indicates adaptation to disturbance, competition, and stress during early successional phases. The occurrence of Stress-Tolerant individuals in PE suggests a more advanced successional stage than in RFE.
Disturbed areas frequently display a wide spectrum of C–S–R strategies among plants, reflecting ongoing ecological succession and environmental filtering, which promote the transition from Competitive to more conservative strategies over time (Grime, 1977, 2006; Caccianiga et al., 2006). Although Ruderal characteristics are often expected near edges, their low prevalence here likely reflects the advanced age of these edges. In humid tropical ecosystems, high precipitation and evapotranspiration favor C:S-type species (Pierce et al., 2017). Ruderal species may have been more common during the early stages of edge formation but were later replaced by longer-lived functional types.
Finally, the intensity of disturbance determines the strength of edge effects and the extent of structural and compositional changes in forest interiors (Carreno-Rocabado et al., 2012). Even decades after disturbance, our findings indicate that edge influence continues to shape microclimatic conditions, functional traits, and community strategies in Central Amazonian forests.
5. CONCLUSION
Long-term edge effects continue to alter microclimatic variables for more than four decades, with the magnitude of these changes depending on the adjacent matrix. There is a clear tendency for these variables to vary along the edge-to-interior gradient, with the effect being amplified by greater canopy openness. Regenerating individuals exhibited variable ecophysiological responses in light-use efficiency, with higher irradiance and canopy openness near the edge indicating persistent stress in some species, even after decades of edge formation.
Edge effects, modulated by adjacent matrices, drive the functional composition of the regenerating community toward more Competitive ecological strategies, whereas Stress-Tolerant strategies dominate within the mature forest interior.
Although our results demonstrate the persistence of edge influence over time, further research is needed to assess the role of climatic seasonality in shaping the ecophysiological responses of regenerating individuals. Such investigations would capture the full range of environmental selective pressures and phenotypic plasticity, providing a more comprehensive understanding of how seasonal variability and adjacent matrix composition interact to regulate the resilience and successional dynamics of regenerating tropical forest communities.
6. ACKNOWLEDGEMENTS
We would like to thank the Silviculture Laboratory and the Experimental Farm of the Federal University of Amazonas for their essential support and collaboration in the development and completion of this article.
DATA AVAILABILITY
The entire dataset supporting the findings of this study has been published within the article.
7. REFERENCES
-
Adler, P. B., Salguero-Gómez, R., Compagnoni, A., Hsu, J. S., Ray-Mukherjee, J., Mbeau-Ache, C., & Franco, M. (2014). Functional traits explain variation in plant life history strategies. Proceedings of the National Academy of Sciences, 111(2), 740–745. https://doi.org/l0.1073/pnas.1315179111
» https://doi.org/l0.1073/pnas.1315179111 -
Almeida, D. R. A., Stark, S. C., Schietti, J., Camargo, J. L. C., Amazonas, N. T., Gorgens, E. B., Rosa, D. M., Smith, M. N., Valbuena, R., Saleska, S., Andrade, A., Mesquita, R., Laurance, S. G., Laurance, W. F., Lovejoy, T. E., Broadbent, E. N., Shimabukuro, Y E., Parker, G. G., Lefsky, M., ..., Brancalion, P. H. S.. (2019). Persistent effects of fragmentation on tropical rainforest canopy structure after 20 yr of isolation. Ecological Applications, 29(6), e01952. https://doi.org/10.1002/eap.1952
» https://doi.org/10.1002/eap.1952 -
Aragao, L. E. O. C., Malhi, Y., Roman-Cuesta, R. M., Saatchi, S., Anderson, L. O., & Shimabukuro, Y E. (2014). Environmental change and the carbon balance of Amazonian forests. Biological Reviews, 89(4), 913–931. https://doi.org/10.1111/brv. 12088
» https://doi.org/10.1111/brv.12088 -
Broadbent, E. N., Asner, G. P., Keller, M., Knapp, D. E., Oliveira, P. J. C., & Silva, J. N. M. (2008). Forest fragmentation and edge effects from deforestation and selective logging in the Brazilian Amazon. Biological Conservation, 141(7), 1745–1757. https://doi.org/10.1016/j.biocon.2008.04. 024
» https://doi.org/10.1016/j.biocon.2008.04. 024 -
Caccianiga, M., Luzzaro, A., Pierce, S., Ceriani, R. M., & Cerabolini, B. (2006). The functional basis of a primary succession resolved by CSR classification. Oikos, 112(1), 10–20. https://doi.org/10.1111/j.0030-1299.2006.14107.x
» https://doi.org/10.1111/j.0030-1299.2006.14107.x -
Carreira, B. M., Teixeira, P. C., Andrade, R., & Santos, M. (2023). Effects of deforestation and forest degradation on ecosystem service indicators across the Southwestern Amazon. Ecological Indicators, 147, 109996. https://doi.org/10.1016/j.ecolind.2023. 109996
» https://doi.org/10.1016/j.ecolind.2023. 109996 - Carreño-Rocabado, G., Peña-Claros, M., Bongers, F., Alarcón, A., Licona, J. C., & Poorter, L. (2012). Effects of disturbance intensity on species and functional diversity in a tropical forest. Journal of Ecology, 100(6), 1453–1463.
- Carter, K. R., Wood, T. E., Reed, S. C., Schwartz, E. C., Reinsel, M. B., Yang, X., & Cavaleri, M. A. (2020). Photosynthetic and respiratory acclimation of understory shrubs in response to in situ experimental warming of a wet tropical forest. Frontiers in Forests and Global Change, 3, 576320.
-
Chai, Y, Yue, M., Liu, X., Wan, P., Wang, Q., Ren, H., & Guo, K. (2016). Plant functional traits suggest a change in novel ecological strategies for dominant species in the stages of forest succession. Oecologia, 180(3), 771–783. https://doi.org/10.1007/s00442-015-3506-3
» https://doi.org/10.1007/s00442-015-3506-3 -
Chapin, F. S., III, Autumn, K., & Pugnaire, F. (1993). Evolution of suites of traits in response to environmental stress. The American Naturalist, 142(Suppl. S78), S78–S92. https://doi.org/10.1086/285524
» https://doi.org/10.1086/285524 -
Christmann, T., Hinkelmann, R., Brauning, A., & Hietz, P. (2021). Functional assembly of tropical montane tree islands in the Atlantic Forest is shaped by stress tolerance, bamboo presence, and facilitation. Ecology and Evolution, 11(15), 1016410177. https://doi.org/10.1002/ece3.7836
» https://doi.org/10.1002/ece3.7836 - Cruz, J. (2001). Caracterização morfológica, fenológica e produtividade de Oenocarpus bacaba Martius (Palmae) em floresta de terra firme e pastagens na Amazônia Central (Tese de doutorado). Instituto Nacional de Pesquisas da Amazônia/Universidade Federal do Amazonas, Manaus, AM, Brasil.
-
D’Angelo, S. A., Andrade, A. C. S., Laurance, S. G., & Laurance, W. F. (2004). Inferred causes of tree mortality in fragmented and intact Amazonian forests. Journal of Tropical Ecology, 20(2), 243–246. https://doi.org/10.1017/S0266467403 001197
» https://doi.org/10.1017/S0266467403 001197 -
David, H. C., & Macfarlane, D. W. (2025). Controls on deforestation in the Brazilian Amazon: Explaining past success actions, new challenges and recommendations. Acta Amazonica, 55, e55es24213. https://doi.org/10.1590/1809-4392202402132
» https://doi.org/10.1590/1809-4392202402132 - de Paiva Farias, R., Mehltreter, K., Silva, M. P. P., Goetz, M. N. B., da Silva, V. L., Schmitt, J. L., & da Costa, L. E. N. (2024). Role of above-and belowground traits in the functional structure and species dominance of tropical fern communities in response to edge effects. Folia Geobotanica, 58(3), 275–291.
-
Díaz, S., Lavorel, S., de Bello, F., Quétier, F., Grigulis, K., & Robson, M. (2007). Incorporating plant functional diversity effects in ecosystem service assessments. Proceedings of the National Academy of Sciences, 104(52), 20684–20689. https://doi.org/10.1073/pnas.0704716104
» https://doi.org/10.1073/pnas.0704716104 - Do Nascimento, M. I., Machado, R. B., & Lopes, A. V. (2010). The effectiveness of Eucalyptus barrier in containing the edge effect on a subtropical forest fragment in the state of São Paulo, Brazil. Scientia Forestalis, 38(86), 191–203.
-
Dos Santos, V. A. H. F., & Ferreira, M. J. (2020). Are photosynthetic leaf traits related to the first-year growth of tropical tree seedlings? A light-induced plasticity test in a secondary forest enrichment planting. Forest Ecology and Management, 460, 117900. https://doi.org/10.1016/j.foreco.2020.117900
» https://doi.org/10.1016/j.foreco.2020.117900 - Dos Santos, V. A. H. F., Nelson, B. W., Rodrigues, J. V F. C., Garcia, M. N., Ceron, J. V. B., & Ferreira, M. J. (2019). Fluorescence parameters among leaf photosynthesis-related traits are the best proxies for CO2 assimilation in Central Amazon trees. Brazilian Journal of Botany, 42(2), 239–247.
-
Evans, J. R., & Poorter, H. (2001). Photosynthetic acclimation of plants to growth irradiance: The relative importance of specific leaf area and nitrogen partitioning in maximizing carbon gain. Plant, Cell & Environment, 24(8), 755–767. https://doi.org/10.1046/j.1365-3040.2001.00724.x
» https://doi.org/10.1046/j.1365-3040.2001.00724.x -
Ewers, R. M., & Banks-Leite, C. (2013). Fragmentation impairs the microclimate buffering effect of tropical forests. PLOS ONE, 5(3), e58093. https://doi.org/10.1371/journal.pone.0058093
» https://doi.org/10.1371/journal.pone.0058093 -
Fajardo, A., & Siefert, A. (2016). Phenological variation of leaf functional traits within species. Oecologia, 180(4), 951–959. https://doi.org/10.1007/s00442-015-3511-6
» https://doi.org/10.1007/s00442-015-3511-6 -
Fearnside, P. M. (2005). Deforestation in Brazilian Amazonia: History, rates, and consequences. Conservation Biology, 19(3), 680-688. https://doi.org/10.1111/j.1523-1739.2005.00697.x
» https://doi.org/10.1111/j.1523-1739.2005.00697.x - Graham, E. A., Hansen, M., Kaiser, W. J., Lam, Y., Yuen, E., & Rundel, P. W. (2021). Dynamic microclimate boundaries across a sharp tropical rainforest-clearing edge. Remote Sensing, 13(9), 1646.
- Grime, J. P. & Pierce, S. (2012). The evolutionary strategies that shape ecosystems. John Wiley & Sons.
- Grime, J. P. (1977). Evidence for the existence of three primary strategies in plants and its relevance to ecological and evolutionary theory. The American Naturalist, 111(982), 1169–1194.
- Grime, J. P. (2006). Plant strategies, vegetation processes, and ecosystem properties John Wiley & Sons.
- Haddad, N. M., Brudvig, L. A., Clobert, J., Davies, K. F., Gonzalez, A., Holt, R. D., Lovejoy, T. E., Sexton, J. O., Austin, M. P., Collins, C. D., Cook, W. M., Damschen, E. I., Ewers, R. M., Foster, B. L., Jenkins, C. N., King, A. J., Laurance, W. F., Levey, D. J., Margules, C. R., ..., Townshend, J. R. (2015). Habitat fragmentation and its lasting impact on Earth’s ecosystems. Science advances, 1(2), e1500052.
-
Instituto Nacional de Meteorologia [INMET]. (2019). BDMEP - Banco de Dados Meteorológicos para Ensino e Pesquisa. http://www.inmet.gov.br/portal/index.php?r1/4bdmep/bdmep
» http://www.inmet.gov.br/portal/index.php?r1/4bdmep/bdmep - Kitajima, K. (1996). Ecophysiology of tropical tree seedlings. In Tropical forest plant ecophysiology (pp. 559-596). Springer.
- Laurance, W. F., Camargo, J. L., Luizão, R. C., Laurance, S. G., Pimm, S. L., Bruna, E. M., Stouffer, P. C., & Vasconcelos, H. L. (2018). An Amazonian rainforest and its fragments as a laboratory of global change. Biological Reviews, 93(1), 223-247.
- Laurance, W. F., Lovejoy, T. E., Vasconcelos, H. L., Bruna, E. M., Didham, R. K., Stouffer, P. C., Gascon, C., & Bierregaard, R. O. (2002). Ecosystem decay of Amazonian forest fragments: A 22-year investigation. Conservation Biology, 16(3), 605–618.
- Mesquita, R. C. G., Delamônica, P., & Laurance, W. F. (1999). Effect of surrounding vegetation on edge-related tree mortality in Amazonian forest fragments. Biological Conservation, 91(2-3), 129–134.
- Meza-Elizalde, M. C., & Armenteras-Pascual, D. (2021). Edge influence on the microclimate and vegetation of fragments of a north Amazonian forest. Forest Ecology and Management, 498, 119546.
- Muscolo, A., Bagnoli, G., Sidari, M., & Mercurio, R. (2014). A review of the roles of forest canopy gaps. Journal of Forestry Research, 25(4), 725–736.
- Nascimento, H. E. M., & Laurance, W. F. (2006). Efeitos de área e de borda sobre a estrutura florestal em fragmentos de floresta de terra-firme após 13-17 anos de isolamento. Acta Amazonica, 36, 183–192.
- Negreiros, D., Fernandes, G. W., & Morellato, L. P. C. (2016). Growth-survival trade-off in shrub saplings from Neotropical mountain grasslands. South African Journal of Botany, 106, 17–22.
- Negreiros, D., Silva, L. C., Fernandes, G. W., & Morellato, L. P. C. (2014). CSR analysis of plant functional types in highly diverse tropical grasslands of harsh environments. Plant Ecology, 215(4), 379–388.
-
Ometto, J. P., Gorgens, E. B., Pereira, F. R. de S., Sato, L., Assis, M. L. R. de, Cantinho, R., Longo, M., Jacon, A. D., & Keller, M. (2023). A biomass map of the Brazilian Amazon from multisource remote sensing. Scientific Data, 10, 668. https://doi.org/10.1038/s41597-023-02575-4
» https://doi.org/10.1038/s41597-023-02575-4 - Pérez-Harguindeguy, N., Díaz, S., Cornelissen, J. H. C., Vendramini, F., Laliberté, E., Poorter, H., Jaureguiberry, P., & Milla, R. (2016). Corrigendum to: New handbook for standardised measurement of plant functional traits worldwide. Australian Journal of Botany, 64(8), 715–716.
- Pierce, S., Brusa, G., Sartori, M., & Cerabolini, B. E. L. (2017). A global method for calculating plant CSR ecological strategies applied across biomes worldwide. Functional Ecology, 31(2), 444–457.
- Rodrigues, J. V. F. C., & de Carvalho Gonçalves, J. F. (2014). Leaf gas exchange, photon capture and light harvest in Aldina heterophylla along a vegetation gradient in the Amazon Rainforest. American Journal of Plant Sciences, 5(10), 1477-1488.
-
Santiago, L. S., & Wright, S. J. (2007). Leaf functional traits of tropical forest plants in relation to growth form. Functional Ecology, 21(1), 19–27. https://doi.org/10.1111/j.1365-2435.2006.01230.x
» https://doi.org/10.1111/j.1365-2435.2006.01230.x -
Santos, L. S. (2023). Urban forest microclimates across temperate Europe are shaped by deep edge effects and forest structure. Agricultural and Forest Meteorology, 341, 109632. https://doi.org/10.1016/j.agrformet.2023.109632
» https://doi.org/10.1016/j.agrformet.2023.109632 -
Souza, C. M., Jr., Siqueira, J. V., Sales, M. H., Fonseca, A. V., Ribeiro, J. G., Numata, I., Cochrane, M. A., Barber, C. P., Roberts, D. A. & Barlow, J. (2013). Ten-year Landsat classification of deforestation and forest degradation in the Brazilian Amazon. Remote Sensing, 5(11), 5493–5513. https://doi.org/10.3390/rs5115493
» https://doi.org/10.3390/rs5115493 -
Strasser, R. J., Tsimilli-Michael, M., Qiang, S., & Goltsev, V. (2010). Simultaneous in vivo recording of prompt and delayed fluorescence and 820-nm reflection changes during drying and after rehydration of the resurrection plant Haberlea rhodopensis. Biochimica et Biophysica Acta (BBA)-Bioenergetics, 1797(6-7), 1313–1326. https://doi.org/10.1016Zj.bbabio.2010.04.013
» https://doi.org/10.1016Zj.bbabio.2010.04.013 - Sun, M., Li, W., Zhu, L., Guo, Z., Zhao, Z., Meng, N., Han, M., Wang, N. & Zhang, X. (2025). Degradation in edge forests caused by forest fragmentation. Carbon Research, 4(1), 38.
-
Tameirão, L. B. S., Caminha-Paiva, D., Negreiros, D., Veloso, M. D. D. M., Berbara, R. L. L., Dias, L. E., Pierce, S. & Fernandes, G. W. (2021). Role of environmental filtering and functional traits for species coexistence in a harsh tropical montane ecosystem. Biological Journal of the Linnean Society, 133(2), 546–560.. https://doi.org/10.1093/biolinnean/blab026
» https://doi.org/10.1093/biolinnean/blab026 -
Tomimatsu, H., & Ohara, M. (2004). Edge effects on recruitment of Trillium camschatcense in small forest fragments. Biological Conservation, 117(5), 509–519. https://doi.org/10.1016Zj.biocon.2003.10.019
» https://doi.org/10.1016Zj.biocon.2003.10.019 -
Valladares, F., & Niinemets, Ü. (2008). Shade tolerance, a key plant feature of complex nature and consequences. Annual Review of Ecology, Evolution, and Systematics, 39, 237–257. https://doi.org/10.1146/annurev.ecolsys.39.110707.173506
» https://doi.org/10.1146/annurev.ecolsys.39.110707.173506 - Westoby, M., & Wright, I. J. (2006). Land-plant ecology on the basis of functional traits. Trends in ecology & evolution, 21(5), 261–268.
- Wieland, L. M., Mesquita, R. C., Bobrowiec, P. E. D., Bentos, T. V., & Williamson, G. B. (2011). Seed rain and advance regeneration in secondary succession in the Brazilian Amazon. Tropical Conservation Science, 4(3), 300-316.
- Wright, I. J., Reich, P. B., Westoby, M., Ackerly, D. D., Baruch, Z., Bongers, F., ... & Villar, R. (2004). The worldwide leaf economics spectrum. nature, 428(6985), 821–827.
- Wright, T. E., Kasel, S., Tausz, M., & Bennett, L. T. (2010). Edge microclimate of temperate woodlands as affected by adjoining land use. Agricultural and Forest Meteorology, 150(7-8), 1138–1146.
- Yang, K., Chen, G., Xian, J., & Chang, H. (2023). Divergent adaptations of leaf functional traits to light intensity across common urban plant species in Lanzhou, northwestern China. Frontiers in Plant Science, 14, 1000647.
- Zhou, L., Thakur, M. P., Jia, Z., Hong, Y., Yang, W., An, S., & Zhou, X. (2023). Light effects on seedling growth in simulated forest canopy gaps vary across species from different successional stages. Frontiers in Forests and Global Change, 5, 1088291
Edited by
-
Editors:
Carlos Moreira Miquelino Eleto Torres and Bruno Leão Said Schettini.


