 SPATIO-TEMPORAL DYNAMICS OF BIOMASS AND CARBON IN THE MANGROVE VEGETATION OF SOFALA BAY BETWEEN 2003, 2013, AND 2023
ABSTRACT
Biomass and carbon stored in vegetation are important indicators of its role in reducing greenhouse gases. Thus, this study aimed to evaluate the spatiotemporal dynamics of biomass and carbon stocks in mangroves, focusing on changes occurring in 2003, 2013, and 2023. To this end, field measurements conducted in the Sofala Bay mangroves in 2013 were used to quantify biomass and carbon per sampled plot. Moreover, the correlation between biomass and carbon in each 2013 plot and the reflectance of vegetation indices (NDVI, SAVI, and EVI) as well as the reflectance of blue, green, and red bands (independent variables) derived from 2013 satellite images was subsequently analysed. Linear regression models were tested and fitted to estimate biomass and carbon using independent variables derived from satellite imagery. The best models for estimating biomass and carbon used NDVI as the independent variable, with adjusted coefficients of determination (R2adj) of 0.83 and 0.78, and standard errors of the estimate (Sxy%) of 23% and 24% for biomass and carbon, respectively. Therefore, a decrease in biomass and carbon stocks was observed from 2003 to 2013 and from 2013 to 2023, with an annual loss rate of 0.8%. In terms of biomass and carbon density per hectare, areas with high density increased between 2003 and 2023, reaching 6 t/ha and 3 t/ha for biomass and carbon, respectively. The reduction in biomass and carbon stocks is associated with the loss of mangrove cover in Sofala Bay.
Keywords:
Mangrove; Biomass; Carbo
RESUMO
A biomassa e carbono estocados pela vegetação, são importantes indicadores da ação dessa vegetação na redução dos gases de efeito estufa. O objetivo do presente estudo foi avaliar a dinâmica espaço temporal dos estoques de biomassa e carbono no manguezal com foco para as alterações ocorridas entre os anos de 2003, 2013 e 2023. Para tal, dados de medições realizadas no manguezal da baia de Sofala em 2013 foram usados para quantificar a biomassa e carbono por parcela amostral. Foi posteriormente analisada a correlação entre a biomassa e carbono em cada parcela amostral de 2013 com a reflectância dos índices de vegetação (NDVI, SAVI e EVI) bem como a reflectância das bandas do azul, verde e vermelho (como variáveis independentes) obtidos a partir de imagens satélite de 2013. Modelos de regressão linear foram testados e ajustados para estimar a biomassa e carbono através das variáveis independentes derivadas de imagens satélite. Os melhores modelos para estimativa de biomassa e carbono possuem o NDVI como variável independente e apresentam o coeficiente de determinação ajustado (R2aj) de 0.83 e 0.78, e o erro padrão da estimativa (Sxy%) de 23 e 24% para estimativa de biomassa e carbono respectivamente. Foi observado um decréscimo nos estoques de biomassa e carbono de 2003 para 2013 e de 2013 para 2023 com uma taxa de perda de 0.8% por ano. Em termos de densidade de biomassa e carbono por hectare, aumentaram entre 2003 e 2023, áreas com alta densidade, com 6 e 3 toneladas por hectare para biomassa e carbono respectivamente. A redução dos estoques de biomassa e carbono, esta relacionada com a redução da cobertura do manguezal na baia de Sofala.
Palavras-Chave:
Manguezal; Biomassa; Carbono
1. INTRODUCTION
Mangroves are coastal forests occurring at the land–sea interface along bays, estuaries, and inlets in tropical and subtropical regions worldwide. Highly tolerant to salinity, they provide critical ecological, environmental, and socioeconomic services, including climate regulation, erosion control, and flood mitigation (MITADER, 2020). By sequestering carbon dioxide and storing it in biomass, mangroves significantly contribute to reducing greenhouse gas concentrations and regulating the global carbon cycle. They are among the most carbonrich terrestrial ecosystems, capable of storing up to three times more carbon than most other vegetation types (Singh et al., 2020).
In Mozambique, as well as in other parts of the world, mangroves are threatened by human activities such as deforestation, land- use change, and urban expansion, which alter forest extent, species composition, and carbon storage. Likewise, natural factors, including temperature, solar radiation, and precipitation, also affect biomass and carbon stocks (Matusse, 2019; Chatting et al., 2022). Then, spatiotemporal variations, in these factors, influence vegetation structure and the accumulation of biomass and carbon, with changes in mangrove cover potentially compromising forest integrity and the carbon balance (Chatting et al., 2022).
Hence, this study assessed the spatial and temporal dynamics of biomass and carbon in the mangroves of Sofala Bay, Mozambique, aiming to understand how vegetation changes influence carbon stocks. Insights from this research can support ecosystem management strategies and inform projections of mangrove vegetation under future scenarios.
2. MATERIAL AND METHODS
2.1 Study area location and description
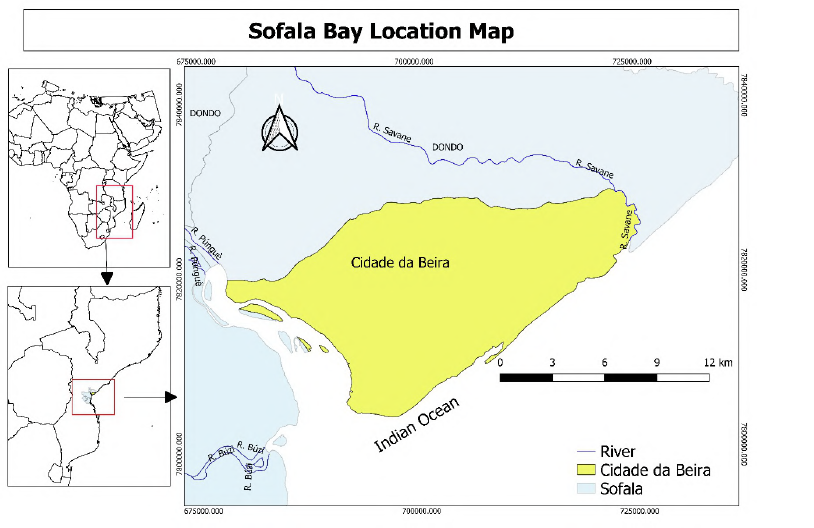
Sofala Bay is located in the central region of Mozambique, between latitudes 19°55.255'S and 19°56.047'S, and longitude 35°11.118'E. The distance from the coast to the edge of the continental shelf in this area is approximately 20m. Sofala Bay is a shallow-water system, with an average depth not exceeding 10 m (Francisco et al., 2019). According to Mandlate (2013), its boundaries are defined to the northeast by the Savane River, which also separates the Dondo District from the city of Beira and the Indian Ocean; to the south by the Buzi River; and to the northwest by the Púnguè River (Figure 1).

The climate in the region is humid tropical, with two distinct seasons, naimely: the rainy season from October to March and the dry season from April to September (Francisco et al., 2019). In terms of hydrology, the Púnguè and Buzi rivers discharge into Sofala Bay. The aquatic and transitional flora in the area are dominated by mangroves, which develop in muddy plains, creeks, and estuarine islands. Large mangrove stands are found near the Savane and Nhangau areas, with smaller patches along the southern bank of the Púnguè River (Francisco et al., 2019).
2.2 Methods
The assessment of the spatial dynamics of mangrove vegetation cover, biomass, and carbon in Sofala Bay for the years 2003, 2013, and 2023 was conducted using remote sensing tools, through the acquisition, processing, and analysis of satellite imagery, as recommended by Francisco et al., (2019). Additional information, such as forest volume obtained from the mangrove forest inventory conducted by Mandlate (2013) in Sofala Bay, was also used to allow a more accurate analysis and estimation of biomass.
2.2.1 Satellite image acquisition and classification
For this study, Landsat satellite images from the ETM and OLI (Operational Land Imager) sensors corresponding to the years 2003, 2013, and 2023 were used. The images were freely acquired from the USGS/NASA Earth Explorer platform (United States Geological Survey) via www.glovis.usgs.gov. Considering the continuous updates of satellites and their sensors over time, the most recently updated satellites available for each year were selected, resulting in images from different satellites, as presented in Table 1. The images were geometrically and radiometrically corrected.
After image correction and the conversion of digital numbers to reflectance values, satellite images were classified to identify different land cover types within the study area and to distinguish them from mangroves. A supervised classification was performed, distinguishing four classes: Mangroves, Residential/Exposed Soil Areas, Other Vegetation Formations (OVF) different from mangroves, and Other Land Uses (OLU), which included elements such as pastures, agricultural lands, and unidentified uses. This procedure was conducted separately for the images of 2003, 2013, and 2023, producing a land cover and land use map for each year.
2.2.2 Volume and biomass data
For biomass quantification, volume data collected by Mandlate (2013) were used, and sampling points were systematically allocated on a grid with 500 m × 50 m spacing across the mangrove-covered study area using the Research Tools plugin in QGIS 2.18. In the field, sampling points were located using their geographic coordinates, and at each point, a circular sample plot with a radius of 7 meters was established. Within each plot, all individuals with a diameter at breast height (DBH) ≥ 10 cm were scientifically identified, and their DBH and total height were measured.
Therefore, individual biomass was then calculated using the allometric equation adjusted by Sitoe et al., (2014) for mangroves in Sofala Bay:
The total biomass of each plot was obtained by summing the biomass of all sampled individuals within the plot. To estimate the carbon stored in the biomass, the following equation was applied, assuming that carbon accounts for 45% of the biomass composition:
Where: C= total carbon in the plot; Btp = total biomass of the plot; 0.45 = biomass-to-carbon conversion factor.
2.3 Data analysis
In this study, biomass and carbon were considered dependent variables, while the independent variables included the reflectance of the blue, green, red, and near-infrared (NIR) bands, as well as the reflectance of vegetation indices (NDVI, SAVI, and EVI). To determine which independent variables derived from remote sensing imagery best estimate biomass and carbon in the study area, a correlation matrix was produced between the observed biomass and carbon values in the sampled plots in 2013 and the reflectance values of the blue, green, red, NIR bands, NDVI, SAVI, and EVI obtained from 2013 satellite images for the corresponding plots.
The reflectance of each independent variable within the sampled plots was extracted using the geographic coordinates of each plot. Considering circular plots and using QGIS 3.14, a buffer corresponding to the plot diameter was created for each sampling point and subsequently converted to a polygon. This procedure ensured accurate reflectance extraction, particularly for plots located near the boundary between two pixels.
2.3.1 Model Fitting
A simple regression analysis was performed by fitting mathematical models to estimate the biomass and carbon of each plot based on each of the previously mentioned independent variables derived from remote sensing imagery. For the analysis involving all independent variables obtained from satellite images that best estimated the dependent variables (biomass and carbon), a multiple regression procedure was applied, resulting in fitted models in all cases. Model fitting was based on plot-level biomass and carbon data collected in the field in 2013, and on the reflectance of the corresponding independent variables extracted from 2013 satellite images.
So, using field data and satellite imagery from the same year (2013) allowed for a more accurate analysis, as the images are assumed to reflect the spectral characteristics of the field-measured targets with minimal temporal alterations in vegetation. This methodological approach, also applied by other authors such as Ramos (2020) and Chatting et al., (2022), ensures that the fitted models are reliable for estimating mangrove biomass and carbon in Sofala Bay using satellite images from other years (2003 and 2023), without the need for forest inventories in those years, thereby reducing errors associated with biomass and carbon estimation.
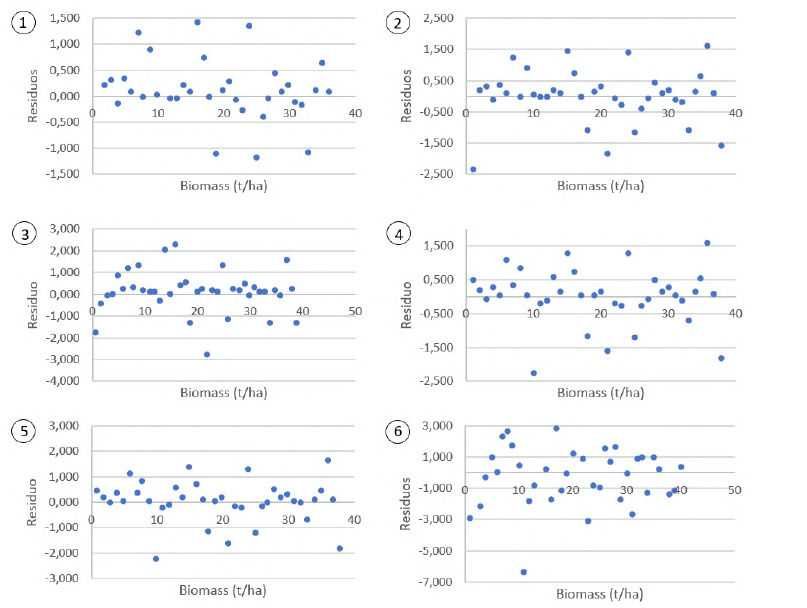
The best-fitted models were selected based on six criteria: adjusted coefficient of determination (R2adj), mean squared error (MSE), standard error (Sxy), percentage standard error of the estimate (Sxy%), Akaike Information Criterion (AIC), and graphical distribution of residuals. Graphical analysis of the residuals, calculated as the difference between observed and estimated values of the dependent variable, allowed for the detection of potential trends along the regression line. The model showing the lowest residual dispersion was selected as the best according to this criterion (Table 2).
The validation of the selected models for biomass and carbon estimation was performed only for the models that achieved the best performance according to the criteria mentioned above. Twenty-five percent of the data, which were not used in model fitting, were employed for this validation, including both independent variables derived from satellite images and dependent variables. The chi-square test was applied to compare observed and estimated biomass and carbon, as it is considered appropriate for comparing two sources of variation.
However, using the best-fitted models, biomass and carbon were estimated along with their spatial distribution in the study area for the analysis period (2003, 2013, and 2023) based on satellite imagery. The independent variables used were those identified as significant by the best-fitted models for each case. For each year, an image/map illustrating the spatial distribution of biomass and carbon.
3. RESULTS
4.1 Biomass and carbon quantification
Based on the raw field data collected by Mandlate (2013) for the reference year 2013, tree biomass in the mangrove forest ranged from 0.23 to 10.98 t/ha across the 54 sampled plots, the stored carbon, calculated as 45% of biomass, varied between 0.105 and 4.94 t/ha in the 54 plots (Table 3). The mean estimate of tree biomass in the mangrove forest of Sofala Bay for the reference year 2013 was 4.13 t/ha, with 1.859 t/ha of carbon stored in the biomass. The estimation error for biomass and carbon per unit area was 7%, and the standard deviation indicates variability in biomass and carbon stocks across the sampled plots.
3.2 Biomass and carbon modelling
3.2.1 Correlation
The correlation matrix between biomass and carbon values obtained from the 2013 field data and the independent variables derived from remote sensing imagery (blue, green, red, and near-infrared “NIR” bands, NDVI, SAVI, and EVI) from the same period was the first step in assessing the relationship between the independent and dependent variables. The correlation matrix is presented in Table 4.
Based on the Pearson correlation values, the independent variable NIR showed a positive but very weak correlation (0.002) with a p-value below 0.05. The vegetation indices NDVI, SAVI, and EVI exhibited the strongest positive correlations with the dependent variables (biomass and carbon), with correlation coefficients of 0.88, 0.88, and 0.86, respectively. The corresponding p-values were all below 0.05 (0.001, 0.001, and 0.003 for each independent variable, respectively).
3.2.2 Model fitting and selection for biomass and carbon estimation
Table 5 presents the results of the fitted regression models selected for estimating biomass in the study area (Sofala Bay). Model 1, which estimates biomass as the dependent variable using NDVI as the independent variable, exhibited the highest adjusted coefficient of determination (R2adj = 0.83) and the lowest standard error in biomass estimation (Sxy% = 23.71%). Regarding the mean squared error (MSE) and the graphical distribution of residuals, Model 1 showed a value of 3.67 and the lowest residual dispersion (Figure 2), respectively. Although the MSE of Model 1 was not the lowest compared to all other models tested, it was relatively low when compared to Models 4 and 5. Models 1, 2, and 3 displayed the lowest Akaike Information Criterion (AIC) values, combined with a smaller number of independent variables included in the models. Models 5 and 6, both using three independent variables, produced different AIC values. Overall, Model 1, which derives mangrove biomass from NDVI, demonstrated the best fitting parameters and was therefore selected as the best model.
Graphic distribution of residuals in biomass estimation models
Figura 2
Distribuição gráfica de resíduos em modelos de estimativa de biomassa
Adjusted regression models for biomass estimation
Tabela 5
Modelos de regressão ajustados para estimativa de biomassa
Similarly, for carbon estimation, the regression model using NDVI reflectance produced the highest quality of fit according to R2adj, Sxy(%), and the graphical residual distribution. In contrast, Model 6 exhibited the lowest fitting quality for four out of the five criteria applied in this study as shown in table 6 and figure 3.

Graphic distribution of residuals in carbon estimation models
Figura 3
Distribuição gráfica de resíduos em modelos de estimativa de carbono
Adjusted regression models for carbon estimation
Tabela 6
Modelos de regressão ajustados para estimativa de carbono
3.2.3 Validation of fitted models
The fitted models were considered validated using the chi-square statistical test. It was observed that the biomass and carbon estimates obtained from the fitted models, which use NDVI reflectance as the independent variable, showed no statistically significant differences from the observed biomass and carbon values derived from field measurements at a 5% significance level and the observed and estimated averages of biomass and carbon, are presented in figure 4.

Estimated and observed average of biomass and carbon
Figura 4
Média estimada e observada de biomassa e carbono
3.3 Dynamics of biomass and carbon
Mangrove biomass and carbon in Sofala Bay, estimated using the fitted models, declined between 2003 and 2023 (Tables 7 and 8). In addition, between 2003 and 2013, biomass decreased by 0.191 t/ha, corresponding to a 4.5% loss, and from 2013 to 2023, mangrove biomass reduction peaked, reaching 0.482 t/ha, equivalent to a 12% loss, and 8% increase compared to the loss observed between 2003 and 2013. The total biomass loss in the mangroves between 2003 and 2023 was 0.673 t/ha, representing a 16% decrease. On average, 0.034 t/ha/year of biomass was lost annually between 2003 and 2023, corresponding to an annual loss rate of 0.8%.
Estimated biomass for the mangrove in the Sofala bay in 2003, 2013, and 2023
Tabela 7
Biomassa estimada no manguezal da baia de Sofala nos anos de 2003, 2013 e 2023
Estimated carbon for the mangrove in the Sofala bay in 2003, 2013, and 2023
Tabela 8
Carbono estimado no manguezal da baia de Sofala nos anos de 2003, 2013 e 2023
In the same way, for carbon, a loss of 0.086 t/ha (4.5%) was observed between 2003 and 2013. From 2013 to 2023, carbon stored in mangrove biomass decreased by 0.217 t/ha (12%), representing an 8% increase compared to the loss recorded between 2003 and 2013. The total carbon loss in the mangroves between 2003 and 2023 was 0.302 t/ha, corresponding to a 16% reduction. On average, 0.015 t/ha/year of carbon was lost annually, equivalent to an annual loss rate of 0.8%.
3.3.1 Spatial distribution of biomass and carbon
In 2003, approximately 46.67% of the mangrove-covered area in Sofala Bay exhibited moderate biomass concentrations, averaging between 4 and 6 t/ha. Low biomass concentrations, with stocks below 2 t/ha, covered 7.22% of the mangrove area. Higher biomass concentrations, exceeding 6 t/ha, represented the second-largest coverage at 42.39%. Areas with 2–4 t/ha of biomass accounted for 3.72% of the mangrove area (Table 9, Figure 5).

Area occupied by different concentrations of biomass (2003)
Tabela 9
Área ocupada por diferentes concentrações de biomassa (2003)
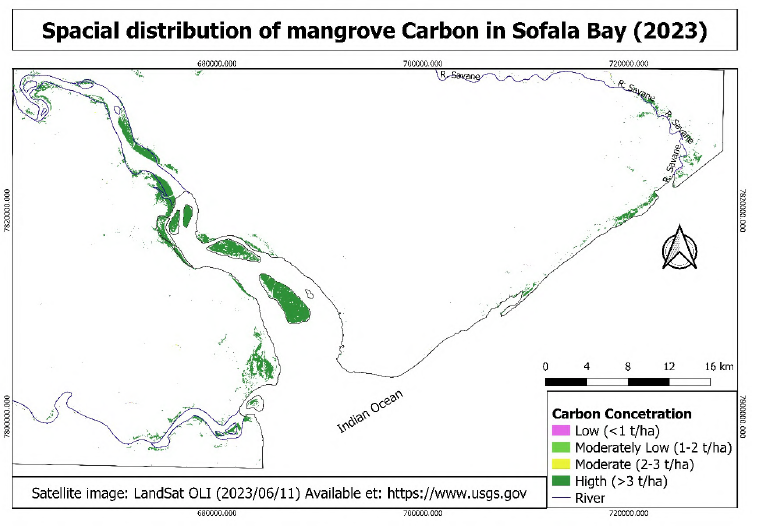
By 2023, areas with the highest biomass concentrations (>6 t/ha) accounted for 99.33% of the mangrove area, representing an increase of more than 100% over the 20-year period. Areas with biomass stocks below 6 t/ha decreased to less than 1% of the mangrove area in Sofala Bay in 2023 (Table 10, Figure 6).

Area occupied by different concentrations of biomass (2023)
Tabela 10
Área ocupada por diferentes concentrações de biomassa (2023)
Equally, for carbon, areas with moderate concentrations (2–3 t/ha) occupied the largest coverage, approximately 71.06% in 2003. Areas with higher carbon concentrations (>3 t/ha) covered a smaller proportion of the mangrove area, while moderately low concentrations were observed in 17.13% of the mangrove area (Table 11, Figure 7).
Area occupied by different concentrations of carbon (2003)
Tabela 11
Área ocupada por diferentes concentrações de carbono (2003)
By 2023, high carbon concentrations (>3 t/ha) covered 99.17% of the area, an increase of over 100% compared to 2003, likely associated with changes in biomass distribution. Areas with carbon stocks below 3 t/ha represented less than 1% of the mangrove coverage (Table 12, Figure 8).


Area occupied by different concentrations of carbon (2023)
Tabela 12
Área ocupada por diferentes concentrações de carbono (2023)
4. DISCUSSION
In the study conducted by Sitoe et al., (2014) in Sofala Bay, mean aboveground tree biomass and carbon stocks, estimated from forest inventory data, were relatively close to those observed in the present study, with reported values of 3.9 t/ha and 1.71 t/ha for biomass and carbon, respectively, indicating minimal changes in biomass and carbon structure affecting their stocks. In a similar study by Matusse (2019) in a nearby region (Zambézia), biomass and carbon stocks were estimated at 8 and 4 t/ha, respectively. Differences in sampling intensity (total sampled area), sampling design, plot size, and the use of a 0.5 conversion factor for deriving carbon from biomass may explain the discrepancies compared to the present study.
Fatoyinbo et al., (2008) examined the relationship between tree height and digital elevation models to estimate biomass in Sofala using forest inventory data from Maputo Province, reporting an average aboveground tree biomass of 8.4 t/ha and carbon of 3.7 t/ha. Differences in methodology, as well as the application of data from one region to estimate carbon stocks in another region while ignoring edaphoclimatic factors, likely account for the differences between these studies and the present results.
Mangrove biomass and carbon stocks in Sofala Bay reinforce the idea suggested by Singh et al., (2022) that, due to their high carbon sequestration capacity, mangrove ecosystems are vital for maintaining the global carbon cycle. Sofala Bay is part of marine ecoregions projected to lose carbon and biomass stocks under future climate scenarios (Singh et al., 2022).
The estimation of biomass and carbon using indirect methods, through modeling and satellite image interpretation as conducted in this study, is recommended by Ramos (2020) and Costa & Quintamilha (2024). These approaches apply allometric models to estimate biomass and carbon (dependent variables) from data obtained from satellite imagery (independent variables), which are linked to biophysical vegetation parameters. Using satellite images from the same year as the field data (2013) allowed for more precise model fitting and enabled the models to be applied to satellite images from other years (2003 and 2023) under the assumption that imagery from the same period reflects the spectral characteristics of vegetation at the time of field measurement, thereby reducing model-related estimation errors (Ramos, 2020; Costa & Quintamilha, 2024).
Regarding correlations between independent and dependent variables, the positive correlation and p-values below 0.05 between biomass and carbon and the vegetation indices (NDVI, SAVI, and EVI) indicate statistically significant relationships (Castro & Ferreira, 2022). Although few studies have estimated mangrove biomass using both satellite imagery and field data, comparisons with other vegetation types similarly show strong correlations between biomass and carbon and vegetation indices, as observed by Ramos (2020).
Model fitting and selection criteria indicated high explanatory power of the selected models for the observed data (Franca et al., 2021). Standard errors were within acceptable margins, and low mean squared errors (MSE) were satisfactory, as lower MSE values indicate better model performance. A perfect model would have an MSE equal to zero (Carmo & Silva, 2023). Statistical evaluation and cross-validation demonstrated that biomass and carbon estimation models using NDVI as the independent variable produce estimates closely aligned with observed means. Observed and estimated values did not differ significantly, supporting the hypothesis of equality (Castro & Ferreira, 2022).
Changes or reductions in mangrove biomass and carbon stocks in Sofala Bay can be linked to signs of local exploitation (Mandlate, 2013). Stocks are also influenced by vegetation use and conservation levels, which are partially affected by direct human impacts, such as mangrove removal or land-use conversion, frequently reported in Mozambique (Francisco et al., 2019; Matusse, 2019; Sitoe et al., 2014). These changes are compounded by natural factors, such as erosion, flooding, or storms, with Mozambique’s location in the tropical convergence zone increasing coastal pressures that influence mangrove cover (Leal & Spalding, 2022). Singh et al., (2022) also highlight that marine ecoregions significantly affect carbon stock variability, and consequently biomass. The marine ecoregion encompassing Sofala Bay is projected to experience losses in biomass and carbon stocks.
Other factors, including vegetation cover size, dominant species, forest conservation status, and climatic conditions (temperature, solar radiation, and rainfall), influence variability in mangrove biomass and carbon storage. The reduction of biomass and carbon concentrations in the northeastern area of Sofala Bay may be associated with vegetation loss near the Savane River, influenced by natural factors, such as sea-level rise, or abiotic factors, such as land-use and agriculture (Matusse, 2019; Chatting et al., 2022).
Considering biomass and carbon losses between 2003 and 2023, Sofala Bay’s mangroves cannot be considered a conserved forest. In intact mangroves, annual increases of 3.33 t/ha biomass and 1.5 t/ha carbon per hectare are expected (Ong, 2002). The increase in areas with high biomass and carbon stocks on small islands in Sofala Bay may be related to the inaccessibility of these muddy islands, reducing human impacts and helping preserve forest structure (Soldado et al., 2023).
The expansion of areas with high concentrations and the reduction of areas with low concentrations indicate structural changes in vegetation (Maestri et al., 2023). Such structural changes can be positive if increased biomass and carbon indicate low exploitation, or negative if reduced concentrations in lower strata disrupt succession, which normally follows a gradient from lower to higher strata (Queiroz, 2023). A normal distribution of strata reduces the likelihood of population decline, as younger individuals exist to maintain ecological and biological cycles.
5. CONCLUSION
The study of the spatiotemporal dynamics of mangrove biomass and carbon was highly valuable, allowing the determination that biomass and carbon stocks can be effectively estimated using allometric models based on the Normalized Difference Vegetation Index (NDVI). Biomass and carbon stocks in Sofala Bay decrease annually by approximately 0.8%, and the rate of biomass and carbon loss in the mangroves shows an increasing trend.
The reduction of mangrove covers in Sofala Bay leads to losses in biomass and carbon stocks and negatively affects the ecosystem’s periodic capacity to sequester carbon dioxide. The vertical structure of the mangroves has changed between 2003 and 2023. Until 2003, most of the mangrove area contained 4–6 t/ha of biomass and 2–3 t/ha of carbon. By 2023, the majority of the mangrove area contained more than 6 t/ha of biomass and more than 3 t/ha of carbon.
Biomass and carbon in Sofala Bay exhibit similar spatiotemporal distributions. The main factors influencing the loss of biomass and carbon stocks are mangrove exploitation, conversion of mangroves to other land uses, and the expansion of human settlements.
6. ACKNOWLEDGEMENTS
We extend our thanks and recognition to Development and Climate Resilience Initiative (IDERC), through its information and research department, for the institutional, technical, and financial support in carrying out this study, framed within its approach of supporting coastal ecosystem monitoring programs, a strategy for conservation, sustainable development, and response to climate change.
DATA AVAILABILITY
The entire dataset supporting the findings of this study has been published within the article.
7. REFERENCES
-
Carmo, C. R., & Silva, J. R. (2023). Métricas para análise e validação de algoritmos previsores. GeTec 12(38) https://revistas.fucamp.edu.br/index.php/getec/article/view/2895
» https://revistas.fucamp.edu.br/index.php/getec/article/view/2895 -
Castro, H. M., & Ferreira, J. C. (2022). Modelos de regressão linear e logística: quando utilizá-los e como interpretá-los; Jornal Brasileiro de Pneumologia 48(6). https://dx.doi.org/10.36416/1806-3756/e20220439
» https://dx.doi.org/10.36416/1806-3756/e20220439 -
Chatting, M., Al-Maslamani, I., Walton, M., Skov, M. W., Kennedy, H., Husrevoglu, Y. S., & Vay, L. L. (2022). Future Mangrove Carbon Storage Under Climate Change and Deforestation. Frontiers Marine Science 9(1). https://doi.org/10.3389/fmars.2022.781876
» https://doi.org/10.3389/fmars.2022.781876 -
Costa, J., & Quintamilha, J. (2024). Uso das Geotecnologias na Estimativa de Biomassa e Carbono Florestal. Revista Brasileira de Geografia Física 17(2). https://doi.org/10.26848/rbgf.v17.2.p1127-1146
» https://doi.org/10.26848/rbgf.v17.2.p1127-1146 -
Fatoyinbo, L., Shugart, H., & Simard, M. (2008). Landscape-scale extent, height, biomass, and carbon estimation of Mozambique's mangrove forests with Landsat ETM+ and Shuttle Radar Topography Mission elevation data. Journal of Geophysical Research Atmospheres, 133(1). https://doi.org/10.1029/2007JG000551
» https://doi.org/10.1029/2007JG000551 -
Franca, J. C., Melo, T., & Vargas, T. M. (2021). Modelo de regressão linear múltipla e aplicações. Revista Brasileira de Desenvolvimento, 7(7). https://doi.org/10.34117/bjdv7n7-555
» https://doi.org/10.34117/bjdv7n7-555 -
Francisco, L., Ribeiro, N., & Sitoe, A. (2019). Análise de Mudança de Cobertura do Mangal na Baía de Sofala, Moçambique. Revista Captar, 8(1). https://doi.org/10.34624/captar.v8i1.3798
» https://doi.org/10.34624/captar.v8i1.3798 -
Leal, M., & Spalding, M. (2022). The State of the World's Mangroves 2022. Global Mangrove Alliance. https://www.mangrovealliance.org/news/the-state-of-the-world-s-mangroves-2022
» https://www.mangrovealliance.org/news/the-state-of-the-world-s-mangroves-2022 -
Maestri, M., Ruschel, A., Porro, R., & Aquino, M. (2023). Alterações na estrutura florística das espécies comerciais após o manejo florestal comunitário em Anapu, Pará. Biodiversidade Brasileira 13(2). https://dx.doi.org/10.37002/biodiversidadebrasileira.v13i2.1876
» https://dx.doi.org/10.37002/biodiversidadebrasileira.v13i2.1876 - Mandlate, L. (2013). Mangal da Baia de Sofala: Caracterização Ecológica e Estimativa do Carbono sequestrado (Dissertação de Mestrado). Universidade Eduardo Mondlane.
- Matusse, A. F. (2019). Estimativa do Anidrido carbónico Sequestrado acima do solo pelas árvores do mangal de Inhangome província da Zambézia, Moçambique (Dissertação de mestrado). Universidade Eduardo Mondlane.
-
MITADER. (2020). Estratégia de gestão do mangal (2020-2024). https://sibmoz.gov.mz/content/uploads/2025/11/Resolucao-n.-33_2020-Aprova-a-Estrategia-de-Gestao-do-Mangal-2020-2024.pdf
» https://sibmoz.gov.mz/content/uploads/2025/11/Resolucao-n.-33_2020-Aprova-a-Estrategia-de-Gestao-do-Mangal-2020-2024.pdf - Ong, J. E. (2002). The hidden costs of mangrove services: Use of mangroves for shrimp aquaculture. International Science Roundtable for the Media.
- Queiroz, W. (2023). Uma Introducao a Experimentação Florestal. Amazônia: Universidade Federal Rural da Amazônia.
- Ramos, N. O. (2020). Estimativa e modelagem da biomassa florestal acima do solo a partir do uso do sensoriamento remoto: 20 anos de monitoramento da vegetação (Dissertação de mestrado). Universidade de Brasília
-
Singh, M.; Schwendenmann, L.; Wang, G.; Adame, M.F.; Mandlate, L.J.C. (2022) Changes in Mangrove Carbon Stocks and Exposure to Sea Level Rise (SLR) under Future Climate Scenarios. Sustainability, 14(7). https://doi.org/10.3390/su14073873
» https://doi.org/10.3390/su14073873 -
Sitoe, A. A., Mandlate, L. J., & Guedes, B. S. (2014). Biomass and Carbon Stocks of Sofala Bay Mangrove Forests. Forests 5(8). https://doi.org/10.3390/f5081967
» https://doi.org/10.3390/f5081967 -
Soldado, E., Nunes, G., Queiroz, L., & Costa, P. (2023). Florestas e Bem-estar humano: argumentos para conservação de ecossistemas naturais ESALQ/USP. https://www.ipef.br/publicacoes/anais/caderno-de-resumos-do-simposio-florestas-e-bem-estar-humano-2023/caderno-de-resumos-do-simposio-florestas-e-bem-estar-humano-2023.pdf
» https://www.ipef.br/publicacoes/anais/caderno-de-resumos-do-simposio-florestas-e-bem-estar-humano-2023/caderno-de-resumos-do-simposio-florestas-e-bem-estar-humano-2023.pdf
Edited by
-
Editors:
Angeline Martini and Bruno Leão Said Schettini.