 Measure corruption risk in the public hospital network: an empirical index-based approach
Abstract
Corruption, as an embedded and systemic force within health systems, is one of the most significant barriers to accessing and ensuring the quality of health services. The health sector, in all its forms and in all countries, is particularly vulnerable to abuse. Prevention becomes possible with the establishment of an institutional mechanism capable of identifying transactions with a high risk of corruption. This article introduces an innovative approach that measures the risk of corruption in a developing country’s public hospital network. The study explores the extent to which corruption risk indicators serve as effective early-warning tools for strengthening transparency and governance in public health systems. The methodology combines indicators into an index designed to assess how exposed a given public hospital is to corruption. Risk is measured across key hospital management processes: medical billing, debt management, resource allocation (expenditure), and contract management. The analysis measured corruption risk indexes for 945 Colombian public hospitals (97% of the total) during a three-year period. The proposed methodology highlights that discretionary power in contract allocation and debt management is the main driver of corruption risk. The study also found a positive correlation between hospital remoteness and exposure to corruption risk.
Keywords:
corruption risk; corruption; health management; public hospitals
Resumo
A corrupção, como uma força enraizada e sistêmica nos sistemas de saúde, é uma das barreiras mais significativas para o acesso e a garantia da qualidade dos serviços de saúde. O setor da saúde, em todas as suas formas e em todos os países, é particularmente vulnerável a abusos. A prevenção torna-se possível com o estabelecimento de um mecanismo institucional capaz de identificar transações com alto risco de corrupção. Este artigo apresenta uma abordagem inovadora para medir o risco de corrupção na rede pública hospitalar de um país em desenvolvimento. O artigo explora em que medida os indicadores de risco de corrupção podem servir como ferramentas eficazes de alerta precoce para o fortalecimento da transparência e da governança nos sistemas públicos de saúde. A metodologia propõe o uso de indicadores combinados em um índice capaz de avaliar o grau de exposição de um hospital público a práticas corruptas. Os indicadores mensuram o risco considerando processos-chave da gestão hospitalar: faturamento médico, gestão da dívida, alocação de recursos (gastos) e gestão de contratos. A análise mediu índices de risco de corrupção para 945 hospitais públicos colombianos (97% do total) ao longo de um período de três anos. A metodologia proposta destaca que o poder discricionário na alocação de contratos e na gestão da dívida são os principais determinantes do risco de corrupção. O estudo também encontrou uma correlação positiva entre o isolamento geográfico dos hospitais e a exposição ao risco de corrupção.
Palavras-chave:
risco de corrupção; corrupção; gestão em saúde; hospitais públicos
Resumen
La corrupción, como una fuerza arraigada y sistémica en los sistemas de salud, es una de las barreras más significativas para el acceso y la garantía de la calidad de los servicios de salud. El sector salud, en todas sus formas y en todos los países, es particularmente vulnerable a los abusos. La prevención se vuelve posible con el establecimiento de un mecanismo institucional capaz de identificar transacciones con alto riesgo de corrupción. Este artículo presenta un enfoque innovador para medir el riesgo de corrupción en la red pública hospitalaria de un país en desarrollo. El artículo explora en qué medida los indicadores de riesgo de corrupción pueden servir como herramientas eficaces de alerta temprana para fortalecer la transparencia y la gobernanza en los sistemas públicos de salud. La metodología propone el uso de indicadores combinados en un índice que permite evaluar el grado de exposición de un hospital público a prácticas corruptas. Los indicadores miden el riesgo considerando procesos clave de la gestión hospitalaria: facturación médica, gestión de la deuda, asignación de recursos (gasto) y gestión de contratos. El análisis midió índices de riesgo de corrupción de 945 hospitales públicos colombianos (97 % del total) durante un período de tres años. La metodología propuesta resalta que el poder discrecional en la asignación de contratos y en la gestión de la deuda son los principales factores que impulsan el riesgo de corrupción. El estudio también encontró una correlación positiva entre la lejanía geográfica de los hospitales y la exposición al riesgo de corrupción.
Palabras clave:
riesgo de corrupción; corrupción; gestión de la salud; hospitales públicos
1. INTRODUCTION
Corruption, as an embedded and systemic force in health systems, is one of the most important barriers to access and quality of health services. Also, it is one of the main drains of economic resources. Former estimations indicated that at least 10%-25% of the global healthcare spending ($7 trillion) is unethically diverted each year towards private holdings (Savedoff, 2007; Vian, 2008). Corruption, as the abuse of entrusted power for private gain, is a practice performed by public and non-public individuals in all sectors of society (Hajdu et al., 2018; Lewis, 2017; Zyglidopoulos et al., 2017). Regarded until very recently as a second-order problem, and even as a necessary practice to distribute wealth and speed the flow of money, large scale corruption findings and academic research about its causes and consequences, have led to changes in its perception (Cooley & Sharman, 2017; Manna & Palumbo, 2019; Oberoi, 2014). Thus, the topic of corruption is gaining worldwide attention, where its study and intervention not just prioritizes the agenda of governments but international institutions and research centers (Azfar et al., 2001).
Corruption is, in essence, a crime of calculation, where costs and benefits are carefully weighed (Azfar et al., 2001). However, some authors argue that, although national culture encompasses many aspects of national identity, certain elements of it may foster social acceptance of corrupt practices. Such acceptance can play a key role in minimizing the perceived costs of capture and conviction, as well as in legitimizing illicit gains (Akbar & Vujić, 2014; Pillay & Dorasamy, 2010). Levels of corruption vary not only across nations but also within them. These variations appear to be influenced by the interplay between poor institutional design and national cultural factors (United Nations Development Programme [UNDP], 2005). Corruption primarily arises from the abuse of discretionary power in environments characterized by low levels of transparency or high tolerance for illegal practices (Pillay & Dorasamy, 2010).
The health sector in all its forms, and all countries, is particularly vulnerable to abuse (Savedoff & Hussmann, 2006). The uncertainty of medical practice, the asymmetry of information and power between medical professionals and patients, and the large number of dispersed and empowered actors making decisions across the sector configure a structure prone to corrupt practices (Di Tella & Savedoff, 2001; Savedoff, 2007). García (2019), distinguishes the range of corrupt practices in the health sector according to the levels of the system management. At the strategic and tactical levels, there is grand corruption. It is characterized by corruption of high-level, and in many cases multinational. The most common practices are bribery, extortion, theft, embezzlement, nepotism, and undue influence (Savedoff, 2007; Sommer, 2020).
At the operative level, or service delivery, which directly affects the patient experience of care, García (2019) pinpoints six common practices commonly labeled as petty corruption: absenteeism, informal payments from patients, embezzlement of money, supplies, and medications, a medical provision not driven by professional medical practice, favoritism, and the manipulation of data to hide any of the practices. There is no consensus whether petty or grand corruption is more pervasive for society, nor who has more capacity for leaking health resources (Kok et al., 2015; Previtali & Cerchiello, 2018; Sommer, 2020; Stiernstedt, 2019). What is certain is that both types of corruption not just negatively affect the sustainability of the health care system but its desired outcomes (Hutchinson et al., 2019).
The literature endorses the role of prevention as a suited strategy for facing corruption in the healthcare sector (Slager, 2017). Prevention is possible when there is an institutional mechanism, able to identify transactions with a high risk of corruption (Previtali & Cerchiello, 2018). The term “risk of corruption” refers to the likelihood or probability that corrupt practices or unethical behavior could occur within a particular context, organization, or system. Identifying corruption risk comes mainly from practices in the private corporate sector where risk management and assessment are increasingly common (Previtali & Cerchiello, 2018; Puaschunder, 2020).
The measurement of corruption risks is a recurrent topic in both older and more recent literature on public procurement which is particularly vulnerable to the misuse of discretionary power (Fazekas et al., 2016; Fazekas & Kocsis, 2020; Felizzola et al., 2024; Gnaldi & Del Sarto, 2024a; Golden & Picci, 2005). The use of proxy indicators determining the risk of corruption, is becoming a suitable approach to tracking possible underlying corrupt transactions and providing guidelines to divert preventive actions (Fazekas & Tóth, 2016; Malito, 2014). Common doings that these indicators aim to identify include single bidding, repeatedly awarding contracts to the same contractors, and adding extra payments to existing contracts among several related practices (Fazekas & Kocsis, 2020). A free-access, data-driven analytical approach has been introduced as a potential deterrent against the misuse of public funds (Felizzola et al., 2024). The red flags indicators for monitoring corruption risk seem to be both the enhancer and the trend of the healthcare anticorrupt response (Mackey & Cuomo, 2020; Puaschunder, 2020; Sequeira, 2012).
Our paper explores to what extent can corruption risk indicators serve as effective early-warning tools for strengthening transparency and governance in public health systems? The purpose of this work is to provide a set of indicators designed to serve as red flags for monitoring the risk of corruption in one of the main components of the healthcare system: public hospitals. This study addresses a gap in literature, as most existing corruption risk indicators focus on sectors unrelated to healthcare delivery. This work applies existing indicators and develops new ones to uncover previously unreported mechanisms of financial diversion. Additionally, this study pioneers and validates the use of these indicators to monitor corruption risks in 945 public hospitals within a middle-income developing country over a three-year period.
2. THE COLOMBIAN PUBLIC HOSPITAL NETWORK
Since 1993, the Colombian Ministry of Health and Social Protection has organized health care under a scheme of regulated competition, in which the coexistence of two regimes determines how citizens receive health services according to their income level (Abadia & Oviedo, 2009). For those employed in the formal sector, and people with some level of high income, there is the contributive regime. For those who are unemployed or living in poverty, mainly working within the informal sector, the subsidized regime operates under the Beveridge model, in which the public sector provides most insurance and health care services and finances them through taxation (Abadía & Oviedo, 2009; Kos, 2019; Palacio Acosta, 2013). The proportion of people in the subsidized regime is close to 42% of the total population in the two regimes. In large cities, patients have private and public options of care, but in small and remote municipalities, most of the patients must rely on the public local or regional hospital. Thus, some of these health care facilities are the prey of corrupt politicians, civil servants and private suppliers which use their discretionary power to turn hospitals into vehicles of illegal enrichment compromising the capacity for providing access to a qualified and opportune health care service (Di Tella & Savedoff, 2001; Savedoff & Hussmann, 2006). The mechanisms for doing so vary, but typically the mayor appoints the hospital director, who holds the authority to hire and dismiss staff, channel procurement contracts to political allies, fake or omit key information in health care reports and delay payments for goods and services. Hospital directors may also overlook quality-related complaints and tolerate absenteeism, as well as the theft of medical drugs and supplies (Di Tella & Savedoff, 2001; Savedoff & Hussmann, 2006).
Public hospitals in Colombia, known as state social enterprises (ESE in Spanish), are defined as health service enterprises, behaving like production companies with hospital services as their main product. The regulatory framework mandates that these public hospitals must have at least three key areas: Management, health care attention, and logistics (Ministry of Health and Social Protection [MHSP], 2022).
Public hospitals in Colombia operate on a three-tier system. The first level provides ambulatory health services, such as general medicine, dentistry, and basic obstetric care, with the help of general practitioners, paramedical staff, and other non-specialized health professionals. The second level encompasses hospitals providing services related to internal medicine, pediatrics, gynecology-obstetrics, general surgery, psychiatry, and anesthesiology. The third level is reserved for less prevalent health issues, focusing on complex pathologies. These specialized establishments engage in medical and surgical procedures, utilizing intensive human resources and equipment. They perform complex procedures and deploy high-tech resources, often staffed by medical specialists and sub-specialists. The majority of public hospitals (85.34%) belong to the first level and focus on ambulatory care. These hospitals are located in small and medium-sized municipalities (with fewer than 100,000 inhabitants), typically in poor and isolated regions of the country. This group accounts for 36% of total health expenditure. The second level comprises 11.85% of hospitals, located in municipalities with more than 100,000 inhabitants, while the third level represents 2.8% of public hospitals, mostly concentrated in large urban areas and addressing specialized or less prevalent health conditions (MHSP, 2022). The hospitals at the second and third levels together account for 64% of total health care spending and are concentrated in the more populated and affluent regions of the country.
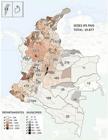
Several studies have been describing the evolution of the 1993 reform in the performance of the Colombian public hospital network. Despite having attained healthcare coverage for a significant segment of the population (94% to 96% since 2010), Colombia falls behind numerous OECD countries concerning health outcomes and the quality of care, such as Colombia’s maternal mortality rate, which is higher than that of all other OECD countries and approximately 25% higher than that of Mexico, which had the second highest rate (World Bank, 2019). Colombia is a developing, middle-income country whose public sector has been vulnerable to cooptation by political elites striving for the diversion of public resources for private gains (Langbein & Sanabria, 2013). The magnitude of this practice ranks the whole Colombian public sector in the position 92th out of 180 countries, where the 180th position is reserved for the least corrupt country (Álvarez-Díaz et al., 2018). This study selected Colombia for several reasons. First, until very recently, the Colombian healthcare system has been regarded as a model for achieving near-universal coverage at a reasonable cost for a middle-income developing country, positioning it as a relevant case to study and potentially replicate. Second, the system continues to undergo significant changes, partly due to persistent regional disparities in income and accessibility, conditions comparable to those of several Latin American, African, and Asian countries. Finally, despite facing challenges related to corruption, Colombia has made substantial efforts to develop open-data systems and publicly accessible procurement platforms. This combination of factors offers a unique opportunity to characterize corruption dynamics within the public sector.
3. METHODOLOGY
This paper presents an approach for measuring the risk of corruption in public hospitals. The study integrates the core framework of the methodology developed by the Mexican Institute of Competitiveness (MIC), which has already been adapted and implemented within Colombia’s public procurement system to assess its corruption risk (Zuleta et al., 2019). This methodology is based on two primary reasons: first, the MIC methodology offers a procurement process framework that, with some modifications, aligns with Colombia’s procurement process; second, the MIC framework has been successfully employed to gauge corruption risk in various Colombian governmental agencies operating under the same contractual regulations as public hospitals (Zuleta et al., 2019).
The MIC methodology proposes the development of a corruption risk index which is composed of 43 indicators divided into three main dimensions: competition (16 indicators), transparency (15 indicators), and law violations or contracting process anomalies (12 indicators). Competition indicators include: the percentage of total spending assigned to tenders with only one participant, the average number of participants per procedure, the Herfindahl-Hirschman Index (HHI) measuring market concentration, the average contract value per procedure, the variety of participants (unique bidders relative to total tenders), and the number of winners relative to the total number of participants. Transparency indicators comprise: the percentage of direct awards without a published contract; the percentage of restricted invitations and public tenders missing key documents (e.g., calls for bids, clarification meetings, proposal openings, award decisions, or contracts); the percentage of in-person rather than digital procedures; and the percentage of procedures lacking a clarification meeting, proposal record, or award decision. Law compliance indicators include: the amount awarded to risky suppliers - such as ghost companies (declared non-existent by the tax authority), sanctioned suppliers, or recently created firms; the percentage of procedures with short or illegal bidding time frames; the percentage of direct awards exceeding the legal spending limit; the percentage of contracts without a legal basis (no justification) or published after their start date; and the percentage of spending justified under Articles 42 (LAASSP) or 43 (LOPSRM), which cap exception procedures at 30% of an institution’s procurement budget (Mexican Institute for Competitiveness [IMCO], 2023).
The index is calculated by the simple average of the 43 indicators where all of them have the same weight. The index is determined for each institution managing public funds. The score calculated by each indicator ranges between 0 and 1, where the value 1 indicates the maximum risk of corruption for that indicator, and 0, represents no risk. This approach explores the digitalization and public access of information to determine the risk of corruption discussed by (Cappelli et al., 2024).
The methodology proposed in this paper is an adaptation of the MIC methodology considering the characteristics of the Colombian health care system, and the limitations in both accessing and collecting data, and the possibility of modelling a given risk of corruption. Also, it considers all the findings in previous works (Fazekas et al., 2016; Fazekas & Kocsis, 2020; Felizzola et al., 2024; Gnaldi & Del Sarto, 2024a; Golden & Picci, 2005). Instead of 43 indicators categorized into three main dimensions, our approach has 12 indicators (Table 1) divided into four main categories: billing management, debt management, spending and contract allocation and anomalies. Each indicator was measured for all 945 public hospitals over the 2016-2018 period. These measurements allowed us to calculate a corruption index for each hospital for the year under analysis. The index for each hospital corresponds to the simple arithmetic average of the twelve indicators, following the procedure proposed in the MIC methodology (IMCO, 2023; Zuleta et al., 2019).
Our study offers a first-time insight into the corruption risk within 97% of the total public hospitals across the country. Furthermore, our approach presents a methodological framework that can be tailored to the specific attributes of other hospitals in middle-income countries, such as Colombia.
3.1 Data source
All the Colombian contracts celebrated with and between public institutions are required to be registered in the public web platform called SECOP II (electronic system for public contracting, in Spanish) (Zuleta et al., 2019). This is a public free access platform where each public institution is required to register all the information related to the process of procurement, mainly by a contractual agreement (Departamento Nacional de Planeación [DNP], 2022; Martínez et al., 2023). For each procurement process performed by a public institution it is required to register the following information: (a) Offeree’s name; (b) Offer´s name; (c) Type of contact (direct award contract or non-direct); (d) Agreement; (e) Scope and specifications; (f) Service delivery and pricing; (g) General schedules; (h) Contract ID and date; (i) Explicit declaration whether the value of the contract surpasses in 50% the minimum value allowed to the public institution to contract (Zuleta et al., 2019). Since the procurement information is the most readily available, our study on corruption risk in the public hospitals contracting process focuses mainly on monitoring both the levels of competition among offers, and the levels of addendums to existing contracts, which constitute one of the red flags indicators for identifying corruption (Cappelli et al., 2024). The lack of competition is a risk indicator that does not necessarily imply the existence of corruption, but it reveals an organization’s vulnerability to unethical and discretionary resource allocation, particularly of funds through contracts, within specific groups (Decarolis & Giorgiantonio, 2022). Furthermore, the level of addendums is a proxy of how much a public institution is prone to change the original contract agreements, usually by increasing the price of the contract and the conditions of payment (Zuleta et al., 2019). The second data source is SIHO (Hospital information system in Spanish) which is also a public platform where all the public hospitals have to periodically register all the information related to the budget, production of services and financial reports. Access to this database is free and public, with some restrictions of information depending on the profile of the user (MHSP, 2022). From this source, we extracted information on each hospital’s bill payments, total expenses, portfolio, bills issued during the period, total billing, initial bill glosses for the period, portfolio in arrears, cost of services provided to non-affiliated patients, total service costs, payroll of non-medical professionals, and total hospital expenses. The reported data enabled us to calculate the corruption risk index for 945 public hospitals during the 2016-2018 period, which corresponds to the timeframe for which data were available and represents the system’s status prior to the disruption caused by the COVID-19 pandemic. These 945 public hospitals are distributed all over the country in 1,103 municipalities. In the calculation of the indicators the absence of information is penalized with the assignment of the maximum value of 1, any level of opacity constitutes a high risk of corruption Staffen, 2020). Usually, NA values are treated simply as missing data. However, in the Colombian context, the failure to report or publish information in mandatory systems such as SECOP II (public procurement) or SIHO (health information) can result in disciplinary or administrative sanctions and may even lead to criminal charges if the omission constitutes part of a criminal act (Colombia Compra Eficiente, 2024). Therefore, the omission of information should itself be considered a punishable act, given the potential implications and the accountability it entails.
3.2 Corruption risk index
The index for monitoring the risk of corruption in the public hospitals is proposed by calculating the average of 12 indicators defined as percentages of different variables (Table 1) in accordance with the MIC methodology (Zuleta et al., 2019). The indicators are divided into four categories: billing management (4 indicators), portfolio management (2 indicators), cost surveillance (2 indicators) and contract allocation and anomalies (indicators) which track the production of services, the enforcement of payment, the spending of money, and the fair allocation of contracts, respectively. These indicators can be measured in any public hospital regardless of its category in terms of service capacity or level of attention. For each hospital, all the indicators listed in Table 1 were calculated for the corresponding year. A simple arithmetic average of the twelve indicators was then computed to generate an index ranging from 0 to 1, where values closer to 0 indicate a low risk of corruption and values closer to 1 indicate a high risk. As noted, correlation does not imply causation; however, a value approaching 1 suggests that a given institution is engaging in practices associated with corrupt behavior. The calculation of the indicators and the composite index can be repeated annually, allowing for the monitoring of corruption risk trends in each hospital over time.
The first four indicators track the behavior of bill payments as a strategy to monitor the inflow of cash to the institution. Indicator 1 tracks the level of bill payment over the hospital total expenses. This indicator measures how much the hospital enforces payments to sustain its expenses. A decrease in payments, or an increase in expenses, indicates mismanagement, possibly linked to corrupt practices destined to beneficiate private debtors (Decarolis & Giorgiantonio, 2022; Ferwerda et al., 2017). Indicator 2 also tracks bill payments, but the comparison is performed over the total portfolio. This indicator tracks the hospital’s ability or willingness to turn insurance company’s debt into payments. The value of the portfolio can increase as a consequence of bribes to the personnel in charge of enforcing payment (Decarolis & Giorgiantonio, 2022; Ferwerda et al., 2017).
Indicator 3 measures the proportion of bills not initially approved by the inpatient’s insurance company as suited. It means that the insurance company demands further explanation (a gloss) regarding the pertinence of the care provided by the institution. If the justification of the service is accepted by the insurance company, then the bill is approved, and it becomes a proper bill. The proportion of initially not approved bills over the total bills measures the exposure of the hospital to either decrease, delay or deny the amount of payment by its services. Also, it is a proxy indicator of the quality of the service in terms of its pertinence and accuracy. This indicator also measures a risk of corruption since the process of approving a bill is ultimately a process of negotiation (Ferwerda et al., 2017). Both parties could illegally benefit from the outcome of the negotiation if part of the bill value can be diverted towards the hospital managerial staff, as a bribe for not charging the bills (Decarolis & Giorgiantonio, 2022).
Finally, indicator 4 determines the percentage of bills for the period t, over the total bills. This indicator measures the changes in the billing process and tracks anomalies in the charging of services. There are several risks of corruption in this process since the lack of billing could mean a sign of favoritism towards the insurance company or some patients (Di Tella & Savedoff, 2001). The next group of indicators (5 and 6) are monitoring the evolution of the portfolio. Indicator 5 determines the weight of the customers’ old debt over the customers’ total debt. Some insurance companies delayed payment as a strategy to pay less. Before the pressure for cash, hospitals are forced to accept a percentage of the initial debt. 365-day old customer debt is both at great risk of not being paid and undergoing a process of negotiation where usually the longer a debt remains unpaid, the lower the amount to be repaid will be. Indicator 6 tracks the evolution of the customers’ debt. Abrupt changes in the value of the portfolio might indicate the risk of corrupt negotiations, condoning debt and diverting money. The third group of indicators (7 and 8), oversee the use of economic resources which could be illegally diverted. Indicator 7 is monitoring the proportion of money spent in health care services to patients non-affiliated to the health care system but in need of attention (such as homeless, illegal immigrants, etc.). Some hospitals might falsely increase the number of these kinds of patients to charge their attention to municipalities or states which are responsible for the coverage of these uninsured populations. Indicator 8 tracks the percentage of expenses destined to the payment of services provided by non-health care personnel (financial advisors, lawyers etc.). In this case, embezzlement of public funds is diverted by the payment of personnel providing consulting, marketing or coaching services.
The fourth group of indicators tracking unusual or concentrated allocation of resources are indicators 9 to 12. Indicators 9 and 10 monitor the public institution levels of concentration of contracts in money and numbers to offers. Indicator 11 monitors the level of change in concentration over time. This indicator is especially considered to track changes in the levels of concentration of the procurement process once the managerial staff of the public institution is changed. Usually, every four years after municipal and state elections, a new managerial staff at the top level takes control of the institution. Indicator 12 measures the weight of the addendums to contracts to the total value of the contracts. This indicator tracks the changes to the original conditions of contracts. High levels of these indicators might indicate corruption, incompetence or both (Di Tella & Savedoff, 2001). The index is calculated annually by the simple average of the indicators considering all the procurement and payment transactions performed during the year by a given public hospital.
The contextualization, the design and calculation of each indicator were subject to a process of debate, validation, and analysis in various workshops held with staff from the Superintendencia Nacional de Salud. During these workshops, the indices were reviewed by experts to verify the mathematical validity of the formulas and ensure the consistency of the results obtained (the Colombian healthcare surveillance agency).
3.3 Index interpretation
The MIC methodology proposes four ranges to classify the level of corruption risk in each institution (Zuleta et al., 2019). The ranges were divided into quarters for simplicity. If the score of the index ranges between 0 and 0.25, the institution is considered with no risk of corruption. Between 0.25 and 0.5, the institution has a low risk of corruption. If it is between 0.5 and 0.75 the institution has a medium risk of corruption. If the index score surpasses 0.75 the institution is considered under a high risk of corruption. Each indicator is expressed as a percentage of a total quantity, for instance, the proportion of directly awarded contracts relative to the total number of contracts. Consequently, all indicators are normalized, and the final index corresponds to the arithmetic mean of the twelve normalized indicators.
4. RESULTS
4.1 Measurements
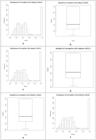
The calculation of the corruption indexes provides a descriptive statistical analysis presented in Figure 2. According to the analysis, the distribution of the indexes is trimodal, meaning that it is characterized by having three distinct peaks or modes. The data in the distribution tends to cluster around three different values or ranges, creating three prominent high-density regions on the graph. In Figure 2, a, c and e the data clusters around the values 0.25, 0.5 and 1, which means low, moderate and high-risk corruption levels, respectively, for the 2016-18 period.
The boxplot analysis (Figure 2, panels b, d, f and Figure 5) illustrates the consistency of the results over time. This implies that while the specific values or data points may differ, the overall shapes and distributions remain similar. The median value is centered around 0.4, but the boxplot’s shape indicates a high-density region situated near the maximum score of 1. This outcome largely stems from the methodology’s penalization of missing or unreported data. The figure also demonstrates that the measurements do not undergo significant changes throughout the period analyzed. In Figure 3, the observations are categorized based on their assigned levels of corruption. Across all categories, notable fluctuations are absent, particularly within the medium and high-risk groups. Between the “no risk”’ and “low risk” categories, there is an exchange of densities during the 2016-2017 period. On average, the results indicate that during the 2016-18 period, 23% of public hospitals exhibited no risk of corruption, 44% were classified as low risk, 8% fell into the medium-risk category, while 25% were categorized as high risk. All the figures were generated with the R statistical program.
The choropleth map analysis allows us to identify the areas at risk of corruption within the territory (Figure 4). To simplify the analysis and given that the indices for 2016-2018 do not vary significantly, the values shown on the map represent the three-year average. For municipalities with more than one hospital, the index is determined by averaging the indexes of all hospitals within that municipality.
Upon averaging the indexes by state, the analysis identifies clusters of moderate corruption risk along the northern coast of Colombia, including the states of Córdoba, Sucre, Bolívar, and Atlántico. On the Pacific coast, the states of Chocó and Cauca are deemed to be at a high risk, while Nariño falls into the medium-risk category. Within the Andean region, most states present a low risk of corruption, except for the states of Cundinamarca and Boyacá. Additionally, the regions within the Orinoco and Amazonas basins as well as the San Andrés, Providencia and Santa Catalina archipelago are assessed to be at a high risk of corruption. The choropleth analysis clearly indicates that the areas with the highest corruption risk are those that are poorest and most geographically isolated. In contrast, the Andean region - where the more affluent municipalities are located - shows a low to moderate risk of corruption. Similarly, some areas along the Caribbean and Pacific coasts, despite being poor and isolated, do not exhibit particularly high corruption risk levels. This suggests that poverty and isolation may be contributing or facilitating conditions for corruption risk, rather than sufficient causes on their own.

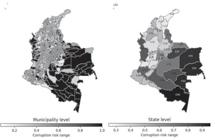
COLOMBIAN CORRUPTION RISK INDEXES CHOROPLETH MAP BY MUNICIPALITY AND STATE (AVERAGE OF THE 2016-2018 PERIOD)
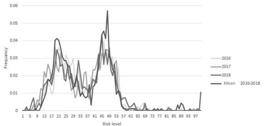
Figure 5 illustrates the bimodal distribution of the corruption risk indexes, showing how hospitals cluster into two distinct groups corresponding to low and moderate corruption risk levels. Further analysis is needed to fully characterize the nature of this distinction, but preliminary findings suggest that municipal institutional capacities for control and oversight - closely linked to income levels - may help explain the observed pattern. The comparison across the three-year period confirms the consistency of the analysis. This outcome is also expected, as the years under study coincide with the same municipal government term (2016-2019), during which administrative practices are likely to have remained stable.
This analysis also identifies which are the main indicators (risk of practices) driving the index results. By determining the percentage contribution of each indicator to the index over the 2016-18 period and averaging the percentages, the five main indicators are: Indicator 2 (13.4%), which considers the ratio of unpaid bills over the total portfolio. Indicator 3 (8.0%), which measures the effect of the glossed bills over the total billing. Indicator 9 (7.8%) addresses the weight in money of directly awarded contracts over the hospital’s total contracts. Indicator 10 (7.6%) measures the weight in units (number of contracts) of directly awarded contracts over the hospital’s total contracts. Finally, indicator 1 (7.3%), considers the ratio of unpaid bills over the hospital’s total expenses.
4.2 Validation
The purpose of validating the indicators is to assess how strongly a set of indicators relates to a particular practice or act considered corrupt (Gnaldi & Del Sarto, 2024b; Lisciandra et al., 2022). Additionally, it evaluates how effectively a particular measurement reproduces a well-known result (Lisciandra et al., 2022; Panerai, 1998). This work considers two sets of validation checks to assess the accuracy of the indicators in highlighting the risk of corruption. Our validation methodology is inspired by the validation procedure of Lisciandra et al. (2022) and considers the limitations and difficulties of corruption risk indicators validation outlined by Ferwerda et al. (2017), Gnaldi and Del Sarto (2024b), and Johnsøn and Mason (2013).
Our validation approach is a proxy-validation procedure since no corruption risk indicators have been measured specifically for the Colombian public hospital network. Proxy-validation of indicators in social sciences involves assessing the reliability and validity of alternative measures for complex constructs (Biolcati-Rinaldi et al., 2018). In healthcare, proxy-validation of indicators involves assessing the ability of alternative measures to accurately represent health needs or outcomes (Birch et al., 1996; Skolarus et al., 2010), In Colombia, corruption risk indicators have been measured for municipal and state-level administrations. This measurement has been conducted by Transparency for Colombia (TFC), a non-governmental organization responsible for assessing corruption risks in the public sector (TFC, 2016a, 2016b). The TFC’s methodology evaluates corruption risks using three distinct factors: visibility (transparency of processes), institutionalism (compliance with regulations), and control and law enforcement (disciplinary and legal actions against corruption). These factors are combined into an index that scores the corruption risk of a given municipality or state. The methodology was implemented from 2002 to 2016.
The proxy-validation procedure compares the results of the TFC methodology with those of our proposed methodology for the year 2016, the only year in which both measurements coincide. The TFC index does not specifically analyze the performance of the public healthcare sector. However, since the public healthcare sector is embedded within municipal administration, both methodologies (Transparency for Colombia’s and ours) are expected to yield similar results. This implies that the corruption risk level of a given public hospital is likely correlated with the corruption level of the municipal public administration to which it belongs. Moreover, the average corruption levels of multiple public hospitals within a given state are expected to correlate with the corruption level of the state’s public administration. In this study, we propose two tests to determine whether there is a significant difference between the corruption risk measurements of individual hospitals and their corresponding municipalities, as well as between the average corruption risk of hospitals within a state and the state’s public administration.
The first test compares whether there is a significant difference between θ Mi (TFC indicator of a given municipality) and θ HMi (proposed index for the main, and in most cases only hospital in the same municipality). The test compares the measurements from 28 municipalities and their main hospitals distributed across the Colombian territory. If D corresponds to the difference between the TFC index (θ Mi ) and the proposed index (θ HMIN ), the hypothesis of the statistical test is:
A significant difference between θ Mi and θ HMIN indicates a lack of relationship between the indices, resulting in the rejection of the null hypothesis (H o ). To compare the two samples, it is necessary to determine whether the differences of the sample follow a normal distribution. The results show that the Shapiro-Wilk test for the differences yielded a p-value of 0.238, indicating that the differences follow a normal distribution (p > 0.05).
Statistical Test: Since normality is met, a paired t-test was performed. As the p-value equals 0.876, which is much greater than 0.05, this indicates that there is no statistically significant difference between sample 1 and sample 2 at the 5% significance level. This implies that there is not enough evidence to reject the null hypothesis (H o ), and there is not a significant difference between the corruption risk measurements of municipal public administrations and their respective main hospitals.
The second test compares whether there is a significant difference between θ Si (TFC indicator of a given state) and θ HMi (proposed index for the average index of the main hospitals of the same state). The test compares the measurements of corruption risk from 29 states and the average corruption indexes of the respective main hospitals of the same state. If D, corresponds to the difference between the TFC index (θ Si ) and the proposed index (θ HMi ), the hypothesis of the statistical test is:
A significant difference between θ Si and θ HMi indicates a lack of relationship between the indices resulting in the rejection of the null hypothesis (H o ). Again, to determine which test needs to be implemented, it is necessary to compare whether the differences of the two samples follow a normal distribution. The results show that the Shapiro-Wilk test for the differences yielded a p-value of 0.024, indicating that the differences do not follow a normal distribution (p > 0.05).
Statistical Test: Since normality is not met, a Wilcoxon signed-rank test (non-parametric alternative to the paired t-test) was performed (α = 0.05). As p-value equals 0.284, which is greater than 0.05, it indicates that there is no statistically significant difference between Sample 1 and Sample 2 at the 5% significance level. This implies that there is not significant evidence to reject the null hypothesis (H o ), which means that there is no difference between the corruption risk measurements of state level public administrations and their hospitals in the same state.
The previous analysis indicates that, for the year 2016, our proposed approach produced results that aligned with the measurements provided by Transparency for Colombia. The analysis successfully reproduced municipal- and state-level corruption risk measurements, which indicate that the selected indicators effectively capture key aspects of hospital management, signaling potential undue behavior.
5. DISCUSSION AND FUTURE DIRECTIONS
The results presented in the previous section illustrate how the risk of corruption in Colombian public hospitals can be categorized into two groups. A significant proportion of hospitals face low to moderate corruption risk, primarily located in the Andean region and select municipalities along the northern coast of Colombia. The other group of hospitals encounters a high risk of corruption, largely due to penalties stemming from challenges in data availability or the inability to deliver the required data. These hospitals are concentrated in the outskirts of the Colombian territory, particularly in the rainforest regions of the Pacific coast, Amazonian and Orinoco basins. Additionally, there are corruption-prone hospitals located in proximity to Venezuela and the Caribbean coast. This regional distribution of corruption risk correlates with Colombia’s geography of population density, poverty levels, and isolation. The present analysis illustrates that the farther one moves from the densely populated Andean region - Colombia’s most populous area - the higher the risk of corruption becomes. In remote, sparsely populated, and isolated municipalities, the corruption risk score is elevated. As observed in the results of the study, a median of approximately 0.4 in public hospitals in Colombia, places them in general terms at a low level of corruption risks. Another finding concerns the indicators that score high among the rest. The key indicators presenting levels above the average are the indicators related to the level of debt that people or institutions have with the hospitals and the direct allocation of contracts. These findings confirm the work of Gnaldi and Del Sarto (2024a), which demonstrates that corruption risk indicators based on public procurement can be designed and used to detect undue practices.
Regarding the methodology used, this study indicates that the selected indicators effectively capture how prone a given hospital is to corruption risk practices. The validation process itself is an important finding for several reasons. First, it suggests a correlation between municipal and hospital management corruption risks within the same area. Second, penalizing hospitals that do not report information with the maximum score does not appear to exaggerate or overestimate their corruption risk levels. Third, given the observed correlation between municipal- and state-level corruption risk and that of municipal- and state-level hospitals, both measurements can serve as proxy validations for each other.
This study also faces several challenges due in part to the lack of access to public information. Even though the used sources are publicly available, there are other key variables which our approach could not have access to. The indicators are a set of quantitative expressions capturing the main depiction of the flows of money in the system; however, they face the limitations of presenting a broad description of a phenomenon without explaining its root causes. There is a need for a broad methodological approach to the terms, composition and validity of use of these indicators, to fully understand their level of accuracy and reach.
Finally, as a future line of research, it is recommended to address the other actors that are part of the health ecosystem in Colombia, understanding that corruption is widespread and that in all processes, relationships, or negotiations with the different actors there are factors that facilitate corruption that become a breeding ground for corrupt decision-making by individuals who are in positions of power and have the expectation of diverting that power to interests.
The presence of corruption in the healthcare system is a matter of concern, where the control of discretionary power is the key to prevention and deterrence. The analysis presented in this work illustrates how indicators can be used as an effective tool to spot unusual levels of economic resource allocation. Also, the provision of insights for municipal and state-level comparisons regarding this issue. This work presents a general framework for the design of indicators that can be adapted to the local characteristics of a given country, state, or municipality. The methodology presented in this paper heavily relies on public access to public hospitals’ contractual data and the determination of policy makers and hospital staff to tackle corruption.
ACKNOWLEDGEMENTS
The authors want to thank the invaluable insights and contributions of Martha Elena Badel Rueda, Paula Andrea Zapata Flórez and Laura Ramírez Gómez. The authors acknowledge the use of ChatGPT (OpenAI) for assistance with English language editing, including grammar and style corrections. The authors take full responsibility for the content of the manuscript.
REFERENCES
- Abadia, C. E., & Oviedo, D. G. (2009). Bureaucratic itineraries in Colombia: A theoretical and methodological tool to assess managed-care health care systems. Social Science & Medicine, 68(6), 1153-1160.
- Akbar, H., & Vujić, V. (2014). Explaining corruption: The role of national culture and its implications for international management. Cross Cultural Management, 21(2), 191-218.
- Álvarez-Díaz, M., Saisana, M., Montalto, V., & Moura, C. T. (2018). Corruption perceptions index 2017 statistical assessment European Commission Joint Research Centre.
- Azfar, O., Lee, Y., & Swamy, A. (2001). The causes and consequences of corruption. The Annals of the American Academy of Political and Social Science, 573(1), 42-56.
- Biolcati-Rinaldi, F., Molteni, F., & Salini, S. (2018). Assessing the reliability and validity of Google Scholar indicators: The case of social sciences in Italy. In The evaluation of research in social sciences and humanities: Lessons from the Italian experience (pp. 295-319).
- Birch, S., Eyles, J., & Newbold, K. B. (1996). Proxies for healthcare need among populations: Validation of alternatives-a study in Quebec. Journal of Epidemiology & Community Health, 50(5), 564-569.
- Cappelli, L., Pisano, A., Iannucci, E., Papetti, P., D’Ascenzo, F., & Ruggieri, R. (2024). Digitalization and prevention of corruption: Opportunities and risks-Some evidence from the Italian university system. Business Strategy and the Environment, 33(1), 81-94.
-
Colombia Compra Eficiente. (2024). Manual of supervision and contractual oversight (v. 1). https://colombiacompra.gov.co
» https://colombiacompra.gov.co - Cooley, A., & Sharman, J. C. (2017). Transnational corruption and the globalized individual. Perspectives on Politics, 15(3), 732-753.
- Decarolis, F., & Giorgiantonio, C. (2022). Corruption red flags in public procurement: New evidence from Italian calls for tenders. EPJ Data Science, 11(1), 16. https://doi.org/10.1140/epjds/s13688-022-00325-x
-
Departamento Nacional de Planeación. (2022). SECOP I https://www.colombiacompra.gov.co/secop/secop-i
» https://www.colombiacompra.gov.co/secop/secop-i - Di Tella, R., & Savedoff, W. D. (2001). Diagnosis corruption: Fraud in Latin America’s public hospitals Inter-American Development Bank.
- Fazekas, M., & Kocsis, G. (2020). Uncovering high-level corruption: Cross-national objective corruption risk indicators using public procurement data. British Journal of Political Science, 50(1), 155-164.
- Fazekas, M., & Tóth, I. J. (2016). From corruption to state capture: A new analytical framework with empirical applications from Hungary. Political Research Quarterly, 69(2), 320-334.
-
Fazekas, M., Cingolani, L., & Tóth, B. (2016). A comprehensive review of objective corruption proxies in public procurement: Risky actors, transactions, and vehicles of rent extraction (Working Paper Series No. GTI-WP/2016:03). Government Transparency Institute. https://doi.org/10.13140/RG.2.2.27430.11846
» https://doi.org/10.13140/RG.2.2.27430.11846 - Felizzola, H., Gomez, C., Arrieta, N., Jerez, V., Erazo, Y., & Camacho, G. (2024). Enhancing transparency in public procurement: A data-driven analytics approach. Information Systems, 125, 102430.
- Ferwerda, J., Deleanu, I., & Unger, B. (2017). Corruption in public procurement: Finding the right indicators. European Journal on Criminal Policy and Research, 23, 245-267.
- García, P. J. (2019). Corruption in global health: The open secret. The Lancet, 394(10214), 2119-2124.
- Gnaldi, M., & del Sarto, S. (2024a). Measuring corruption risk in public procurement over emergency periods. Social Indicators Research, 172(3), 859-877.
- Gnaldi, M., & del Sarto, S. (2024b). Validating corruption risk measures: A key step to monitoring SDG progress. Social Indicators Research, 175(3), 1045-1071.
- Golden, M. A., & Picci, L. (2005). Proposal for a new measure of corruption, illustrated with Italian data. Economics & Politics, 17(1), 37-75.
- Hajdu, M., Pápay, B., Szántó, Z., & Tóth, I. J. (2018). Content analysis of corruption coverage: Cross-national differences and commonalities. European Journal of Communication, 33(1), 7-21.
- Hutchinson, E., Balabanova, D., & McKee, M. (2019). We need to talk about corruption in health systems. International Journal of Health Policy and Management, 8(4), 191-194.
- Johnsøn, J., & Mason, P. (2013). The proxy challenge: Why bespoke proxy indicators can help solve the anti-corruption measurement problem (U4 Brief 2013:2). U4 Anti-Corruption Resource Centre.
- Kok, S., Rutherford, A. R., Gustafson, R., Barrios, R., Montaner, J. S. G., Vasarhelyi, K., & V. H. I. V. T. P. M. Group. (2015). Optimizing an HIV testing program using a system dynamics model of the continuum of care. Health Care Management Science, 18, 334-362.
- Kos, M. (2019). Introduction to healthcare systems. In The pharmacist guide to implementing pharmaceutical care (pp. 437-441).
- Langbein, L., & Sanabria, P. (2013). The shape of corruption: Colombia as a case study. Journal of Development Studies, 49(11), 1500-1513.
- Lewis, J. (2017). Social impacts of corruption upon community resilience and poverty. Jàmbá: Journal of Disaster Risk Studies, 9(1), 1-8.
- Lisciandra, M., Milani, R., & Millemaci, E. (2022). A corruption risk indicator for public procurement. European Journal of Political Economy, 73, 102141.
- Mackey, T. K., & Cuomo, R. E. (2020). An interdisciplinary review of digital technologies to facilitate anti-corruption, transparency and accountability in medicines procurement. Global Health Action, 13(sup1), 1695241.
- Malito, D. (2014). Measuring corruption indicators and indices (RSCAS Working Paper 2014/13). European University Institute.
- Manna, R., & Palumbo, R. (2019). How to fight public corruption? Capturing evidence from a fixed effects model for Western European countries. International Journal of Organization Theory & Behavior, 22(4), 313-330.
- Martínez, R., Pons, C., Rodríguez, R., & Vera, P. (2023). Quality study of open government data related to COVID-19 in Latin America. Revista Facultad de Ingeniería Universidad de Antioquia, 108, 18-32.
-
Mexican Institute for Competitiveness. (2023). Corruption risk index: Public procurement in Mexico, 2018-2022 https://imco.org.mx/riesgosdecorrupcion
» https://imco.org.mx/riesgosdecorrupcion -
Ministry of Health and Social Protection. (2022). Proposal for the redefinition of the operational characteristics of public hospitals [In Spanish]. https://www.minsalud.gov.co/sites/rid/Lists/BibliotecaDigital/RIDE/VS/PSA/estudiooferta-servicios-primarios-hospitales-publicos.pdf
» https://www.minsalud.gov.co/sites/rid/Lists/BibliotecaDigital/RIDE/VS/PSA/estudiooferta-servicios-primarios-hospitales-publicos.pdf -
Ministry of Health and Social Protection. (2023). Special Registry of Health Service Providers (REPS) https://www.paho.org/sites/default/files/2-presentacion-viceministro_0.pdf
» https://www.paho.org/sites/default/files/2-presentacion-viceministro_0.pdf - Oberoi, R. (2014). Mapping the matrix of corruption: Tracking the empirical evidences and tailoring responses. Journal of Asian and African Studies, 49(2), 187-214.
- Palacio Acosta, C. A. (2013). The crisis in the Colombian healthcare system. Revista Colombiana de Psiquiatría, 42(4), 303-312.
- Panerai, R. (1998). Validation of indicators for health policy research. World Health Forum, 19(1), 6-11.
- Pillay, S., & Dorasamy, N. (2010). Linking cultural dimensions with the nature of corruption: An institutional theory perspective. International Journal of Cross Cultural Management, 10(3), 363-378.
- Previtali, P., & Cerchiello, P. (2018). The prevention of corruption as an unavoidable way to ensure healthcare system sustainability. Sustainability, 10(9), 3071.
-
Puaschunder, J. M. (2020). The future of artificial intelligence in international healthcare: Three indices for integrating technology, productivity, anti-corruption and healthcare interaction around the world(SSRN Scholarly Paper No. 3633951). Social Science Research Network. https://doi.org/10.2139/ssrn.3633951
» https://doi.org/10.2139/ssrn.3633951 - Savedoff, W. D. (2007). Transparency and corruption in the health sector: A conceptual framework and ideas for action in Latin America and the Caribbean Inter-American Development Bank.
- Savedoff, W. D., & Hussmann, K. (2006). The causes of corruption in the health sector: A focus on health care systems. In Global corruption report (pp. 4-16). Transparency International.
- Sequeira, S. (2012). Advances in measuring corruption in the field. In D. Serra & L. Wantchekon(Eds.), New advances in experimental research on corruption (pp. 145-175). Emerald.
- Skolarus, L. E., Sánchez, B. N., Morgenstern, L. B., Garcia, N. M., Smith, M A, Brown, D. L., & Lisabeth, L. D. (2010). Validity of proxies and correction for proxy use when evaluating social determinants of health in stroke patients. Stroke, 41(3), 510-515.
- Slager, R. (2017). The discursive construction of corruption risk. Journal of Management Inquiry, 26(4), 366-382.
- Smith, S. E. (1976). Neuromuscular blocking drugs in man. In E. Zaimis(Ed.), Neuromuscular junction(Handbook of experimental pharmacology, Vol. 42, pp. 593-660). Springer.
- Sommer, J. M. (2020). Corruption and health expenditure: A cross-national analysis on infant and child mortality. The European Journal of Development Research, 32, 690-717.
- Staffen, M. R. (2020). Transnational environmental corruption indicators: Opacity in international transparency. Brazilian Journal of International Law, 17, 352-372.
- Stiernstedt, P. (2019). Some things are rarely discussed in public: On the discourse of corruption in healthcare-Comment on “We need to talk about corruption in health systems”. International Journal of Health Policy and Management, 8(9), 560-562.
-
Transparency for Colombia. (2016a). Departmental transparency index and comptrollers: Results April 2015-2016(Vol. 18) [In Spanish]. https://transparenciacolombia.org.co/indice-transparencia-departamental-2015-2016/
» https://transparenciacolombia.org.co/indice-transparencia-departamental-2015-2016/ -
Transparency for Colombia. (2016b). Municipal transparency index: Results April 2015-2016 (Vol. 17) [In Spanish]. https://transparenciacolombia.org.co/indice-transparencia-departamental-2015-2016-2/
» https://transparenciacolombia.org.co/indice-transparencia-departamental-2015-2016-2/ -
United Nations Development Programme. (2005). Institutional arrangements to combat corruption: A comparative study https://www.undp.org/asia-pacific/publications/institutional-arrangements-combat-corruption-comparative-study
» https://www.undp.org/asia-pacific/publications/institutional-arrangements-combat-corruption-comparative-study - Vian, T. (2008). Review of corruption in the health sector: Theory, methods and interventions. Health Policy and Planning, 23(2), 83-94.
-
World Bank. (2019). External assessment of quality of care in the health sector in Colombia http://documents.worldbank.org/curated/en/719321564123515864
» http://documents.worldbank.org/curated/en/719321564123515864 -
Zuleta, M. M., Ospina, S., & Caro, C. A. (2019). Índice de riesgo de corrupción en el sistema de compra pública colombiano a partir de una metodología desarrollada por el Instituto Mexicano para la Competitividad Fedesarrollo. http://hdl.handle.net/11445/3872
» http://hdl.handle.net/11445/3872 - Zyglidopoulos, S., Hirsch, P., de Holan, P., & Phillips, N. (2017). Expanding research on corporate corruption, management, and organizations. Journal of Management Inquiry, 26(3), 247-253.

 Source: Ministry of Health and Social Protection (2023).
 Source: Elaborated by the authors.
 Source: Elaborated by the authors.
 Source: Elaborated by the authors.
 Source: Elaborated by the authors.