 OPTIMIZATION OF H2 AND ORGANIC ACID PRODUCTION FROM SUGARCANE BAGASSE AND PENTOSE LIQUOR USING A CONSORTIUM OF AUTOCHTHONOUS MICROORGANISMS
Abstract
An autochthonous inoculum was developed using sugarcane bagasse (SCB) as the sole source of microorganisms in anaerobic reactors containing yeast extract (2.0 g L-1) and pentose liquor (3 g COD L-1, where COD: chemical oxygen demand), with the initial pH adjusted to 6.5. This inoculum was applied to evaluate the individual and interactive effects of SCB concentration (1.6 8.4 g L-1), pentose liquor concentration (0.4-4.4 g COD L-1), obtained from the hydrothermal pretreatment of SCB at 190 °C for 10 min, and initial pH (5.2-6.8) on biological hydrogen (H2) production. Statistical optimization tools were employed to identify optimal operational conditions. H2 production reached up to 126.82 mL under the evaluated conditions, while carbohydrate utilization efficiencies ranged from 38 to 76%. According to the statistical optimization, maximum H2 production (179.43 mL) was achieved at 1.5 g L-1 SCB, 4.7 g COD L-1 pentose liquor, and an initial pH of 6.8, accompanied by the formation of butyric (1,250 mg L-1), acetic (840 mg L-1), and lactic acids (425 mg L-1). The relatively low SCB loading may have reduced the impact of inhibitory compounds commonly present in lignocellulosic hydrolysates. These results demonstrate the effectiveness of process optimization in enhancing fermentative H2 production from sugarcane-derived substrates.
Keywords:
optimization; fermentation; biohydrogen; sugarcane bagasse.
INTRODUCTION
Global energy production can be increased, and the negative impacts associated with the use of fossil fuels can be reduced by expanding renewable sources, such as hydroelectric, wind, solar, or biomass energy. Biomass, including by-products from the sugar and alcohol industry, can be used as a substrate for biological hydrogen (H2) production by fermentative bacteria. This approach contributes both to energy generation and sustainable waste disposal.1,2
In this context, Brazil stands out as one of the largest sugarcane producers of the world. For the 2025/2026 harvest, national sugarcane production is estimated at approximately 660 million metric tons, reinforcing the leading position of the country in the global sugar-energy sector. Sugarcane is one of the most relevant agricultural commodities of Brazil, playing a strategic role in the production of sugar, ethanol, and bioenergy, and accounting for a significant share of the national agricultural output value.3
Sugarcane bagasse (SCB), a by-product of sugar and alcohol production, is commonly used for energy cogeneration. In Brazil, nearly 95% of the SCB produced is burned in boilers to generate steam, a process that results in the formation of a significant amount of sugarcane bagasse ash.4 However, this approach leads to serious environmental pollution problems. During combustion, the release of pollutants and harmful particles into the atmosphere occurs, negatively affecting air quality and local environmental conditions.5
Within the framework of circular economy strategies, the sugarcane industry has increasingly been associated with the concept of integrated biorefineries, where lignocellulosic residues such as bagasse, straw, and molasses are converted into multiple value-added products. Recent studies6 in this context of lignocellulosic biorefineries have highlighted that agricultural residues can serve as carbon-rich feedstocks for the production of biofuels and other bioproducts, including ethanol, biogas, organic acids, and biopolymers. This integrated approach contributes to the transition from fossil-based systems to bio-based circular economies.6
SCB is a lignocellulosic material, primarily comprising cellulose (25-29%), hemicellulose (36-45%), and lignin (18-26%).7 The carbohydrate fractions present in this lignocellulosic matrix can be converted into fermentable sugars after the hydrolysis process, enabling their use as substrates for microbial fermentation and bioenergy production. Moreover, during H2 production in fermentation, organic acids such as acetic, butyric, lactic, propionic, succinic, isovaleric, among others, are produced, and these are high-value-added products.8
To increase microbial accessibility to carbohydrate polymers and enhance the efficiency of microbial hydrolysis, lignocellulosic biomass generally requires pretreatment through physical, chemical, mechanical, or biological methods. This process alters the crystallinity of cellulose, disrupts the bonds between lignin and carbohydrates, removes lignin and hemicellulose, and increases porosity, making carbohydrates more accessible. For example, through the hydrothermal pretreatment of SCB, the solid fraction rich in cellulose and a liquid phase (commonly referred to as pentose liquor or hemicellulosic hydrolysate) are obtained. This liquid fraction is produced during processes such as hydrothermal pretreatment and contains mainly pentose sugars derived from hemicellulose degradation.9
SCB may also harbor autochthonous microbial communities associated with its fibrous structure. These microorganisms can produce enzymes involved in the degradation of complex polymers, such as cellulose and hemicellulose, contributing to the initial hydrolysis of lignocellulosic components.10 Autochthonous bacteria such as Clostridium and Paenibacillus are known to perform simultaneous hydrolysis and fermentation,10,11 whereas among autochthonous fungal species in SCB, Aspergillus12 and Polyporus13 have been identified.
In biological processes such as fermentative H2 production, where multiple variables can influence the outcomes, factorial designs are useful tools to reduce complexity and facilitate process optimization. In several studies,14,15 central composite design (CCD) and response surface methodology (RSM) have been employed as optimization strategies in fermentative processes for H2 production.
RSM applies experimental design techniques to perform multiple regression analysis, allowing the identification of relationships between process variables. By using this approach, fewer experimental runs are required to obtain the necessary information and achieve statistically robust results.16,17 In this context, using SCB after hydrothermal pretreatment, Soares et al.18 optimized H2 production by adjusting yeast extract and substrate concentrations, reaching 16.8 mL of H2 under optimized conditions. Likewise, Lopez-Hidalgo et al.19 evaluated the optimization of H2 production using wheat straw hydrolysate by varying pH, temperature, and total sugar concentration in the medium. The authors reported an optimized hydrogen production of 3,277 mL H2. Ribeiro and Silva20 achieved an optimized H2 production of 530.05 mL using alkaline pretreatment (6 M NaOH) and 81.2 g L-1 of hydrolyzed potato peel.
Although H2 production from lignocellulosic hydrolysates has been widely reported in the literature, most studies21,22 focus on single substrates or hydrolysate fractions obtained after pretreatment. In contrast, the simultaneous use of different fractions derived from the same lignocellulosic feedstock remains less explored, particularly in systems employing autochthonous microbial consortia.
Within the context of sugarcane biorefineries, the integration of solid lignocellulosic residues with their corresponding hydrolysate streams represents a promising strategy for improving biomass valorization and increasing process sustainability. However, experimental investigations addressing the combined use of these fractions for fermentative H2 production remain limited.
In the present study, the combined use of SCB and hemicellulosic hydrolysate (pentose liquor) derived from its pretreatment was investigated. To date, this approach has not been widely explored, despite the inherent advantages of utilizing by-products within the same production chain. To achieve this objective, CCD and RSM were employed to develop an optimized model for H2 production. The selection of these variables aims to optimize the process and assess the feasibility of using these substrates in combination for H2 production, contributing to a more sustainable and integrated approach within the biorefinery production chain.
EXPERIMENTAL
Substrates and pretreatment
The raw SCB used as a substrate in the H2 production experiments was provided by the São Martinho mill (Pradópolis, São Paulo, Brazil). SCB was air-dried at room temperature until reaching a constant weight and then ground in a knife mill using a 30-mesh screen (≤ 0.595 mm).23 The cellulose, hemicellulose, and lignin contents of the SCB were 31.4, 41.6, and 24.8%, respectively.
The pentose liquor was provided by the National Laboratory of Science and Technology of Bioethanol (CTBE) and was obtained through the hydrothermal pretreatment of SCB at 190 °C for 10 min. The liquor was stored at -80 °C and thawed immediately prior to use. The physicochemical characterization of the pentose liquor was performed in this study, and the results are summarized in Table 1. Pentose liquor concentration was expressed in terms of chemical oxygen demand (g COD L-1).
Autochthonous fermentative inoculum
To obtain the autochthonous inoculum, 2 L Duran® reactors were filled (50% of the working volume) with a yeast extract solution (2.0 g L-1) and deionized water, with pH adjusted to 6.5 using NaOH or HCl. The mixture was then autoclaved at 121 °C for 20 min. After sterilization, SCB (5 g L-1) was added as the sole autochthonous source of bacteria and fungi, together with pentose liquor (3 g COD L-1). The reactors were flushed with nitrogen (N2) for 15 min, sealed with butyl rubber stoppers and plastic screw caps, and incubated for 84 h under mesophilic conditions (37 °C).
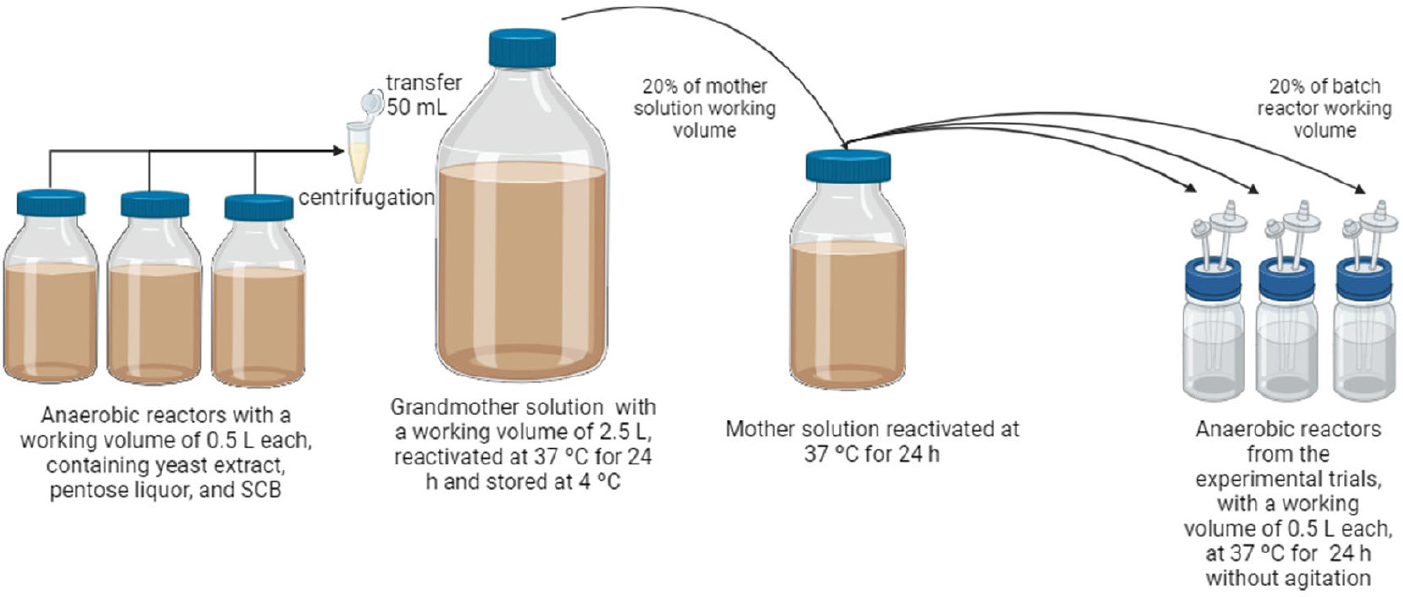
Prior to the fermentation assays, aliquots of the autochthonous inoculum were reactivated according to Moura et al.24 Briefly, 50 mL of supernatant was collected from the reactors, transferred to Falcon tubes, and centrifuged (7,000 rpm for 5 min). The resulting pellet was resuspended in 5.0 L Duran bottles (50% working volume) containing yeast extract (2.0 g L-1), pentose liquor (3.0 g COD L-1), and SCB (5 g L-1), and incubated at 37 °C for 24 h. From this reactivation step, the autochthonous inoculum (10% of the working volume of the batch reactors) was centrifuged (7,000 rpm at 4 °C for 5 min) and used in the fermentation experiments (Figure 1).

Optimization of fermentative conditions
Batch experiments were performed in triplicate using reactors with a working volume of 500 mL, under a 100% N2 atmosphere for 10 min, with 10% (v/v) of autochthonous inoculum. SCB and pentose liquor were used as the carbon substrates, while yeast extract (2 g L-1) was added as a nitrogen and vitamin source to support microbial growth.25 The concentrations of SCB, pentose liquor, and pH levels were defined according to Table 1. The initial pH in the experiments was adjusted using HCl or NaOH.
The fixed variables were working volume (500 mL), inoculum concentration (10% v/v), and temperature (37 °C). The batch reactors were operated until H2 production stabilized, with continuous monitoring maintained throughout the process.
Experimental design
Central composite design (CCD) was used to evaluate the statistical significance of the relationship between SCB concentration (X1), pentose liquor concentration (X2), and pH (X3) on H2 and butyric acid (HBu) production. CCD, one of the designs within response surface methodology (RSM), included five different levels (+1, -1, 0, -1.68, and +1.68) and two replicates at the central point (A-15 and A-16).
Experimental validation was performed to verify the predicted response of the model in terms of maximum cumulative H2 production under the optimal condition (1.5 g L-1 of SCB, 4.7 g COD L-1 of pentose liquor, and an initial pH of 6.8).26
Physicochemical and chromatographic analyses
Total solids (TS) and COD were determined according to the procedures outlined in the Standard Methods for the Examination of Water and Wastewater.27 The analysis of total soluble carbohydrates in the hydrolyzed fraction was performed using the phenol-sulfuric acid method.28 Soluble organic acids and furans were quantified by high-performance liquid chromatography.29 Total phenolic content was determined using the 4-aminoantipyrine method.30
The H2 content was determined by gas chromatography according to Araujo et al.31 Biogas samples (0.5 mL) were collected from each pressurized reactor using a gas-tight syringe with a pressure lock. The H2 concentration was calculated based on the injected volume, the chromatographic area (calibrated in mmol), and the headspace volume.
Assuming that H2 production is proportional to microbial activity, the experimental data (mean values from triplicate reactors) were obtained and fitted using the modified Gompertz equation32 by Equation 1, with the OriginPro® 9.0 software (OriginLab Corp., USA, 2020). In this equation, H is the cumulative H2 production (mL), P is the maximum H2 production potential (mL), Rm is the maximum H2 production rate (mL h-1), e is the Euler constant (2.71828), and λ is the lag time before the onset of H2 production (hours).
A second-order polynomial expression was used to represent P and Rm as a mathematical model. The goodness of fit of the quadratic model was evaluated by the coefficient of determination (R2) using analysis of variance (ANOVA), while its statistical significance was confirmed by the F-test. The predictive ability of the models was assessed by analyzing the residuals. Experimental data obtained from the factorial design and RSM were fitted and statistically analyzed using STATISTICA®10 software (StatSoft Inc., USA, 2010), with a confidence level of 10% (p < 0.10).14,24,33
A principal component analysis (PCA) was performed using Origin 9.0 to investigate potential relationships between inhibitory compounds and fermentative performance.
RERULTS AND DISCUSSION
Optimization of H2 production by central composite rotational design (CCRD)
Significant variations were observed in P, Rm, and λ (Table 2), highlighting the importance of adjusting operational parameters to optimize H2 production. Observed P values ranged from 0.00 mL H2 (A-04) to 126.82 mL H2 (A-07), Rm from 0.00 mL h-1 (A-04) to 17.25 mL h-1 (in A-08), and λ from 0.0 h (A-04) to 50 h (A-03 and A-12). H2 production began more rapidly in A-05 (after 8.64 h), and stabilization was achieved within 96 h. In other studies using batch reactors,34,35 H2 was produced within a few hours after inoculum addition, followed by a stabilization phase, during which P values tended to plateau.
Experimental matrix of the central composite rotational design (CCRD) with three variables and independent responses (P, Rm, and λ)
Regarding λ, when the pH increased from 5.2 to 6.5, there was an average reduction of 33 h. The mean λ for experiments with initial pH values of 5.5, 6.0, and 6.5 were 43.98 ± 9.5 h (A-01 to A-04), 34.95 11.75 h (A-09, A-10, A-11, A-12, A-15, and A-16), and 10.66 ± 2.15 h (A-05 to A-08), respectively. Thus, λ at near-neutral pH was shorter compared to acidic conditions, likely due to the physiological characteristics of hydrolytic and acidogenic bacteria, which tend to exhibit faster growth rates.36 Another hypothesis associated with the reduced λ in H2 production may be related to using an autochthonous inoculum, which was originally obtained under an initial pH of 6.5. The autochthonous bacteria and fungi in the SCB and hemicellulosic hydrolysate were likely adapted to environmental conditions with a near-neutral pH.10
Chairattanamanokorn et al.37 also reported a shorter λ (9 h) for H2 production from SCB hydrolysate at an initial pH of 6. In contrast, a longer λ was observed at an initial pH of 4, requiring 43.3 h before H2 production began. According to the authors, this effect may be attributed to the adaptation period required for the microbial consortium under acidic conditions, which is consistent with the findings of the present study.
The highest H2 production (126.82 ± 10.46 mL) was obtained in assay A-07, with 3.0 g L-1 of SCB, 3.6 g COD L-1 of pentose liquor, and an initial pH of 6.5, highlighting the efficiency of the process under these specific conditions, which is consistent with findings from similar studies. Eker and Sarp38 obtained H2 production of 128.99 mL using hydrolysate from paper waste as substrate in batch reactors under mesophilic conditions and an initial pH of 6.8. Saratale et al.39 reported significantly higher cumulative H2 production (371.25 mL) when using SCB hydrolysate at a concentration of 10 g L-1 and an initial pH of 7.0. Similarly, Montoya et al.15 observed 240 mL of H2 at an initial pH ≥ 7.0 in batch reactors operated with coffee processing residues as substrate, reinforcing the impact of higher initial pH and increased substrate concentrations on H2 production. According to the results obtained in A-07, significant H2 production (126.82 ± 10.46 mL) was also achieved under slightly acidic conditions and moderate SCB concentrations, highlighting the importance of pH adjustment and substrate concentration in optimizing the process.
For the experiments conducted at an initial pH ≤ 5.5 (A-01 to A-04 and A-13), the H2 production potential (P) were 19.64 ± 1.22, 21.96 ± 3.31, 29.94 ± 3.12, 0.00, and 30.34 ± 5.37 mL H2, respectively. Under the conditions tested with the autochthonous consortium from pentose liquor combined with SCB, higher P was observed even under more acidic pH values when compared to Mazareli et al.36 These authors reported a cumulative H2 production of 12.32 mL under mesophilic conditions, using an autochthonous consortium derived from banana waste at an initial pH of 5.09.
In the present study, no H2 production was observed in assay A-04, which used 7.0 g L-1 of SCB and 3.6 g COD L-1 of pentose liquor at an initial pH of 5.5. High solids concentrations can limit fermentative hydrogen production due to mass transfer restrictions and the accumulation of metabolic intermediates in the medium.40 In addition, elevated substrate loading may promote the rapid formation of organic acids, resulting in increased medium acidity and unfavorable conditions for hydrogen-producing microorganisms. Under such conditions, undissociated weak acids may diffuse across the cell membrane, disrupting intracellular pH balance and inhibiting key enzymatic reactions associated with hydrogen production.41 Pattra et al.42 used SCB hydrolysate in batch reactors and observed that no H2 production occurred during fermentation assays conducted at an initial pH of 5.0. According to the authors, the acidic environment likely promoted the release of undissociated weak acids, which can cross the cell membrane, impair glycolytic enzymatic activity, and cause damage to the cell membrane and DNA (deoxyribonucleic acid). Similarly, Thungklin et al.43 used SCB hydrolysate in fermentation assays for H2 production and reported no H2 generation at an initial pH of 4.5. These findings are consistent with those from experiment A-04, where the combination of high SCB concentration, pentose liquor, and a more acidic initial pH proved detrimental to the fermentative process.
In general, pH is a key parameter for H2 production, as it influences the activity of various cellular enzymes. Specifically, pH affects hydrogenase activity, which is a key enzyme for H2 production.44 Under acidic conditions, organic acids produced during fermentation can remain in their undissociated form and cross the cell membrane, thereby reducing the intracellular pH.45 According to studies conducted in batch reactors, the optimal pH varies depending on the substrate used, for instance, initial pH ≥ 6.5 for xylose,46 5.5 to 5.7 for sucrose26 and ≥ 6.0 for starch.47 For SCB hydrolysate, the optimal pH range for H2 production appears to be between 6.0 and 6.8. Within this range, some of the highest H2 yields were obtained: 126.82 ± 10.46 mL H2 at an initial pH of 6.5; 69.84 ± 3.37 mL H2 at pH 6.5; and 71.34 ± 3.80 mL H2 at pH 6.8. Figure 2 shows the temporal profile of H2 production from the CCRD experiments.
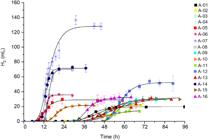
The experimental conditions evaluated in the CCRD matrix (Table 2 and Figure 2) also allow an indirect assessment of the contribution of the individual components of the fermentation medium. Assay A-11, conducted with the lowest pentose liquor concentration (0.4 g COD L-1), represents conditions in which SCB was the predominant carbon substrate. Conversely, assay A-09, performed with the lowest SCB concentration (1.6 g L-1), represents conditions in which pentose liquor was the main soluble substrate available for fermentation. In both cases, H2 production was observed, although at relatively low levels (14.46 and 32.57 mL, respectively), indicating that fermentable substrates present in both fractions can support H2 generation. However, these values were substantially lower than the maximum H2 production obtained under optimized conditions (126.8 mL), where both substrates were present at intermediate concentrations. A possible synergistic interaction between the soluble sugars present in the pentose liquor and the lignocellulosic matrix of SCB may explain the higher H2 production observed when both substrates were present.
Additionally, during the enrichment of the autochthonous consortium, gas monitoring indicated predominantly CO2 production in the absence of external substrates, suggesting negligible H2 formation by the inoculum alone. Yeast extract was included in the medium only as a source of nitrogen, vitamins, and growth factors to support microbial metabolism. In dark fermentation processes, yeast extract is not considered a primary fermentable carbon substrate and is widely used as a nutritional supplement rather than an energy source for hydrogen production.48
Based on the ANOVA presented in Table 3, the obtained model is statistically significant, with an R2 of 93.20%, indicating that 93.20% of the data variation can be explained by the proposed model. R2 values between 91 and 100% indicate a good model fit.
As can be seen in Table 3, the regression was significant, whereby the F-calculated value (20.6) was much higher than the p-value (0.00009), indicating that at least one of the independent variables has a statistically significant effect on the dependent variable. Thus, part of the variation in the responses can be explained by the variables in the regression model. However, the lack of fit was also significant, whereby the F-calculated value (153.1) was higher than the p-value (0.06243). Therefore, the regression model does not fully capture all the patterns found in the data related to the variable P. In contrast, the pure error was very small, with a sum of squares of only 0.7, indicating that the measurements taken are consistent and that the variability in the responses is not due to measurement errors.
The regression model obtained for response P (H2 in mL), presented in Table 4, with a significant level of 10%, includes statistically significant terms. It consists of three linear terms (X1, X2, and X3), one quadratic term (X32), and two interactions (X1.X2 and X2.X3), which correspond to the concentration of SCB (X1), pentose liquor (X2), and pH (X3).
Equation 2 describes the production of H2 (P) as a function of the statistically significant coded variables.
Since the result obtained after the regression model was considered statistically significant, the response surface for P (Figure 3) was evaluated based on Equation 2. The optimal point for each response can be identified by the peak present in the surface plot graphs. Increases in both factors raised both the production and the production rate of H2. The optimized region for P was observed for pentose liquor concentrations between 3 and 5 g COD L-1 and initial pH values of the experiments between 6.0 and 7.0. In this study, the ideal value for the initial pH was within the neutral range, likely because these conditions favored the hydrolysis step during the first hours of the experiments, followed by acidogenesis reactions, without inhibiting the microorganisms involved.49

Response surface (a) and contour plots (b) of the effects of the interaction between pentose liquor and initial pH on H2 production
Validation test of optimized H2 production
For the validation test based on the analysis of RSM with 1.5 g L-1 of SCB, an initial pH of 6.8, and 4.7 g COD L-1 of pentose liquor, the following was obtained: P of 179.43 mL, Rm of 13.87 mL h-1, λ of 4.89 h, and R2 of 0.98 (Figure 4). The main acids produced during the validation test were butyric acid (1,250 mg L-1), acetic acid (840 mg L-1) and lactic acid (425 mg L-1).

Under optimized conditions for H2 production through SCB with a consortium of autochthonous and allochthonous bacteria, Rabelo et al.10 achieved an optimized production of 64.7 mL H2 (23.10 mmol H2 L-1) using 7.0 g L-1 of SCB, an initial pH of 7.2, and a temperature of 37 °C. Soares et al.50 observed optimized H2 production (198.24 mL H2) using SCB as a substrate with optimized yeast extract concentration (3.0 g L-1) and temperature (60 °C) by CCRD. Using the effluent from coffee processing (30 g COD L-1) and coffee husk residues (7 g L-1) at an initial pH of 7.0 and a temperature of 30 °C, Montoya et al.15 achieved optimized hydrogen production of 240 mL H2. When studying the optimization of H2 production from citrus fruit peel residues (16 g TVS L-1, where TVS: total volatile solids) and citrus fruit processing effluent (2.0 g COD L-1) at an initial pH of 7.0 and a temperature of 37 °C, Rocha et al.51 achieved optimized hydrogen production of 117.5 mL H2. Using a consortium of autochthonous bacteria from banana peel residues, Mazareli et al.36 observed the optimal conditions (initial pH of 7.0 and 37 °C) for optimized H2 production of 70.19 mL. The data obtained from the optimized H2 production in the present study were comparable to some results from the literature using various lignocellulosic residues (Table 5).
Comparison of optimized H2 production from sugarcane bagasse (SCB) and pentose liquor with H2 production from other lignocellulosic substrates
Upon analyzing the data from Table 5, the success of using autochthonous microorganisms present in SCB for the conversion of SCB and pentose liquor into H2 is evident. This positive result can be attributed to the microbial synergy between different populations, which facilitates the efficient degradation of complex substrates. Furthermore, using consortia, instead of pure cultures, can be an advantageous alternative, as it eliminates the need for specific media, thereby reducing costs.
Utilization of total carbohydrates
The conversion of total carbohydrates in the CCRD experiments ranged from 28% (A-03) to 73% (A-05) (Figure 5), with an initial average total carbohydrate concentration of 1.89 g L-1. For the experiments with an initial pH ≥ 6.5 (A-05 to A-08), the average carbohydrate conversion was 67.8%, with an average P value of 66.49 mL H2. For experiments with an initial pH of 6.0 (A-09, A-10, A-11, A-12, A-15, and A-16), the average carbohydrate conversion was 53.5%, while the P value was 30.53 mL H2. For conditions with an initial pH ≤ 5.5 (A-01, A-02, A-03, A-04, and A-13), the average carbohydrate conversion was 49%, which is 27% lower than that observed for experiments with an initial pH of 6.5. The adverse impact of acidic pH on carbohydrate consumption was also observed by Zhou et al.54 during glucose fermentation (20 g L-1) in batch reactors at 37 °C, using inoculum from a wastewater treatment plant. The authors highlighted the inhibition of fermentative bacteria as the pH decreased. However, carbohydrate conversion was observed at an initial pH between 4.82 and 8.18, suggesting the presence of microorganisms in the microbial community tolerant to both acidic and alkaline pH. Under these conditions, the consumed carbohydrates were primarily converted into hydrogen and soluble fermentation metabolites, mainly organic acids such as butyric, acetic, and lactic acids. In the present study, the highest carbohydrate conversion (76%) was observed at a pH close to neutral (6.5) in experiment A-07, which was concomitant with the highest P value (126.82 ± 10.46 mL H2).

Carbohydrate concentration at the beginning and at the end, and carbohydrate utilization in the experiments
The conversion of total carbohydrates under the optimized H2 production conditions was even more significant, reaching 83%, which was also related to the higher P value (179.43 mL H2). A similar value was observed by Lee et al.,55 who analyzed H2 production with cassava starch as substrate in batch reactors. In their study, with 16 g COD L-1 of substrate, an initial pH of 6.5, and a temperature of 37 °C, the authors reported a P value of 1.441 mL H2, with a conversion of 84% of total carbohydrates.
Production of volatile organic acids
Concomitant with H2 production, organic acids were observed in all assays, ranging from 725 mg L-1 in A-11 to 2,343 mg L-1 in A-12. The main organic acids observed were butyric acid (10.64% in A-13 to 53.16% in A-11), acetic acid (14.58% in A-04 to 30.81% in A-16), lactic acid (6.38% in A-05 to 34.72% in A-13), and propionic acid (9.01% in A-06 to 49.54% in A-4) as shown in Figure 6. The diversity of autochthonous bacterial populations from the substrates may have led to diverse metabolic capabilities.56

As shown in Figure 6, the main intermediates formed at the end of the CCRD experiments were butyric acid (HBu) and acetic acid (HAc). The optimal range for the HBu/HAc ratio for H2 production is between 0.4 and 2.1.57,58 In this study, the HBu/HAc ratio ranged from 0.52 (A-13) to 2.61 (A-14). The highest ratios between these two acids were observed in experiments A-14 with 2.61 and A-07 with 2.17, where the highest H2 productions also occurred, with P values of 71.34 mL H2 and 126.82 mL H2, respectively. Matyakubov et al.59 also found that the HBu/HAc ratio has a significant correlation with H2 yield. Therefore, the HBu/HAc ratio can be used to analyze metabolic pathways during H2 fermentation and serves as an indicator to evaluate the effectiveness of H2 production in studies using lignocellulosic biomass residues.60,61
HBu was the most abundant soluble metabolite in the CCRD experiments. Theoretically, 2 moles of H2 are produced from 1 mole of glucose via the butyrate pathway (Equation 3). The highest proportion of this acid occurred in assays A-05 (47.11%, 361 mg L-1), A 06 (48.36%, 516 mg L-1), A-07 (44.43%, 859 mg L-1), and A 14 (45.74%, 543 mg L-1) at an initial pH ≥ 6.0. Mazareli et al.36 also reported an increase in the final concentrations of HBu in experiments with an initial pH ≥ 6.50, using banana peel residues for H2 production.
Acetic acid (HAc) was the second most abundant organic acid observed in the CCRD experiments. Through the HAc pathway, 4 moles of H2 are produced from 1 mole of glucose (Equation 4). The highest concentration of this acid was observed in experiments A-16 (30.8%, 542 mg L-1) and A-06 (29.3%, 312 mg L-1). The results of this research are consistent with those of other authors, such as Baêta e al.62 (producing 1,013 mg L-1 of HAc). Fangkum and Reungsang63 (producing 930 mg L-1 of HAc) and Pattra et al.42 (producing 500 mg L-1 of HAc), who worked with SCB hydrolysate, found that the main metabolic pathways used for biological H2 production were butyric and acetic. Additionally, Fuess et al.,64 using vinasse as a substrate, observed that experiments with the highest H2 production were also associated with high concentrations of HAc and HBu, with values ranging from 1,000 to 1,500 mg L-1 and 1,000 to 1,900 mg L-1, respectively.
Lactic acid (HLa) was the third most abundant soluble metabolite observed in the experimental design assays. The highest concentrations of this acid occurred in experiments A-13 (34.7%, 511 mg L-1) and A-03 (21.5%, 391 mg L-1). The lowest concentrations of this acid occurred in experiments A-05 (6.4%, 49 mg L-1) and A-11 (8.3%, 60 mg L-1), both at an initial pH ≥ 6.0. No clear relationship could be established between H2 production and lactic acid concentrations, as in both the experiment with no H2 production (A-04) and the experiment with the highest H2 production (A-07), the concentrations of lactic acid were similar.
It is assumed that lactic acid fermentation may have played a dual role, influencing both H2-producing and non-H2-producing pathways. In dark fermentation systems, lactate formation may occur when reducing equivalents (nicotinamide adenine dinucleotide hydride (NADH)) are redirected toward lactate dehydrogenase instead of hydrogenase activity, resulting in a metabolic shift that competes with hydrogen production. Under certain conditions, however, lactate may also serve as an intermediate substrate that can be further converted into acetate and butyrate by other microorganisms, potentially contributing to hydrogen formation in syntrophic interactions within the microbial community. Similar results were found by Fuess et al.,64 who also observed that in vinasse fermentation, both lactic acid pathways, H2-producing and non-H2-producing, were present. Comparable metabolic interactions have also been described in mixed-culture dark fermentation systems, where lactate accumulation reflects shifts in electron flow and microbial competition within the consortium.65
However, the conversion of lactic acid into propionic and acetic acids can also occur without the production of hydrogen. Clostridium propionicum is one of the species capable of such conversion (Equation 5). In this case, glucose can be initially converted into lactic acid and ultimately into propionic and acetic acids, following several alternative pathways without producing any hydrogen.66
Regarding propionic acid (HPr), it was observed that its highest production occurred in experiments A-04 (49.5%, 793 mg L-1) and A-02 (27.9%, 389 mg L-1), both with an initial pH of 5.50. However, another study67 reported that a more acidic initial pH was favorable for establishing the propionic pathway. Moreover, this organic acid is not favorable for H2 production, as the pathway for acid production also involves H2 consumption (Equation 6), implying that propionic acid production should be avoided. Furthermore, the limiting substrate for butyric acid production is glucose, while for propionic acid production, it is hydrogen.68
Optimization of HBu production by CCRD
The regression model obtained for the HBu response with a significance level of 10% (Table 6) includes statistically significant terms comprising three linear terms (X1, X2, and X3), three quadratic terms (X12, X22, and X32), and two interactions between them (X1X2 and X2X3), referring to the concentration of SCB (X1), pentose liquor (X2), and pH (X3). The interaction between X1 and X3 was not statistically significant, as the p-value was 0.1338.
Significance values for the 10% confidence interval of the butyric acid production responses
Equation 8 describes the HBu regression as a function of the coded variables in statistically significant terms.
According to Table 7 (ANOVA), the regression model is statistically significant, as the p-value > F-calculated. According to R2, 96.10% of the total variation in the data can be explained by the model.
Based on Figure 7, it can be observed that the conditions resulting in the highest HBu concentration were those where the pentose liquor concentration was above 4.0 g L-1 and the pH was above 6.6. Furthermore, the highest HBu production was observed in the same range of highest H2 production, with pH ≥ 6.4 and pentose liquor between 3.5 and 5 g COD L-1.

Response surface (a) and contour curves (b) of the effects of the interaction between pentose liquor and initial pH on HBu production
Thus, the HBu conditions can be validated based on those optimized for H2, as both productions show compatibility in concentration and pH ranges, suggesting that the optimal H2 conditions could also favor the production of HBu with higher concentrations of sugarcane hydrolysate and a pH above 6.56,69,70
Potential inhibitory compounds in H2 production
Although pretreatment is used to disrupt the fibers of lignocellulosic materials, it is common to observe the simultaneous release of inhibitory by-products, such as furfural and 5-hydroxymethylfurfural (5 HMF), as well as compounds derived from lignin, such as vanillin, syringaldehyde, and phenols.71,72 The accumulation of these toxic by-products can lead to a significant reduction in H2 production, as they inhibit microbial activity, whether with pure microbial cultures or consortia.73-75
For all the CCRD experiments, the concentrations of furfural, 5-HMF, phenols, HAc, and formic acid (HFo) were evaluated in the initial and final samples of the experiments (Figure 8).

Low concentrations of 5-HMF were observed, below 72 mg L-1, with an average final concentration of 16 mg L-1. Anburajan et al.76 observed that 5-HMF concentrations up to 600 mg L-1 did not affect H2 production. In the present study, the average removal of 5-HMF in the CCRD experiments was 56%, higher than the 45% observed by Cheng et al.77 in water hyacinth hydrolysate used as a substrate for H2 production in batch reactors. Complete removal of 5-HMF occurred in experiments A-01, A-02, and A-05, while the lowest removal was observed in A-14, with 33% (from 42 to 28 mg L-1). Low concentrations of 5-HMF (22 mg L-1) were also reported by Soares et al.50 who stated that this concentration did not inhibit H2 production from SCB hydrolysate.
Regarding furfural, the initial concentrations were below 152 mg L-1, with an average initial concentration of 70 mg L-1, and the average final concentration was 22 mg L-1. Furfural is a product originating from the degradation of pentoses, while 5-HMF results from the degradation of hexoses. Due to these different formation pathways, the concentration of furfural in hemicellulosic hydrolysates tends to be higher than that of 5-HMF. This difference is mainly associated with the pentose-rich composition of hemicellulose, whose dehydration during hydrothermal pretreatment preferentially forms furfural, whereas hexoses from cellulose generate 5-HMF.7 In the CCRD experiments, the average conversion rate of furfural was 65%, with complete removal occurring in experiments A-06 and A-14. In contrast, in experiment A-04, the lowest removal was observed, with only a 20% reduction, from 118 to 94 mg L-1. Furthermore, no H2 production occurred in this experiment. Baêta et al.,62 for example, observed an average furfural removal of 86% from SCB hydrolysate for H2 production.
Regarding phenols, the highest initial value was observed in experiment A-07, with 352 mg L-1, while the lowest final concentration of phenols was recorded in experiment A-11, with 40 mg L-1. In this study, no negative effect of phenols on H2 production was identified, as the experiment with the highest total phenol concentration (A 07) showed the highest H2 production (126.82 ± 10.46 mL of H2). Previous studies, such as the one by Kumar et al.,78 have reported that total phenol concentrations equal to or greater than 600 mg L-1 tend to inhibit H2 production.
To examine potential relationships between inhibitor compounds and fermentative performance, a principal component analysis (PCA) was conducted using H2 production, inhibitor concentrations (5-HMF, furfural, and phenols), organic acids production, and carbohydrate utilization as variables (Figure 9). The first two principal components accounted for 77.4% of the total variance, providing an adequate representation of the experimental dataset. The first component (PC1, 50.17%) was mainly associated with the occurrence of inhibitor compounds and organic acids, whereas the second component (PC2, 27.23%) corresponded primarily to variables related to fermentative activity, particularly H2 production and carbohydrate utilization.

PCA biplot of inhibitor compounds, carbohydrate utilization, organic acids (org. acids), and H2 production in the CCRD experiments
Within the ordination space defined by PC1 and PC2, H2 production was located in proximity to carbohydrate utilization, consistent with the dependence of fermentative H2 generation on substrate conversion. In contrast, furfural and phenolic compounds occupied the opposite region of the biplot, reflecting conditions under which higher concentrations of these compounds coincided with reduced hydrogen production. Experiments A07, A08, and A14, which exhibited the highest H2 production (126.82, 69.84 and 71.34 mL, respectively), were positioned closer to the region characterized by greater carbohydrate utilization, whereas experiments located near the vectors representing furfural and phenols corresponded to lower fermentative performance.
Organic acids were primarily aligned with PC1, indicating that their accumulation reflects overall metabolic activity of the microbial consortium rather than a direct association with H2 production. Taken together, the multivariate structure of the dataset highlights the central role of substrate utilization in supporting H2 formation, while variations in inhibitor concentrations contribute to shifts in fermentative performance across the experimental conditions.
CONCLUSIONS
H2 and volatile organic acids production were obtained from the co-fermentation of SCB and pentose liquor using an autochthonous inoculum. According to the statistical optimization, the ideal conditions for H2 production (179.43 mL) were 1.5 g SCB L-1, 4.7 g COD L-1 of pentose liquor, and an initial pH of 6.8, accompanied by the production of acetic acid (840 mg L-1) and butyric acid (1,250 mg L-1), characterizing a butyric fermentation, resulting from the conversion of 83% of the total carbohydrates. The weak acids and furans, both derived from pentose liquor, did not significantly affect H2 production, which reinforces the feasibility of using pentose liquor as a co-substrate for the sustainable production of H2.
ACKNOWLEDGMENTS
The research was supported by CAPES (grant number 88887.081729/2024 00) and FAPESP (grant number 2022/10615-1).
DATA AVAILABILITY STATEMENT
All data generated or analyzed during this study are included in this published article.
REFERENCES
- 1 Lovato, G.; Ferreira, C. M.; Amui, M. M.; Silva, E. L. In Handbook of Waste Biorefinery: Circular Economy of Renewable Energy; Jacob Lopes, E.; Zepka, L. Q.; Deprá, M. C., eds.; Springer: Cham, 2022.
-
2 Dominski, F. H.; Branco, J. H. L.; Buonanno, G.; Stabile, L.; da Silva, M. G.; Andrade, A.; Environ. Res. 2021, 201, 111487. [Crossref]
» Crossref -
3 Portal de Informações Agropecuárias; Companhia Nacional de Abastecimento. [Link] acesssed in March 2026
» Link -
4 Micheal, A.; Moussa, R. R.; Ain Shams Engineering Journal 2021, 12, 3297. [Crossref]
» Crossref -
5 Alokika; Anu; Kumar, A.; Kumar, V.; Singh, B.; Int. J. Biol. Macromol. 2021, 169, 564. [Crossref]
» Crossref -
6 Areeya, S.; Panakkal, E. J.; Kunmanee, P.; Tawai, A.; Amornraksa, S.; Sriariyanun, M.; Kaoloun, A.; Hartini, N.; Cheng, Y.-S.; Kchaou, M.; Dasari, S.; Gundupalli, M. P.; Applied Science and Engineering Progress 2024, 17, 7402. [Crossref]
» Crossref -
7 Ahmad, F.; Sakamoto, I. K.; Adorno, M. A. T.; Motteran, F.; Silva, E. L.; Varesche, M. B. A.; Waste Biomass Valorization 2020, 11, 31. [Crossref]
» Crossref -
8 Baumann, I.; Westermann, P.; BioMed Res. Int. 2016, 2016, 8469357. [Crossref]
» Crossref -
9 Camargo, F. P.; Rabelo, C. A. B. S.; Duarte, I. C. S.; Silva, E. L.; Varesche, M. B. A.; Int. J. Hydrogen Energy 2023, 48, 20613. [Crossref]
» Crossref -
10 Rabelo, C. A. B. S.; Soares, L. A.; Sakamoto, I. K.; Silva, E. L.; Varesche, M. B. A.; J. Environ. Manage. 2018, 223, 952. [Crossref]
» Crossref -
11 Ratti, R. P.; Delforno, T. P.; Sakamoto, I. K.; Varesche, M. B. A.; Int. J. Hydrogen Energy 2015, 40, 6296. [Crossref]
» Crossref -
12 Infanzón-Rodríguez, M. I.; Ragazzo-Sánchez, J. A.; del Moral, S.; Calderón-Santoyo, M.; Gutiérrez-Rivera, B.; Aguilar-Uscanga, M. G.; Sugar Tech 2020, 22, 266. [Crossref]
» Crossref -
13 Ahmed, P. M.; Pajot, H. F.; de Figueroa, L. I. C.; Gusils, C. H.; J. Environ. Chem. Eng. 2018, 6, 5177. [Crossref]
» Crossref -
14 Gomes, M. M.; Sakamoto, I. K.; Rabelo, C. A. B. S.; Silva, E. L.; Varesche, M. B. A.; J. Environ. Manage. 2021, 288, 112363. [Crossref]
» Crossref -
15 Montoya, A. C. V.; Mazareli, R. C. S.; Delforno, T. P.; Centurion, V. B.; de Oliveira, V. M.; Silva, E. L.; Varesche, M. B. A.; Int. J. Hydrogen Energy 2020, 45, 4205. [Crossref]
» Crossref -
16 Fermoso, J.; Gil, M. V.; Arias, B.; Plaza, M. G.; Pevida, C.; Pis, J. J.; Rubiera, F.; Int. J. Hydrogen Energy 2010, 35, 1191. [Crossref]
» Crossref -
17 Rocha, D. H. D.; Sakamoto, I. K.; Varesche, M. B. A.; J. Environ. Chem. Eng. 2023, 11, 111252. [Crossref]
» Crossref -
18 Soares, L. A.; Rabelo, C. A. B. S.; Sakamoto, I. K.; Delforno, T. P.; Silva, E. L.; Varesche, M. B. A.; Biomass Bioenergy 2018, 117, 78. [Crossref]
» Crossref -
19 Lopez-Hidalgo, A. M.; Sánchez, A.; De León-Rodríguez, A.; Fuel 2017, 188, 19. [Crossref]
» Crossref -
20 Ribeiro, A. R.; Silva, E. L.; J. Environ. Manage. 2022, 323, 116308. [Crossref]
» Crossref -
21 Soares, J. F.; Mayer, F. D.; Mazutti, M. A.; Int. J. Hydrogen Energy 2024, 52, 352. [Crossref]
» Crossref -
22 Chatterjee, S.; Mohan, S. V.; Chem. Eng. J. 2021, 425, 130386. [Crossref]
» Crossref - 23 Hames, B.; Ruiz, R.; Scarlata, C.; Sluiter, A.; Sluiter, J.; Templeton, D.; Preparation of Samples for Compositional Analysis; NREL: Golden, 2008.
-
24 Moura, A. G. L.; Rabelo, C. A. B. S.; Okino, C. H.; Maintinguer, S. I.; Silva, E. L.; Varesche, M. B. A.; Int. J. Hydrogen Energy 2020, 45, 28447. [Crossref]
» Crossref - 25 Ceccato-Antonini, S. R.; Codato, C. B.; Martini, C.; Bastos, R. G.; Tauk-Tornisielo, S. M. In Advances of Basic Science for Second Generation Bioethanol from Sugarcane; Buckeridge, M. S.; Souza, A. P., eds.; Springer International Publishing: Cham, 2017, ch. 8.
-
26 Wang, G.; Mu, Y.; Yu, H.-Q.; Biochem. Eng. J. 2005, 23, 175. [Crossref]
» Crossref - 27 American Public Health Association (APHA); Standard Methods for the Examination of Water and Wastewater, 20th ed.; APHA: Washington, D.C., 2017.
-
28 DuBois, M.; Gilles, K. A.; Hamilton, J. K.; Rebers, P. A.; Smith, F.; Anal. Chem. 1956, 28, 350. [Crossref]
» Crossref -
29 Penteado, E. D.; Lazaro, C. Z.; Sakamoto, I. K.; Zaiat, M.; Int. J. Hydrogen Energy 2013, 38, 6137. [Crossref]
» Crossref -
30 Buchanan, I. D.; Nicell, J. A.; Biotechnol. Bioeng. 1997, 54, 251. [Crossref]
» Crossref -
31 Araujo, M. N.; Vargas, S. R.; Soares, L. A.; Trindade, L. F.; Fuess, L. T.; Adorno, M. A. T.; Int. J. Environ. Anal. Chem. 2024, 104, 8690. [Crossref]
» Crossref -
32 Zwietering, M. H.; Jongenburger, I.; Rombouts, F. M.; van’t Riet, K.; Appl. Environ. Microbiol. 1990, 56, 1875. [Crossref]
» Crossref -
33 Camargo, F. P.; Sakamoto, I. K.; Delforno, T. P.; Mariadassou, M.; Loux, V.; Midoux, C.; Duarte, I. C. S.; Silva, E. L.; Bize, A.; Varesche, M. B. A.; J. Environ. Manage. 2021, 291, 112631. [Crossref]
» Crossref -
34 Regueira-Marcos, L.; García-Depraect, O.; Muñoz, R.; Fuel 2023, 338, 127238. [Crossref]
» Crossref -
35 Balakrishnan, D.; Manmai, N.; Ponnambalam, S.; Unpaprom, Y.; Chaichompoo, C.; Ramaraj, R.; Int. J. Hydrogen Energy 2023, 48, 21152. [Crossref]
» Crossref -
36 Mazareli, R. C. S.; Montoya, A. C. V.; Delforno, T. P.; Centurion, V. B.; de Oliveira, V. M.; Silva, E. L.; Varesche, M. B. A.; Int. J. Hydrogen Energy 2021, 46, 8454. [Crossref]
» Crossref -
37 Chairattanamanokorn, P.; Penthamkeerati, P.; Reungsang, A.; Lo, Y. C.; Lu, W.-B.; Chang, J.-S.; Int. J. Hydrogen Energy 2009, 34, 7612. [Crossref]
» Crossref -
38 Eker, S.; Sarp, M.; Int. J. Hydrogen Energy 2017, 42, 2562. [Crossref]
» Crossref -
39 Saratale, G. D.; Saratale, R. G.; Kim, S. H.; Kumar, G.; Int. J. Hydrogen Energy 2018, 43, 11470. [Crossref]
» Crossref -
40 Cazier, E. A.; Trably, E.; Steyer, J. P.; Escudie, R.; Bioresour. Technol. 2015, 190, 106. [Crossref]
» Crossref -
41 Saha, B.; Arshad, N.; Sriariyanun, M.; Rodiahwati, W.; Gundupalli, M. P.; Applied Science and Engineering Progress 2025, 18, 7895. [Crossref]
» Crossref -
42 Pattra, S.; Sangyoka, S.; Boonmee, M.; Reungsang, A.; Int. J. Hydrogen Energy 2008, 33, 5256. [Crossref]
» Crossref -
43 Thungklin, P.; Sittijunda, S.; Reungsang, A.; Int. J. Hydrogen Energy 2018, 43, 9924. [Crossref]
» Crossref -
44 Zhang, M.-L.; Fan, Y.-T.; Xing, Y.; Pan, C.-M.; Zhang, G.-S.; Lay, J.-J.; Biomass Bioenergy 2007, 31, 250. [Crossref]
» Crossref -
45 Van Ginkel, S.; Logan, B. E.; Environ. Sci. Technol. 2005, 39, 9351. [Crossref]
» Crossref -
46 Lin, C.-Y.; Cheng, C.-H.; Int. J. Hydrogen Energy 2006, 31, 832. [Crossref]
» Crossref -
47 Zhang, T.; Liu, H.; Fang, H. H. P.; J. Environ. Manage. 2003, 69, 149. [Crossref]
» Crossref -
48 Zhang, L.; Ban, Q.; Li, J.; Xu, Y.; Int. J. Agric. Biol. 2014, 16, 1189. [Link] accessed in March 2026
» Link -
49 de Sá, L. R. V.; Cammarota, M. C.; Ferreira-Leitão, V. S.; Quim. Nova 2014, 37, 857. [Crossref]
» Crossref -
50 Soares, L. A.; Braga, J. K.; Motteran, F.; Sakamoto, I. K.; Silva, E. L.; Varesche, M. B. A.; Water Sci. Technol. 2017, 76, 95. [Crossref]
» Crossref -
51 Rocha, D. H. D.; Sakamoto, I. K.; Varesche, M. B. A.; Int. J. Hydrogen Energy 2024, 53, 364. [Crossref]
» Crossref -
52 Sattar, A.; Arslan, C.; Ji, C.; Sattar, S.; Umair, M.; Sattar, S.; Bakht, M. Z.; Int. J. Hydrogen Energy 2016, 41, 11050. [Crossref]
» Crossref -
53 Camargo, F. P.; Sakamoto, I. K.; Duarte, I. C. S.; Varesche, M. B. A.; Int. J. Hydrogen Energy 2019, 44, 22888. [Crossref]
» Crossref -
54 Zhou, M.; Yan, B.; Wong, J. W. C.; Zhang, Y.; Bioresour. Technol. 2018, 248, 68. [Crossref]
» Crossref -
55 Lee, K.-S.; Hsu, Y.-F.; Lo, Y.-C.; Lin, P.-J.; Lin, C.-Y.; Chang, J.-S.; Int. J. Hydrogen Energy 2008, 33, 1565. [Crossref]
» Crossref -
56 Wei, D.; Liu, X.; Yang, S.-T.; Bioresour. Technol. 2013, 129, 553. [Crossref]
» Crossref -
57 Zahedi, S.; Sales, D.; Romero, L. I.; Solera, R.; Bioresour. Technol. 2013, 129, 85. [Crossref]
» Crossref -
58 Angeriz-Campoy, R.; Álvarez-Gallego, C. J.; Romero-García, L. I.; Bioresour. Technol. 2015, 194, 291. [Crossref]
» Crossref -
59 Matyakubov, B.; Hwang, Y.; Lee, T.-J.; Int. J. Hydrogen Energy 2022, 47, 31223. [Crossref]
» Crossref -
60 Sillero, L.; Solera, R.; Perez, M.; Int. J. Hydrogen Energy 2022, 47, 3667. [Crossref]
» Crossref -
61 Wadjeam, P.; Reungsang, A.; Imai, T.; Plangklang, P.; Int. J. Hydrogen Energy 2019, 44, 14694. [Crossref]
» Crossref -
62 Baêta, B. E. L.; Lima, D. R. S.; Balena Filho, J. G.; Adarme, O. F. H.; Gurgel, L. V. A.; de Aquino, S. F.; Bioresour. Technol. 2016, 218, 436. [Crossref]
» Crossref -
63 Fangkum, A.; Reungsang, A.; Int. J. Hydrogen Energy 2011, 36, 8687. [Crossref]
» Crossref -
64 Fuess, L. T.; Ferraz Júnior, A. D. N.; Machado, C. B.; Zaiat, M.; Bioresour. Technol. 2018, 247, 426. [Crossref]
» Crossref -
65 Villanueva-Galindo, E.; Pérez-Rangel, M.; Moreno-Andrade, I.; Int. J. Hydrogen Energy 2025, 108, 2. [Crossref]
» Crossref -
66 Baghchehsaraee, B.; Nakhla, G.; Karamanev, D.; Margaritis, A.; Int. J. Hydrogen Energy 2009, 34, 2573. [Crossref]
» Crossref -
67 Dareioti, M. A.; Vavouraki, A. I.; Kornaros, M.; Bioresour. Technol. 2014, 162, 218. [Crossref]
» Crossref -
68 Eş, I.; Khaneghah, A. M.; Hashemi, S. M. B.; Koubaa, M.; Biotechnol. Lett. 2017, 39, 635. [Crossref]
» Crossref -
69 Kelbert, M.; Machado, T. O.; Araújo, P. H. H.; Sayer, C.; de Oliveira, D.; Maziero, P.; Simons, K. E.; Carciofi, B. A. M.; Renewable Sustainable Energy Rev. 2024, 202, 114717. [Crossref]
» Crossref -
70 de Sá, L. R. V.; Faber, M. O.; da Silva, A. S.; Cammarota, M. C.; Ferreira-Leitão, V. S.; Renewable Energy 2020, 146, 2408. [Crossref]
» Crossref -
71 Giraldeli, L. D.; Fonseca, B. C.; Reginatto, V.; Int. J. Hydrogen Energy 2018, 43, 22159. [Crossref]
» Crossref -
72 Monlau, F.; Barakat, A.; Trably, E.; Dumas, C.; Steyer, J.-P.; Carrère, H.; Crit. Rev. Environ. Sci. Technol. 2013, 43, 260. [Crossref]
» Crossref -
73 Akobi, C.; Hafez, H.; Nakhla, G.; Bioresour. Technol. 2016, 221, 598. [Crossref]
» Crossref -
74 Gonzales, R. R.; Sivagurunathan, P.; Parthiban, A.; Kim, S.-H.; Int. Biodeterior. Biodegrad. 2016, 113, 22. [Crossref]
» Crossref -
75 Muñoz-Páez, K. M.; Alvarado-Michi, E. L.; Buitrón, G.; Valdez Vazquez, I.; Int. J. Hydrogen Energy 2019, 44, 2289. [Crossref]
» Crossref -
76 Anburajan, P.; Pugazhendhi, A.; Park, J.-H.; Sivagurunathan, P.; Kumar, G.; Kim, S.-H.; Bioresour. Technol. 2018, 247, 1197. [Crossref]
» Crossref -
77 Cheng, J.; Lin, R.; Song, W.; Xia, A.; Zhou, J.; Cen, K.; Int. J. Hydrogen Energy 2015, 40, 2545. [Crossref]
» Crossref -
78 Kumar, S.; Indugu, N.; Vecchiarelli, B.; Pitta, D. W.; Front. Microbiol. 2015, 6, 781. [Crossref]
» Crossref
Edited by
-
Associate Editor handled this article:
Eduardo M. Richter