 DIGITAL IMAGE PROCESSING AND MACHINE LEARNING AS AN ENHANCEMENT OF THE SCOTT TEST
Abstract
The consumption of cocaine represents a significant challenge for public health and safety, given its impact on brain functionality and its direct connection to drug trafficking and the strengthening of organized crime. The Scott test, developed by L. J. Scott Jr. in 1973, offers a practical and rapid alternative for the on-site identification of cocaine, although it has low selectivity regarding the purity of the substance. This study aimed to classify high and medium purity cocaine samples, provided by the Scientific Police, through digital image conversion, utilizing machine learning algorithms: Naive Bayes, support vector machines (SVM), logistic regression, K-nearest neighbors (KNN), decision tree, random forest, and extreme gradient boosting (XGBoost). The results were satisfactory, with most algorithms achieving accuracy values of 90% or higher in classifying the samples, except for Naive Bayes, which showed an accuracy of 86%. The KNN and XGBoost algorithms stood out, achieving performances of 94 and 93%, respectively. The classification models generated by these algorithms proved effective in characterizing seized cocaine samples, providing a valuable tool to guide public policies and enhance police intelligence through the monitoring of these substances.
Keywords:
cocaine; algorithms; forensic chemistry; RGB color space; classification model.
INTRODUCTION
The use of psychoactive substances dates back to pre-Columbian civilizations, which, more than 4,500 years ago, already used the leaves of the plant commonly known as coca.1 Cocaine is an alkaloid extracted from the leaves of various plants of the genus Erythroxylum, native to South America, with the most well-known being Erythroxylum coca, found in regions of Bolivia and Peru. Within this species, there are some variations, such as Erythroxylum coca var. novogranatense, found in Colombia, and Erythroxylum coca var. ipadu, native to the Brazilian Amazon.1
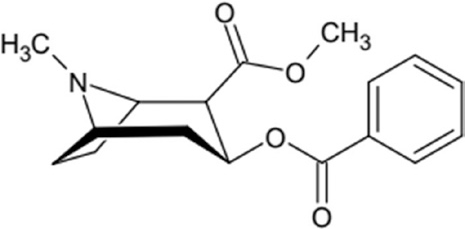
Cocaine is commonly sold in the form of cocaine hydrochloride, a white, crystalline powder obtained by the acid treatment of coca paste. This initial stage of the process involves pressing coca leaves with sulfuric acid, kerosene, or gasoline, resulting in a paste that can be converted into cocaine or crack. Usually, cocaine is administered intranasally, orally, or intravenously. The residue from refining cocaine salts with sodium carbonate forms its freebase structure1 (Figure 1), commonly known as crack, which has a low volatilization point, approximately 95 °C, and when heated, its vapors can be inhaled.
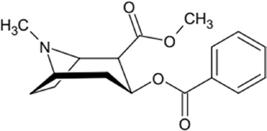
The amine group present in its structure makes it highly nucleophilic. Upon contact with a strong acid, the amine group can easily be protonated, resulting in its salt form, which is structurally more stable.3
With the primary goal of increasing their profits, cocaine manufacturers add substances to the drug that act as diluents and adulterants, intending to make the product less pure and consequently increase its volume. The diluents serve solely to add bulk to the drug, without directly affecting its psychotropic effects. On the other hand, adulterants are pharmacological substances, typically similar to the drug, which function to enhance, mimic, or produce new effects in the body.3 Phenacetin, lidocaine, and caffeine are examples of the most commonly used adulterants in cocaine.4
The consumption of cocaine has become a public health and safety issue, as the drug severely affects brain functionality,5 and public safety, due to its direct connection with drug trafficking and the strengthening of organized crime.6 The most recent World Drug Reports 2023,6 an annual report promoted by the United Nations Office on Drugs and Crime (UNODC), indicates that Latin America leads the ranking of regions that sell the most cocaine in the world. In this context, within the ranking of countries that traded the most cocaine in 2023, Brazil occupies the 7th position.6
Additionally, cocaine consumption has significant impacts on public safety, mainly due to its association with criminal activities and the broader social effects of drug abuse. Cocaine use is closely linked to an increase in crimes such as drug trafficking, violent offenses, and property crimes. The high demand for cocaine fuels illegal markets, contributing to organized crime and violent conflicts between traffickers. Furthermore, individuals under the influence of cocaine may exhibit erratic behavior, increased aggression, and impaired decision-making, leading to incidents of violence and risky behavior in public. The stimulant effects of cocaine can also cause physical harm, such as heart attacks or strokes, placing a burden on emergency services and healthcare systems. Overdose deaths involving cocaine, often mixed with other dangerous substances like fentanyl, have been rising, representing a growing concern for public health.6
With the increased efforts to combat drug trafficking and the growing number of seizures conducted by law enforcement, forensic chemistry (FC) plays a crucial role in the success of these operations. Forensic chemistry is the primary method for identifying any types of drugs, as well as their adulterants, allowing for a detailed characterization that results in the formation of a chemical profile of the seized substances.7 In addition to the chemical profile of drugs, the techniques employed by forensic chemistry can also be used to identify trafficking routes, and to analyze the relationships between suppliers, traffickers, and users.
In drug seizure operations, law enforcement agencies require portable and easy-to-use equipment to meet the demands of these actions. In the initial phase, the identification of drugs such as marijuana and cocaine can be carried out using simple screening methods, such as colorimetric tests.
Colorimetric tests, or color tests, are rapid tests that involve adding one or more chemical reagents to an unknown sample. The goal is to observe any change in the color of the suspected material, and the appearance of a specific color may indicate the presence of a drug.8 Since more than one compound can produce the same result, color tests are not very specific and often do not allow for the conclusive identification of a substance. However, colorimetric tests are an effective tool for preliminary analyses, helping to define the next course of action. Due to their simplicity and practicality, color tests are widely used by law enforcement as an initial analysis to examine materials suspected of containing illicit substances.
The Scott test, a colorimetric test developed by L. J. Scott Jr. in 1973, is an analytical chemical method for the detection of cocaine hydrochloride.9 In the Scott test, a reagent composed of cobalt thiocyanate [Co(SCN)2], when it comes into contact with the suspected sample (which may contain cocaine or amine drugs such as promethazine, levamisole, lidocaine)3 forms a turquoise blue complex, which confirms a possible positive result.9 The structure of the formed complex is unknown. However, Oguri et al.,8 in 1995, proposed a structure based on experiments, suggesting that the ratio of the reaction product is 2:1, meaning two cocaine molecules to one reagent molecule.
Although widely used by law enforcement, the Scott test has low selectivity, as some substances can also react, compromising the reliability of the results. Tertiary amine groups and ammonium salts, for example, can form complexes with cobalt thiocyanate, leading to false-positive results.10 An alternative to improve the accuracy of these tests is to apply artificial intelligence methodologies, such as machine learning.
Machine learning is a subfield of artificial intelligence. The concept of machine learning can be characterized as a technique that enables the use of vast datasets through algorithms. These algorithms have the ability to learn, without explicit programming, to identify patterns, predict parameter responses, or classify sets of samples.11 In this context, the use of machine learning algorithms can be applied in various fields of knowledge using physicochemical characteristics of samples,10,12,13 spectroscopic or even voltammetric signals, combined with digital image processing.
Machine learning applied to digital image processing is an expanding field that has revolutionized various applications across multiple domains. By analyzing and interpreting digital images, machine learning enables the extraction of data and the execution of complex tasks, such as pattern recognition, object segmentation and classification.14 Algorithms such as Naive Bayes, support vector machines (SVM), logistic regression, K-nearest neighbors (KNN), decision tree, random forest and extreme gradient boosting (XGBoost) are gaining traction in machine learning studies due to their excellent performance and innovations.15-20
The application of machine learning in colorimetric tests for cocaine detection is still an underexplored area, but it shows great development potential, especially considering recent advances. Studies have demonstrated that machine learning algorithms can significantly improve the accuracy and speed of detection by analyzing the color changes produced by chemical reagents in samples from different sources. Recent articles4,21,22 explore the use of artificial neural networks for the interpretation of colorimetric test results. These studies indicate that the integration of machine learning techniques with colorimetric tests can provide an effective tool for law enforcement and public safety in the identification of illicit drugs.
Given these facts, it becomes necessary to develop and/or improve rapid tests that maintain low cost but with greater selectivity. The present work proposes to enhance the Scott test through digital image processing and the application of machine learning algorithms, aiming to correlate the color parameters of the samples with their purity levels. The objective of this work is to select a classification model based on machine learning algorithms with the best performance and apply it to seized cocaine samples, using a smartphone to enable in loco analyses.
EXPERIMENTAL
Preparation of the Scott test
The Scott reagent was prepared by weighing approximately 0.8440 g of potassium thiocyanate, which was transferred to a 10 mL beaker and diluted in a small portion of ultrapure water. Then, approximately 0.5660 g of cobalt(II) nitrate was weighed, and the process was repeated. After dilution, both beakers were poured into a 50 mL volumetric flask, where 25 mL of glycerin was added, and the volume was completed with ultrapure water up to the meniscus. The volumetric flask was shaken by inversion, and the prepared cobalt thiocyanate reagent was transferred to a 50 mL amber bottle.
Obtaining the cocaine samples
The cocaine samples were provided by the Scientific Police of Paraná, Brazil. These samples were seized in different regions of the state and had already been analyzed by the Forensic Chemistry Laboratory of the Scientific Police, headquartered in Curitiba (PR, Brazil), using Raman spectroscopy. Although the exact concentrations of each individual sample could not be disclosed due to forensic confidentiality, the analyses allowed the determination of purity ranges, which were then used to categorize the samples into reference groups of medium, and high purity. It is also important to mention the commitment to confidentiality regarding the information related to the analyzed drug samples. Additionally, an Official Forensic Expert from the Scientific Police was always present during the testing of the samples under custody. This procedure was necessary to ensure the integrity of the forensic evidence.
Sample preparation
For the analyses, 20 suspected samples with varying concentrations of cocaine were selected, classified as high-purity samples (HPS) and medium-purity samples (MPS), according to the data provided by the forensic analysis conducted at the Forensic Chemistry Laboratory of the Scientific Police headquarters in Paraná, Brazil, via Raman spectroscopy. Five milligrams of each sample were weighed and transferred to capped test tubes (4 mL). A volume of 0.5 mL of cobalt(II) thiocyanate reagent and 1 mL of chloroform were added to the tubes containing the cocaine samples. The tubes were then capped and manually shaken to homogenize the solution before phase separation. After phase separation, 200 µL of the organic phase were pipetted and transferred to a Kasvi® quartz cuvette with a capacity of 3.5 mL, followed by the addition of 2 mL of chloroform.16 The samples were then subjected to photographic recording.
Image acquisition
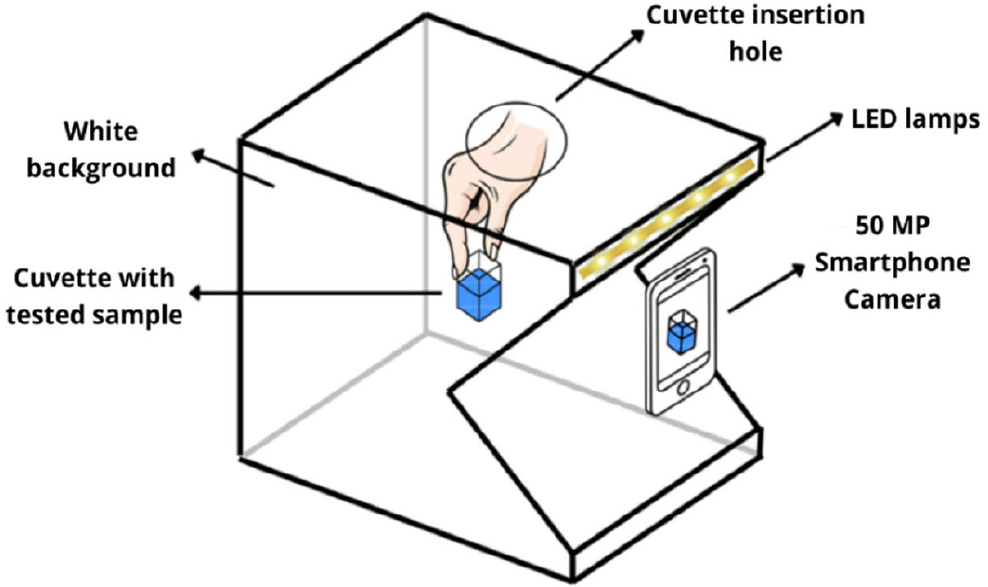
Five photographic captures of each sample were taken using a Motorola® G53 smartphone with a 50-megapixel (MP) camera and under standard conditions (no zoom, flash, or image adjustments), fixed on a tripod at a distance of 20 cm from the tested sample. The gridlines were always used to ensure proper framing of the samples, in a portable photo studio with light-emitting diode (LED) lighting, measuring 68 cm in height, 90 cm in width, and 63 cm in length. The samples were manually inserted through an opening located at the top of the studio (Figure 2).
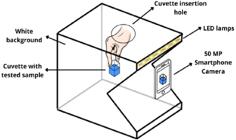
Illustration of the photo studio used for capturing images of cocaine samples subjected to the Scott test
Image cropping
The image cropping was done using GIMP® (GNU Image Manipulation Program), version 2.10.36.23 From each of the 20 samples, five crops were selected, from which 10 regions of interest with dimensions of 100 × 100 pixels were extracted. A total of 1,000 images were cropped from the original set. The images were saved in .png format to ensure the preservation of the quality of the photographic records. Of these, 80% (800 images) were used for training the classification models, while the remaining 20% (200 images) were reserved for testing, ensuring a balanced dataset for model evaluation.
Software for exploratory analysis of multivariate data
The photo records (cropped images) were imported into the free-license software ChemoStat®, version 2 (Helfer, Brasil), for the extraction of grayscale values from the RGB (red, green, blue) channels and attributes from the HSV (H: hue; S: saturation; V: value of luminance), L (lightness), and I (intensity) color spaces, resulting in the creation of a database. These obtained data were exported to an Excel spreadsheet and then used in the classification models through machine learning algorithms.
Software for data evaluation
The database was imported into RStudio, version 3.6.0 (RStudio, PBC (public-benefit corporation), USA), platform that uses the R24 programming language. R offers a wide range of functions for data analysis, including the evaluation of multicollinearity between response variables, which is essential for the accuracy of models, whether for regression or classification. Using the car (companion to applied regression) package, tests such as VIF (variance inflation factor) were applied, and correlations between variables were analyzed, ensuring the robustness of the model. Additionally, R24 is open-source software, which makes it free and globally accessible, promoting its widespread adoption in the scientific community.
To validate the obtained dataset, the VIF was applied, which is responsible for identifying multicollinearity between the response variables (features) (Equation 1):
where R2 is the coefficient of determination, obtained by regressing a dependent variable against the other independent variables in the model.
VIF values greater than 10 indicate that there is collinearity between two or more predictor variables in the dataset. Variables with VIF values higher than 10 should be excluded from the database. VIF values between 10 and 5 indicate a high correlation between variables. Variables with VIF values equal to or less than 5 are acceptable and should be retained in the dataset for further modeling.25
Another factor that can be used to evaluate the correlation between response variables is called tolerance (TOL) (Equation 2).
A TOL value equal to 1 indicates that there is no multicollinearity between the response variables; values between 1 and 0.10 present acceptable multicollinearity; values below 0.10 indicate high multicollinearity between the features.15
After selecting the data using VIF and TOL, seven machine learning algorithms were tested.
Algorithms for data classification
In this work, several machine learning algorithms were used to classify highand medium-purity cocaine samples, including: Naive Bayes, support vector machine (SVM), logistic regression, K-nearest neighbors (KNN), decision tree, random forest, and XGBoost. These algorithms apply predictive analysis to generate classification models based on multivariate data. The quality of the models was evaluated by the performance of each algorithm, using metrics such as precision, sensitivity, F-score, and accuracy. All algorithms generated a confusion matrix (Table 1), which summarizes the predictions in a matrix format, showing the number of correct and incorrect classifications for each class.
From the confusion matrix, the metrics precision (Equation 3), sensitivity (Equation 4), F-score (Equation 5), and accuracy (Equation 6) were calculated.
where: TP (true positive) refers to the values correctly classified as belonging to the positive class; FP (false positive) are the values incorrectly classified as belonging to the positive class when they should not be in that category; FN (false negative) corresponds to the values that should have been classified as belonging to the negative class but were not correctly identified. Finally, TN (true negative) represents the values correctly classified as belonging to the negative class.
RESULTS AND DISCUSSION
Sample selection and application of the Scott test
The samples seized and previously analyzed by the Scientific Police were classified into two groups: MPS and HPS. In the MPS group (medium-purity samples), 10 samples were selected, with Raman spectroscopy results ranging from 82.92 to 93.95%. In the HPS group (high-purity samples), 10 samples were selected, with Raman spectroscopy results ranging from 95.90 to 97.64%. Additionally, the range definition for each group was based on the available samples. In the Scott test, all suspected cocaine samples tested positive. In some cases, the difference in coloration between the samples was evident: the purer samples exhibited a more intense turquoise-blue color, while the less pure samples displayed a lighter hue, suggesting a lower drug concentration.
Photographic records and image cropping
Initially, the photo records were captured in 300 µL microtiter plates, but it was not possible to extract uniform and well-structured pixels due to the light reflection on the sample surfaces. Additionally, it was observed that, after about 10 min, the bottom of the wells began to melt. It was later found that the chloroform in the solution reacted with polyethylene (PE) and polypropylene (PP), the materials from which the microplates are made. Due to these issues, a quartz cuvette was chosen for use. The smooth surfaces of the cuvette provided more homogeneous photos, while the matte surfaces helped minimize light and shadow interference on the sides. The cuboid shape was also crucial, allowing for the extraction of a large number of pixels from each image.
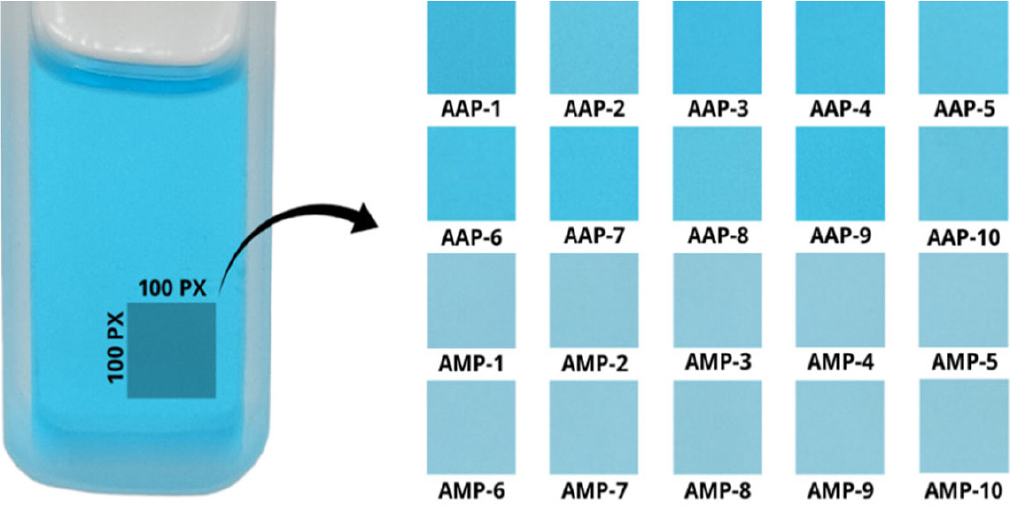
The cropping of the regions of interest (ROI)27 followed standardized guidelines: areas near the edges of the cuvette and the surface of the liquid were avoided, as well as bubbles and impurities in the solutions, and regions with high light incidence or shadow. Lighting is a crucial factor in image acquisition, as color depends directly on it. These guidelines were established to minimize potential errors and ensure greater accuracy in the results. The samples subjected to the Scott test exhibited a varied pattern of cyan blue shades (Figure 3).

Crops of the regions of interest from each sample (ROI). On the right, crops from each sample are included, organized according to their classification: the top two rows correspond to high-purity samples, while the bottom two rows represent medium-purity samples
The reaction medium for the Scott test was prepared in quartz cuvettes (Figure 3). The image acquisition of samples with the cuvette used for the photos, along with an example of the region of interest (ROI), can be seen in the illustration (Figure 3). One can clearly observe and compare the variations in the cyan blue hue of the test samples. This color pattern can be captured and used to solve regression or classification problems through computer vision. Color patterns in chemical assays are used in various studies and in different fields of knowledge.12,22,28,29
Variable selection
After applying VIF to the dataset, it was found that the features G, B, S, and I (green, blue, saturation, intensity) had VIF values greater than 10 and TOL values below 0.10, indicating the presence of multicollinearity. For this reason, these variables were removed from the dataset. The model was then built using the predictive variables H, V, L, and R (hue, value, lightness, red). These last four features had VIF values below five (Table 2).
Metric figures of the classification algorithms
In the classification models, a total of 1.000 crops were extracted. Each group (MPS and HPS) contained 10 samples, totaling 20 samples. For each sample, 5 photos were taken, from which 10 crops were extracted per photo. These crops were divided into 70% for training, resulting in 700 images, and the remaining 30%, corresponding to 300 images, were used for the test set.
To construct the confusion matrix, the classes originally labeled as MPS (medium-purity samples) and HPS (high-purity samples) had to be converted into binary codes, with HPS = 0 and MPS = 1 (Table 3).
The confusion matrix evaluates the performance of a binary classification model for the MPS and HPS classes. In it, predictions are divided into two groups: 1 and 0, where 1 represents the prediction that the sample belongs to the MPS class, and 0 indicates the prediction that the sample belongs to the HPS class. Similarly, the actual values are also represented by 1 and 0, corresponding to the true class of the sample, MPS and HPS, respectively. The results in the table can be interpreted as follows: the “correct MPS” quadrant (TP true positives) refers to cases where the model correctly predicted that a sample belongs to the MPS class, meaning both the prediction and the actual class are MPS. The “incorrect MPS” quadrant (FP - false positives) shows incorrect predictions, where the model classified samples belonging to the HPS class as MPS. On the other hand, the “incorrect HPS” quadrant (FN - false negatives) includes errors where the model predicted HPS, but the actual class was MPS, meaning the model failed to correctly identify the MPS samples. Finally, the “correct HPS” quadrant (TN - true negatives) represents the correct classifications of the model of HPS samples. This confusion matrix (Table 3) provides a clear view of the performance of the model, highlighting both correct predictions (correct MPS and correct HPS) and errors (incorrect MPS and incorrect HPS). This way, it is possible to assess in which situations the model is succeeding or failing in classifying samples between the MPS and HPS classes.
Results of machine learning algorithms performance
The performance results of the classification models applied to the cocaine samples subjected to the Scott test, using machine learning algorithms, showed overall accuracy higher than 86% for the training set and 85% for the test set, as presented in Table 4.
Comparison of the performance of ML algorithms for classifying the two types of cocaine samples (classes HPS and MPS) with metrics for the training and test models
In this study, seven ML algorithms were used to classify high-purity (HPS) and medium-purity (MPS) cocaine samples. The ML algorithms were: Naive Bayes, SVM, logistic regression, KNN, decision tree, random forest, and XGBoost. The results were presented in two main sections: training (%) and test (%), which show the performance of the algorithms on the training and test data, respectively. The evaluated parameters include precision, which measures the proportion of true positives in relation to the total predicted positives, i.e., how many of the examples classified as positive are actually positive. Sensitivity, also known as recall, assesses the ability of the model to correctly identify all real positives. The F-score is a combination of precision and sensitivity, representing the harmonic mean between these two values, providing a balanced measure of model performance. Accuracy measures the proportion of correct predictions, both positive and negative, in relation to the total predictions. In the section corresponding to the HPS class (top of Table 4), the training data results show that the ML algorithms presented precision values ranging from 77% for Naive Bayes to 98% for XGBoost. Sensitivity ranged from 91 to 100%, and the F-score varied between 88% and 97%. For the test data, the results were slightly lower but still robust, with precision ranging from 78 to 92%, sensitivity from 91 to 99%, and the F-score from 87 to 93%.
In the lower part of Table 4, the results for the MPS class are presented in the same format. In the training data, precision ranged from 90 to 99%, sensitivity from 74 to 98%, and the F-score between 85 and 97%. In the test set, precision results were between 91 and 100%, sensitivity ranged from 70 to 92%, and the F-score ranged from 82 to 94%.
Interpreting the results, it is observed that XGBoost was the algorithm with the best overall results, showing high precision, sensitivity, F-score, and accuracy in both the training and test data for both classes. Naive Bayes, on the other hand, presented the lowest results, particularly in terms of sensitivity for the MPS class in the test set. Other algorithms, such as random forest and SVM, also stood out with good performance metrics in both data sets. This table (Table 4) allows for a clear comparison of the performance of the various algorithms for the two classes, facilitating the identification of which models are more effective in terms of precision, sensitivity, F-score, and accuracy for the classification task in the HPS and MPS classes.
CONCLUSIONS
The Scott test, applied to cocaine samples seized by law enforcement in the state of Paraná, proved to be effective. Aiming to improve the rapid and economic analysis methods used in forensics, and seeking to avoid the high costs and prolonged analysis times associated with more sophisticated methods, this study evaluated machine learning techniques based on the digital image processing of photographic records of the samples. The data extracted from a training image set were used to generate predictive models that subsequently classified the test images into high-purity or medium purity groups. All tested algorithms showed good performance, with precision, accuracy, sensitivity, and F-score values above 90%, except for Naive Bayes. It is noteworthy that two algorithms, KNN and XGBoost, achieved excellent prediction performance, validating the classification method for the purity of cocaine samples.
Based on these results, it is possible that the use of machine learning could become a complementary tool to the Scott test, providing support to the Police Intelligence sector. This new approach could be utilized in rapid tests, applied directly by the Scientific Police, to quickly and accurately identify and differentiate cocaine samples between highand medium-purity. Thus, teams could rely on a reliable preliminary assessment directly in the field or in forensic laboratories, without the need for sophisticated equipment or expensive reagents.
The machine learning algorithms demonstrated a high success rate in classifying the two purity classes of cocaine. This approach can be used to trace chemical profiles of abused drugs, allowing for the association of trafficking routes, suppliers, and users, contributing to case resolution in forensic chemistry laboratories, including at the federal level. The use of these techniques could also result in significant savings on reagents and specialized equipment, as well as reduce response times in investigations. Therefore, machine learning has the potential to revolutionize forensic work, making it more agile, accessible, and efficient, directly assisting in police operations and the fight against drug trafficking.
DATA AVAILABILITY STATEMENT
All data supporting the findings are available within the article. Additional raw images (reagent-based photographs) are available from the corresponding author upon reasonable request.
ACKNOWLEDGMENTS
The authors acknowledge the financial support and scholarships provided by the Coordination for the Improvement of Higher Education Personnel (CAPES, Finance Code 001) and by the State Foundation for Research through the New Research and Innovation Arrangement - Araucária Foundation (NAPI). The authors also thank the Electroanalytical and Nanostructured Materials Group (GEMN) and the State University of the Center-West (Unicentro) for providing the necessary research infrastructure, as well as the Scientific Police of Paraná for their collaboration.
REFERENCES
-
1 Goldstein, R. A.; DesLauriers, C.; Burda, A.; Johnson-Arbor, K.; Seminars in Diagnostic Pathology 2009, 26, 10. [Crossref]
» Crossref -
2 Willstätter, R.; Ber. Dtsch. Chem. Ges. 1898, 31, 1534. [Crossref]
» Crossref -
3 Lapachinske, S. F.; Okai, G. G.; dos Santos, A.; de Bairros, A. V.; Yonamine, M.; Forensic Sci. Int. 2015, 247, 48. [Crossref]
» Crossref -
4 Conceição, V. N.; Souza, L. M.; Merlo, B. B.; Filgueiras, P. R.; Poppi, R. J.; Romão, W.; Quim. Nova 2014, 37, 1538. [Crossref]
» Crossref -
5 Volkow, N. D.; Wang, G. J.; Fowler, J. S.; Tomasi, D.; Focus 2015, 13, 341. [Crossref]
» Crossref -
6 United Nations Office on Drugs and Crime (UNODC). [Link] accessed in October 2025
» Link - 7 van Asten, A.; Chemical Analysis for Forensic Evidence, 1st ed.; Elsevier: Amsterdam, 2023.
-
8 Oguri, K.; Wada, S.; Eto, S.; Yamada, H.; Eisei Kagaku 1995, 41, 274. [Crossref]
» Crossref -
9 de Souza, D. M.; Messias, P. J. M.; Santos, I. S.; Ramalho, E. D.; Ferrari Júnior, E.; Morais, P. A. O.; Forensic Sci. Int. 2022, 335, 111277. [Crossref]
» Crossref -
10 Acar, E.; Computers and Electronics in Agriculture 2020, 175, 105559. [Crossref]
» Crossref -
11 Jiménez-Carvalho, A. M.; González-Casado, A.; Bagur-González, M. G.; Cuadros-Rodríguez, L.; Food Res. Int. 2019, 122, 25. [Crossref]
» Crossref -
12 Ortiz-Aguayo, D.; De Wael, K.; del Valle, M.; J. Electroanal. Chem. 2021, 902, 115770. [Crossref]
» Crossref - 13 Gholami, R.; Fakhari, N. In Handbook of Neural Computation; Samui, P.; Sekhar, S.; Balas, V. E., eds.; Academic Press: Cambridge, 2017, ch. 27.
-
14 Sen, P. C.; Hajra, M.; Ghosh, M.; Advances in Intelligent Systems and Computing 2019, 937, 99. [Crossref]
» Crossref -
15 Peretz, O.; Koren, M.; Koren, O.; Engineering Applications of Artificial Intelligence 2024, 136, 108972. [Crossref]
» Crossref -
16 Maalouf, M.; International Journal of Data Analysis Techniques and Strategies 2011, 3, 281. [Crossref]
» Crossref -
17 Guo, Y.; Han, S.; Li, Y.; Zhang, C.; Bai, Y.; Procedia Computer Science 2018, 129, 159. [Crossref]
» Crossref -
18 Grubinger, T.; Zeileis, A.; Pfeiffer, K. P.; Journal of Statistical Software 2014, 61, 1. [Crossref]
» Crossref -
19 Breiman, L.; Machine Learning 2001, 45, 5. [Crossref]
» Crossref -
20 Chen, T.; Guestrin, C.; KDD’16: The 22nd ACM SIGKDD International Conference on Knowledge Discovery and Data Mining; San Francisco, California, 2016. [Crossref]
» Crossref -
21 Marcelo, M. C. A.; Mariotti, K. C.; Ortiz, R. S.; Ferrão, M. F.; Anzanello, M. J.; Microchem. J. 2016, 127, 87. [Crossref]
» Crossref -
22 Xiao, Q.; Zhou, Z.; Shen, Z.; Chen, J.; Gu, L.; Li, F.; Chen, H.; Liu, H.; Sens. Actuators, B 2023, 375, 132922. [Crossref]
» Crossref -
23 GIMP: GNU Image Manipulation Program®, version 3.0.4; GIMP Development Team, 2023. [Link] accessed in October 2025
» Link -
24 R Core Team®, version 3.6.0; R Foundation for Statistical Computing, Vienna, 2022. [Link] accessed in October 2025
» Link -
25 Butuner, R.; Cinar, I.; Taspinar, Y. S.; Kursun, R.; Calp, M. H.; Koklu, M.; Eur. Food Res. Technol. 2023, 249, 1303. [Crossref]
» Crossref -
26 Tiwari, A.; Supervised Learning: From Theory to Applications; Academic Press: Cambridge, 2022, ch. 2. [Crossref]
» Crossref -
27 Capitán-Vallvey, J. F.; López-Ruiz, N.; Martínez-Olmos, A.; Erenas, M. M.; Palma, A. J.; Anal. Chim. Acta 2015, 889, 23. [Crossref]
» Crossref -
28 Fontoura, B. H.; Perin, E. C.; Teixeira, S. D.; de Lima, V. A.; Carp, S. T.; J. King Saud Univ., Sci. 2023, 35, 102792. [Crossref]
» Crossref -
29 Alves, V.; dos Santos, J. M.; Pinto, E.; Ferreira, I. M. P. L. V. O.; de Lima, V. A.; Felsner, M. L.; Microchem. J. 2024, 196, 109604. [Crossref]
» Crossref