
 ASSESSMENT OF QPCR INHIBITORY EFFECTS IN WASTEWATER CONCENTRATED VIA HIGH-FOLD TANGENTIAL FLOW ULTRAFILTRATION
Abstract
Tangential flow filtration (TFF) is widely used for high-ratio virus enrichment in wastewater, but the inhibitory effects caused by co-concentrated chemical inhibitors in wastewater concentrates on quantitative polymerase chain reaction (qPCR) quantification remain unclear. In this study, cyanophage PP, bacteriophage phi6, and pepper mild mottle virus (pMMoV) were used to evaluate qPCR inhibition in highly concentrated wastewater produced by TFF. Concentration factors obtained by plaque assay were compared with those measured by quantitative polymerase chain reaction/reverse transcription-quantitative polymerase chain reaction (qPCR/RT-qPCR), and serial dilution regression was applied to assess inhibition. At an approximately 1250-fold volume concentration, the concentration factors measured by qPCR were on average 11.2-fold lower than those measured by plaque assay. When the dilution factor exceeded 16, cycle threshold (Ct) values showed significant linear relationships with dilution, indicating that dilution effectively reduced the inhibitory effects caused by co-concentrated chemical inhibitors in the wastewater concentrate. The concentration factors of PP, Phi6, and pMMoV were further estimated to be underestimated by 5.3-fold, 72.1-fold, and 2.6-fold, respectively, with Phi6 showing the strongest inhibition. These results demonstrate that high-ratio TFF can markedly amplify qPCR inhibition in wastewater, thereby causing virus-dependent underestimation. This study quantitatively reveals this bias in highly TFF-concentrated wastewater and provides a basis for process optimization and result correction in wastewater-based epidemiology.
Keywords:
concentration; tangential flow ultrafiltration; qPCR; RT-qPCR; plaque-forming unit
INTRODUCTION
Driven by the increasing frequency of global emerging and re-emerging infectious disease outbreaks, the surveillance focus of wastewater-based epidemiology (WBE) has undergone a strategic shift toward pathogenic microorganisms.1 This application has been demonstrated in city-scale severe acute respiratory syndrome coronavirus 2 (SARS-CoV-2) wastewater surveillance, where viral ribonucleic acid (RNA) trends in sewage were shown to reflect community transmission and provide an early warning signal for COVID-19 outbreaks.2 However, pathogens undergo substantial dilution upon entering municipal sewer systems, resulting in extremely low natural abundances of viruses in environmental wastewater – often falling well below the limit of detection for direct molecular assays. This challenge is further compounded by the high complexity of the wastewater matrix.3 Consequently, the efficient and non-destructive enrichment of trace viruses from large-volume and high-turbidity environmental water samples has become a critical prerequisite for ensuring both the sensitivity and quantitative accuracy of WBE surveillance.4,5
In wastewater viral surveillance, tangential flow ultrafiltration (TFF) has demonstrated superior concentration performance for large-volume environmental water samples, primarily owing to its efficacy in mitigating membrane fouling. Existing research indicates that viral enrichment via TFF systems not only yields exceptional recovery rates for SARS-CoV-2 but also ensures high-quality nucleic acid extracts, which fully meet the stringent requirements of high-precision downstream applications such as whole-genome sequencing.6 Notably, regarding large-volume sample processing, TFF is capable of concentrating several liters of influent down to a milliliter scale within a few hours, thereby demonstrating exceptional volumetric reduction capacity.7 Furthermore, as this physical retention-based approach avoids phase transitions, it minimizes the loss of viral particles during the concentration process, making it one of the preferred methods for WBE surveillance.6
However, it is widely recognized that the TFF process inevitably co-concentrates various matrix-associated chemical substances alongside target viruses. Studies on TFF-related ultrafiltration techniques have demonstrated severe matrix inhibition during virus concentration. For instance, inhibitors co-enriched in TFF concentrates from storm drains and drainage ditches led to over 32-fold underestimation of deoxyribonucleic acid (DNA) phage detection by quantitative polymerase chain reaction (qPCR).8 Similarly, reverse transcription-quantitative polymerase chain reaction (RT-qPCR) inhibition was detected in TFF concentrates of surface water and drinking water samples, with 7 out of 16 testing positive even after 10-fold dilution,9 and 30 out of 42 TFF-concentrated river water samples also exhibited RT-qPCR efficiencies below 10%.10 However, comparison of TFF concentrates from tap water and river water revealed that only river water samples exhibited qPCR inhibition, which was fully relieved by a 5-fold dilution for adenovirus.11
To date, although qPCR inhibition in TFF concentrates of drinking water and surface water has been assessed,8-11 no study has yet evaluated qPCR inhibition in TFF concentrates of municipal wastewater, particularly at high volumetric concentration factors (VCF, > 1000-fold). To address this, the present study compared the concentration factors (CFs) obtained via plaque assay and qPCR, and utilized serial dilution assays to estimate the degree of qPCR inhibition caused by co-concentrated chemical inhibitors in highly concentrated wastewater across different viral types. Our findings provide critical insights for the further optimization of high-ratio viral concentration technologies based on TFF.
EXPERIMENTAL
Materials
Cyanophage PP, a non-enveloped double-stranded DNA (dsDNA) virus, was isolated in our laboratory.12 The host alga, Plectonema sp., was obtained from the Freshwater Algae Culture Collection at the Institute of Hydrobiology (FACHB), Chinese Academy of Sciences. Phage phi6, an enveloped dsRNA virus, and its host bacterium, Pseudomonas syringae, were purchased from Mingzhou Biotechnology (Ningbo, China). Pepper mild mottle virus (pMMoV), a non-enveloped single-stranded RNA (ssRNA) virus, was utilized as an endogenous indicator due to its ubiquity in wastewater;13 blue-green medium 11 (BG11) medium, tryptic soy agar (TSA), and tryptic soy broth (TSB) were all purchased from Qingdao Hope Bio-Technology Co., Ltd. (Qingdao, China). Viral nucleic acids were extracted using the T851 Virus DNA/RNA Extraction Kit (Tianlong Technology Co., Ltd., Xi’an, China). For molecular quantification, the M5 GoldStar TaqMan Mixture qPCR Kit (Mei5 Biotechnology Co., Ltd., Beijing, China) was employed for DNA targets, while the AgPath-ID™ One-Step RT-qPCR Reagents (Applied Biosystems/Thermo Fisher Scientific, Waltham, MA, USA) were used for RNA targets.
Methods
Preparation of cyanophage PP
(i) Cultivation of host alga: the Plectonema sp. culture was inoculated into BG11 medium at a volume ratio of 5% (v/v). The cultures were maintained at 27 °C under a 12:12 h light/dark cycle (photoperiod) with a light intensity of 2,000 lux.
(ii) Preparation of cyanophage PP: briefly, 100 mL of Plectonema sp. in the exponential growth phase (cultivated for 4-7 days) was inoculated with cyanophage PP at a volume ratio of 1-2% (v/v). The culture was incubated at 27 °C under light until complete lysis occurred, as indicated by the algal suspension transitioning from green to yellow. To purify the viral particles, chloroform was added to the resulting lysate at a 10% (v/v) ratio. After thorough mixing, the mixture was allowed to stand at 4 °C for 2 h. The supernatants, with a cycle threshold (Ct) value ranging from 15 to 20, were collected and stored as the cyanophage PP stock solution.
Preparation of phage phi6
(i) Cultivation of the host bacterium: an aliquot of the Pseudomonas syringae culture was inoculated into TSB at a volume ratio of 1% (v/v). The mixture was then incubated at 25 °C with shaking at 180 rpm.
(ii) Preparation of phage phi6: briefly, 100 mL of Pseudomonas syringae in the exponential growth phase (OD600 of 0.1-0.4) was inoculated with phage phi6 at a volume ratio of 1-2% (v/v). The mixture was then incubated at 25 °C with shaking at 180 rpm for 16-18 h. Following incubation, the phage culture was centrifuged at 4,000 g for 10 min to remove bacterial cells. The resulting supernatant was then passed through a 0.22 or 0.45 μm sterile polyethersulfone (PES) membrane filter. The filtrates, with a Ct value ranging from 10 to 15, were collected and stored as the phage phi6 stock solution.
Water collection and TFF concentration
25-L aliquots of grit chamber effluent were collected from a municipal wastewater treatment plant. The water quality characteristics of the wastewater used in this experiment are detailed in Table 1S (Supplementary Material). The sample was sequentially pre-filtered through 5 and 0.22 μm polypropylene (PP) membranes to remove large particulates. Subsequently, 10 mL of cyanophage PP stock and 1 mL of phage phi6 stock were spiked into each permeate. Viral concentration was performed using a TFF system equipped with polyacrylonitrile (PAN) hollow fiber membranes (molecular weight cut-off (MWCO): 50-100 kDa; Jucheng Bayer, China) at an inlet pressure of approximately 0.04 MPa. After the entire 25-L sample had passed through the membrane, compressed air (0.6 MPa) was applied through the permeate port for backwashing. This process yielded approximately 20 mL of concentrate, achieving a VCF of approximately 1,250-fold.
Comparison between plaque assay and qPCR-based quantification
Comparison between plaque assay and qPCR-based quantification cyanophage PP was selected as the target virus for this assay due to its non-pathogenic nature and its high suitability for reliable and straightforward plaque assays. Quadruplicate concentrates were applied in the experiment. The CF for both the plaque assay and qPCR were determined according to Equations 1 and 2.
where, CFplaque: CF calculated by detecting the targets in wastewater before and after concentration using the plaque assay; Titerconcentrate and Titerraw: viral target titers measured by the plaque assay in the concentrate and the unconcentrated raw water, respectively; CFqPCR: CF determined by detecting the targets in wastewater before and after concentration via the qPCR assay; Ctraw and Ctconcentrate: cycle threshold (Ct) values of the viral targets measured by qPCR in the unconcentrated raw water and the concentrate, respectively.
Gradient dilution assay for inhibition assessment
To comprehensively evaluate the concentration performance and inhibition effects across diverse viral structures, three representative targets were selected: a non-enveloped DNA virus (cyanophage PP), an enveloped RNA virus (phage phi6), and a non-enveloped RNA virus (pMMoV). Duplicate concentrates were applied in the experiment. To evaluate the interference of inhibitors and the mitigation of inhibitory effects via dilution, the concentrate was serially diluted four-fold with ultrapure water. The Ct values of the viruses in each dilution were determined by qPCR and RT-qPCR. Based on these experimental data, independent fitting curves were constructed to dynamically model the mitigation of matrix effects (inhibition relief) across the dilution gradient. This empirical curve-fitting approach allowed for a more accurate assessment of the true viral CFs, utilizing the analytical framework previously described by Rajal et al.8
Viral quantification in wastewater
(i) Plaque assay
The plaque assay for cyanophage PP was conducted following the method described by Suttle.14 Briefly, water samples were serially diluted with BG11 medium, typically reaching a 103-fold dilution. A 0.1 mL aliquot of the diluted sample was mixed with 1.9 mL of log-phase Plectonema sp. culture, which had been pre-concentrated by centrifugation at 6,000 rpm. The mixture was thoroughly homogenized and allowed to stand for 20 min to facilitate the adsorption of cyanophages onto the host cells. Subsequently, 2 mL of BG11 medium containing 2% agar (pre-equilibrated to 65 °C) was added. The mixture was rapidly mixed and poured onto a solid base layer of BG11 medium (2% agar). Once the top layer had solidified, the plates were incubated at 27 °C under a 12:12 h light/dark cycle (photoperiod) with a light intensity of 2,000 lux until distinct plaques became visible, typically within 24-48 h. All plaque assays were performed in triplicate for each sample.
(ii) Nucleic acid extraction and (RT-)qPCR assays
All primers and probes for cyanophage PP, phage phi6, and pMMoV used in this study were synthesized by Sangon Biotech Co., Ltd. (Shanghai, China). For cyanophage PP, the forward primer, reverse primer, and TaqMan probe sequences were 5’-CCTTCGGTTATGCGTTTGGT-3’, 5’-GAAGACAGCGCACCTTTGAT-3’, and 5’-ACCACGTGAAGCAGTAGCCGCCA-3’, respectively. Phage phi6 was detected using the forward primer 5’-CCCACGTAAGCTCGTCGA-3’, reverse primer 5’-GAGAGGATGCCACCAACGA-3’, and probe 5’-CCTGATGGTGTACGCTCGCGATC-3’.15 Finally, pMMoV quantification utilized the forward primer 5’-TTAGATTTCCTGCTACTGGTTTCAA-3’, reverse primer 5’-CAGTTGTAGGATTTTGCGGATTT-3’, and probe 5’-TGTCGGCACTTCTCGGAGCCTTTG-3’.16 To ensure the reliability and analytical rigor of the molecular detection, comprehensive quality assurance/quality control (QA/QC) protocols were implemented. Notably, the standard curves were empirically established in-house. Parameters including amplification efficiencies, slope, and correlation coefficients were derived from these empirically generated curves and are provided in Figure 1S (Supplementary Material).
Nucleic acids were extracted from 400 μL of each sample using the T851 Virus DNA/RNA Extraction Kit on a GeneRoteX 96 Automated Nucleic Acid Extraction System (Tianlong Technology, China). For cyanophage PP, qPCR was performed using the M5 GoldStar TaqMan Mixture (Mei5 Biotechnology, China). For pMMoV, RT-qPCR was conducted using the AgPath-ID™ One-Step RT-PCR Kit (Applied Biosystems/Thermo Fisher Scientific, USA). For phage phi6 (a dsRNA virus), the extracted nucleic acids were first subjected to heat denaturation at 95 °C for 5 min followed by immediate snap-cooling in a cooling block at –86 °C for at least 5 min to facilitate strand separation.15 Subsequently, RT-qPCR for Phi6 was performed using the AgPath-ID™ kit. All real-time PCR assays were executed on a Gentier 96R Real-Time PCR System (Tianlong Technology, China). Moreover, positive controls (freshly prepared high-concentration viral targets subjected to extraction and amplification) and negative controls (ultrapure water) were systematically included in every (RT-)qPCR run.
Statistical analysis and data visualization
Statistical analyses were performed using SPSS 25.0 (IBM, USA, 2017). Where applicable, an independent-samples t-test was utilized to evaluate differences between groups. Linear regression analysis and data visualization were conducted using Origin 2024 (OriginLab Corporation, USA, 2023). Data are presented as the mean ± standard deviation (SD), as indicated by the error bars. A P-value < 0.05 was considered statistically significant.
RESULTS AND DISCUSSION
Comparison of cyanophage PP CFs: plaque assay vs. qPCR
As shown in Figure 1, the CFs determined by the qPCR assay (peaking at approximately 20-fold) were significantly lower than those obtained by the plaque assay for the same samples (peaking at approximately 250-fold). On average, the CF measured by qPCR was 11.2 ± 10.3 times lower than the plaque assay results (P < 0.05). These findings indicate that the qPCR assay severely underestimates the concentration performance of TFF for cyanophage PP, most likely because co-concentrated chemical inhibitors in the wastewater concentrate suppress amplification efficiency. This profound qPCR inhibition effect aligns with previous reports on complex environmental matrices. For instance, the co-enrichment of inhibitors during TFF concentration of DNA phages from stormwater runoff was found to underestimate qPCR detections by over 32-fold relative to theoretical volumetric values.8 Similarly, studies on waters from rivers and lakes indicated that PCR inhibition within TFF concentrates could lead to a substantial reduction in apparent molecular recovery efficiencies.17
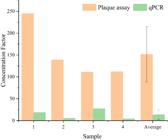
Comparison of CF for cyanophage PP evaluated by plaque assay and quantitative PCR (qPCR). The CF represents the enrichment ratio of infectious viral particles (quantified via plaque assay) and viral nucleic acids (quantified via qPCR) achieved after the concentration process. Individual values for four independent replicates (samples 1-4) are shown alongside their overall average. For the “Average” group, data are presented as the mean ± standard deviation (n = 4)
The primary driver of this phenomenon is the ubiquitous presence of chemical inhibitory substances in environmental waters, such as humic acids, extracellular polymeric substances, and other matrix-associated compounds. During the physical sieving process of the hollow fiber membranes, these chemical inhibitors undergo concomitant enrichment alongside viral particles,18 These co-concentrated chemical inhibitors can significantly suppress Taq DNA polymerase activity by chelating essential magnesium ions (Mg2+) or by directly binding to the enzyme,17 thereby altering its three-dimensional conformation. Furthermore, certain wastewater-derived chemical components co-concentrated during TFF may directly interfere with the detection of fluorescent signals.19
In contrast, the plaque assay offers an inherent advantage for accurate quantification in complex matrices. As it relies on the infectivity of viable viruses toward host cells and typically requires high-fold serial dilution prior to plating to achieve distinct plaque counts, the negative impact of concentrated inhibitors is effectively neutralized. Additionally, the loss of free viral nucleic acid fragments – which may either permeate through the hollow fiber membrane or irreversibly adsorb onto the membrane surface due to non-specific affinities20 – further reduces the total genomic pool available for qPCR detection, contributing to the observed discrepancy in concentration performance.
Ct values of serially diluted concentrates
As illustrated in Figure 2, when the dilution factor exceeded 16-fold, the increase in Ct values for all three viruses exhibited a linear relationship with the dilution factor (all three fitting curves yielded P < 0.05 and determination coefficient (r2) > 0.989). This suggests that the inhibitory effects caused by co-concentrated chemical inhibitors in the wastewater matrix were progressively mitigated as the dilution increased. Based on the regression models, the extrapolated Ct values for the undiluted concentrates (i.e., at a dilution factor of 1, or log 0) were 16.6, 19.4, and 16.4 for cyanophage PP, phage phi6, and pMMoV, respectively. These values were 3.1, 6.0, and 1.2 units lower than the corresponding measured Ct values in the undiluted samples. Furthermore, considering the amplification efficiencies derived from the slopes in Figure 2, it was calculated that the CFs for cyanophage PP, phage phi6, and pMMoV were underestimated by 5.3-fold, 72.1-fold, and 2.6-fold, respectively.

The above gradient dilution assays revealed a striking variation in the degree of qPCR inhibition across the different viral targets. Specifically, the underestimation factor for the dsRNA phage phi6 (ca. 72.1-fold) was markedly higher than those for the dsDNA cyanophage PP (ca. 5.3-fold) and the ssRNA virus pMMoV (ca. 2.6-fold). Given that the nucleic acids for all three viruses were sourced from the same TFF concentrate and extraction process – thereby containing identical concentrations of co-enriched inhibitors such as humic acids and proteins – we hypothesize that this disparity stems from the differential inhibitory strength exerted by the matrix on various nucleic acid templates during the (RT-)qPCR process.11 However, this interpretation should be approached with caution, as the evaluated viruses also differ fundamentally in their required analytical methodologies.
This phenomenon is particularly pronounced for dsRNA (phi6), which necessitates a rigorous pre-treatment of heat denaturation (95 °C for 5 min) followed by immediate snap-cooling prior to RT-qPCR. While this thermal processing is essential to disrupt the highly stable hydrogen bonds of the dsRNA duplex and prevent renaturation, thereby facilitating primer annealing,15 it likely renders the temporarily exposed single-stranded nucleic acids more vulnerable to interactions with co-concentrated inhibitors like humic acids. This exposure potentially amplifies the inhibitory effect, leading to the observed high level of suppression.21 In contrast, ssRNA and dsDNA templates do not require such extreme thermal shock treatment, resulting in relatively lower susceptibility to matrix interference during their respective quantification processes. While WBE surveillance encompasses a broad spectrum of epidemic viruses (including dsRNA,22 ssRNA23 and dsDNA viruses),24 this study specifically evaluated surrogate viruses and pMMoV. Given the marked differences in qPCR inhibition observed among these specific models, future efforts should verify if similar matrix interference patterns affect major epidemiological targets like SARS-CoV-2 or norovirus. Addressing these potential differences is essential for developing standardized methodologies across different virus types in WBE systems.25
CONCLUSIONS
When the VCF of wastewater exceeds 1,000-fold, co-concentrated chemical inhibitors within the TFF concentrates lead to a significant underestimation of the qPCR-derived concentration factors by 2.6 to 72.1-fold. Furthermore, the magnitude of this underestimation is critically dependent on the measurement of specific virus type.
SUPPLEMENTARY MATERIAL
Supplementary material for this work is available at http://quimicanova.sbq.org.br/, as a PDF file, with free access.
Supplementary PDF
DATA AVAILABILITY STATEMENT
All data generated or analyzed during this study are included in this published article.
ACKNOWLEDGMENTS
This study was supported by the Prevention and Control of Emerging and Major Infectious Diseases-National Science and Technology Major Project (Grant No. 2026ZD01999708) and the Major Project of Guangzhou National Laboratory (Grant No. GZNL2024A01007). Also, this study thanks Li Yuena, Sun Fukang, Zhang Guang and Zhang Yongkang for their assistance and support in sample collection and technical discussion.
REFERENCES
-
1 Medema, G.; Heijnen, L.; Elsinga, G.; Italiaander, R.; Brouwer, A.; Environ. Sci. Technol. Lett. 2020, 7, 511. [Crossref]
» Crossref -
2 Mendes, G. M.; Estrela, P. F. N.; de Souza Junior, M. N.; de Brito, N. N.; Arruda, A. F.; Augusto, M. R.; Claro, I. C. M.; Duran, A. F. A.; Cabral, A. D.; Bueno, R. F.; Duarte, G. R. M.; Quim. Nova 2022, 45, 1197. [Crossref]
» Crossref -
3 Corpuz, M. V. A.; Buonerba, A.; Vigliotta, G.; Zarra, T.; Ballesteros Jr., F.; Campiglia, P.; Belgiorno, V.; Korshin, G.; Naddeo, V.; Sci. Total Environ. 2020, 745, 140910. [Crossref]
» Crossref -
4 Kevill, J. L.; Pellett, C.; Farkas, K.; Brown, M. R.; Bassano, I.; Denise, H.; McDonald, J. E.; Malham, S. K.; Porter, J.; Warren, J.; Evens, N. P.; Paterson, S.; Singer, A. C.; Jones, D. L.; Sci. Total Environ. 2022, 808, 151916. [Crossref]
» Crossref -
5 Ahmed, W.; Angel, N.; Edson, J.; Bibby, K.; Bivins, A.; O’Brien, J. W.; Choi, P. M.; Kitajima, M.; Simpson, S. L.; Li, J.; Tscharke, B.; Verhagen, R.; Smith, W. J. M.; Zaugg, J.; Dierens, L.; Hugenholtz, P.; Thomas, K. V.; Mueller, J. F.; Sci. Total Environ. 2020, 728, 138764. [Crossref]
» Crossref -
6 Segelhurst, E.; Bard, J. E.; Pillsbury, A. N.; Alam, M. M.; Lamb, N. A.; Zhu, C.; Pohlman, A.; Boccolucci, A.; Emerson, J.; Marzullo, B. J.; Yergeau, D. A.; Nowak, N. J.; Bradley, I. M.; Surtees, J. A.; Ye, Y.; ACS ES&T Water 2023, 3, 954. [Crossref]
» Crossref -
7 Cooper, A. R.; Patel, S.; Senadheera, S.; Plath, K.; Kohn, D. B.; Hollis, R. P.; J. Virol. Methods 2011, 177, 1. [Crossref]
» Crossref -
8 Rajal, V. B.; McSwain, B. S.; Thompson, D. E.; Leutenegger, C. M.; Kildare, B. J.; Wuertz, S.; Water Res. 2007, 41, 1411. [Crossref]
» Crossref -
9 Gibson, K. E.; Schwab, K. J.; Appl. Environ. Microbiol. 2011, 77, 385. [Crossref]
» Crossref -
10 Hata, A.; Meuchi, Y.; Liu, M.; Torii, S.; Katayama, H.; Food Environ. Virol. 2023, 15, 8. [Crossref]
» Crossref -
11 Rhodes, E. R.; Huff, E. M.; Hamilton, D. W.; Jones, J. L.; J. Virol. Methods 2016, 228, 31. [Crossref]
» Crossref -
12 Zhao, Y. J.; Cheng, K.; Shi, Z. L.; Guo, Y. X.; Zhu, H. Y.; Zhang, J. H.; Liu, Y. D.; Prog. Nat. Sci. 2002, 12, 923. [Link] accessed in June 2026
» Link -
13 Pappu, A. R.; Singson, A. G.; Montogomery, S.; Jiang, S.; ACS ES&T Water 2026, 6, 602. [Crossref]
» Crossref -
14 Suttle, C. A. In Handbook of Methods in Aquatic Microbial Ecology; Kemp, P. F.; Sherr, B. F.; Sherr, E. B.; Cole, J. J., eds.; Lewis Publishers: Boca Raton, 1993, p. 121. [Link] accessed in June 2026
» Link -
15 Ahrens, A. K.; Selinka, H.-C.; Wylezich, C.; Wonnemann, H.; Sindt, O.; Hellmer, H. H.; Pfaff, F.; Höper, D.; Mettenleiter, T. C.; Beer, M.; Harder, T. C.; Microbiol. Spectrum 2023, 11, e02664. [Crossref]
» Crossref -
16 State Administration for Market Regulation; Standardization Administration of China; GB/T 36780-2018: Detection and Identification of Pepper Mild Mottle Virus; Standards Press of China: Beijing, 2018. [Link] accessed in June 2026
» Link -
17 Gibson, K. E.; Schwab, K. J.; Spencer, S. K.; Borchardt, M. A.; Water Res. 2012, 46, 4281. [Crossref]
» Crossref -
18 Ikner, L. A.; Soto-Beltran, M.; Bright, K. R.; Appl. Environ. Microbiol. 2011, 77, 3500. [Crossref]
» Crossref -
19 Sidstedt, M.; Jansson, L.; Nilsson, E.; Noppa, L.; Forsman, M.; Rådström, P.; Hedman, J.; Anal. Biochem. 2015, 487, 30. [Crossref]
» Crossref -
20 Ye, Y.; Ellenberg, R. M.; Graham, K. E.; Wigginton, K. R.; Environ. Sci. Technol. 2016, 50, 5077. [Crossref]
» Crossref -
21 Kang, S.; Wettlauffer, A.; de Korne-Elenbaas, J.; Niwagaba, C. B.; Strande, L.; Duong, D.; Shelden, B.; Julian, T. R.; Boehm, A. B.; Environ. Sci.: Water Res. Technol. 2025, 11, 2919. [Crossref]
» Crossref -
22 Fumian, T. M.; Leite, J. P. G.; Castello, A. A.; Gaggero, A.; de Caillou, M. S. L.; Miagostovich, M. P.; J. Virol. Methods 2010, 170, 42. [Crossref]
» Crossref -
23 Graham, K. E.; Loeb, S. K.; Wolfe, M. K.; Catoe, D.; Sinnott-Armstrong, N.; Kim, S.; Yamahara, K. M.; Sassoubre, L. M.; Mendoza Grijalva, L. M.; Roldan-Hernandez, L.; Langenfeld, K.; Wigginton, K. R.; Boehm, A. B.; Environ. Sci. Technol. 2021, 55, 488. [Crossref]
» Crossref -
24 Fong, T.-T.; Phanikumar, M. S.; Xagoraraki, I.; Rose, J. B.; Appl. Environ. Microbiol. 2010, 76, 715. [Crossref]
» Crossref -
25 Boehm, A. B.; Shelden, B.; Duong, D.; Banaei, N.; White, B. J.; Wolfe, M. K.; mSphere 2024, 9, e00736-23. [Crossref]
» Crossref
Edited by
-
Associate Editor handled this article:
Fernando F. Sodré


