
 Innovation in nanotechnological systems: O-carboxymethylchitosan as a polymeric matrix for vitamin C incorporation
Abstract
O-Carboxymethyl chitosan is a chitosan derivative with potential for the development of biocompatible nanotechnological systems. This study aimed to develop and evaluate a topical formulation containing O-carboxymethyl chitosan nanoparticles associated with vitamin C and Carbopol® 940, focusing on its stability and biocompatibility. The nanoparticles were prepared with 5% vitamin C in an aqueous solution of O-carboxymethyl chitosan (0.25% w/w) and different concentrations (1, 2, and 3%) of Carbopol® 940. The formulations were characterized by FTIR (Fourier transform infrared spectroscopy), DLS (dynamic light scattering), zeta potential, polydispersity index (PDI), UV-Vis, and rheological behavior, in addition to a cytotoxicity assay in L929 cell line. The nanoparticles showed an average size of 357.28 ± 10.85 nm, zeta potential of -3.19 ± 0.85 mV, and PDI of 0.241 ± 0.055, maintaining stability for up to 90 days at 25 °C. The formulations exhibited pseudoplastic behavior, good injectability, and no physicochemical interaction between the polymer and vitamin C. The cytotoxicity assay confirmed the biocompatibility of the formulation. The results indicate that O-carboxymethyl chitosan is a promising polymer for nanoengineered systems containing vitamin C in topical formulations.
Keywords:
biomaterials; drug; vitamin C; biocompatible.
INTRODUCTION
Skin aging is a complex biological process resulting from the interaction between intrinsic factors, such as genetic and hormonal alterations, and extrinsic factors, including exposure to ultraviolet radiation and lifestyle habits. These factors trigger structural modifications in the dermal matrix, such as collagen and elastin degradation, increased oxidative stress, and loss of elasticity, which lead to the appearance of wrinkles and sagging.1
Oxidative stress plays a central role in this process by promoting damage to biomolecules and accelerating skin aging. In this context, the search for safer and more effective antioxidant agents has intensified. A promising alternative is the use of natural-origin substances, whose activity can be enhanced through the development of nanostructured systems composed of biocompatible polymers.2-5
O-Carboxymethyl chitosan (CMC) is a water-soluble derivative of chitosan, obtained from chitin present in the exoskeletons of crustaceans. The carboxymethylation process grants CMC distinct chemical properties, such as increased solubility over a wide pH range and amphoteric behavior, enabling its application in biotechnological, pharmaceutical, and cosmetic systems. These features make CMC a versatile polymer for the development of controlled-release systems for drugs and bioactive compounds.6
Moreover, compared with other widely used polymers such as alginate, poly(lactic-co-glycolic acid) (PLGA), polyvinyl alcohol (PVA), or even unmodified chitosan, CMC exhibits relevant structural and functional advantages, including greater physiological solubility, the simultaneous presence of amino and carboxyl groups that promote stable ionic interactions with bioactive molecules, superior ability to stabilize oxidation-sensitive compounds, and the formation of more homogeneous colloidal systems. These characteristics allow for higher encapsulation efficiency, improved chemical protection of unstable compounds, and a more controlled release profile, justifying its selection as the polymeric matrix in this study.7
These unique properties make CMC a biopolymer of great interest for the development of nanostructured systems containing natural bioactive compounds for topical application, such as vitamin C (ascorbic acid), a water-soluble organic compound with well-known antioxidant activity and essential for collagen biosynthesis. However, like many natural active substances, vitamin C is unstable when exposed to light, oxygen, and inappropriate pH conditions, which limits its effectiveness in such formulations.8
Thus, incorporating vitamin C into biocompatible nanostructured systems, such as those based on CMC, may represent a promising strategy to enhance its stability and efficacy, enabling controlled and protected release of the active ingredient and potentiating its antioxidant and regenerative effects on the skin.9
Therefore, the present study aimed to prepare O-carboxymethyl chitosan nanoparticles containing vitamin C, incorporate them into a topical gel formulation, and evaluate their physicochemical properties, stability, and safety for cutaneous application.
EXPERIMENTAL
Preparation of the nanostructured systems
Preliminary characterization of O-carboxymethyl chitosan (OCMC)
The OCMC used in the present study was previously synthesized and characterized according to the methodology described by Galdino et al.,6 employing chitosan subjected to a carboxymethylation reaction under alkaline conditions. The resulting material presented a degree of substitution (DS) of 0.68 ± 0.03, determined by 1H NMR (nuclear magnetic resonance) spectroscopy, and purity greater than 95%, confirmed by gravimetric analysis and Fourier transform infrared spectroscopy (FTIR). These parameters were selected because they ensure greater solubility of OCMC over a wide pH range and directly influence ionic crosslinking capacity and nanoparticle formation. Prior to use, OCMC was dissolved in ultrapure water and filtered (0.45 µm) to remove particulate impurities, ensuring reproducibility of the subsequent nanoparticle preparation step. Thus, the nanoparticles prepared in this study are derived from a polymeric matrix previously characterized in terms of chemical structure, degree of modification, and purity, fundamental conditions for standardizing the nanotechnological system under investigation.
The nanostructured systems containing CMC and vitamin C were prepared based on the methodology described by Chen and Park.10 A solution of 0.25% CMC and 5% vitamin C was dissolved in 100 mL of ultrapure water under magnetic stirring (875 rpm) (Gehaka, model AA2050) at 26 °C for 1 h. After the addition of CMC, the mixture was subjected to an ultrasonic bath (Cristofoli, model 1674) for 30 min under magnetic stirring, coupled to an infusion pump for the addition of a 1% calcium chloride (CaCl2) crosslinking solution. The crosslinking solution was added using a 10 mL syringe fitted with a needle (0.80 × 25 mm). Dripping was controlled by the infusion pump at a rate of 20 mL h-1. Throughout the dripping process, the solution was kept under continuous stirring, and after the addition of the crosslinker, it was maintained under stirring for an additional 3 h.10 In addition, nanostructured systems containing CMC and CMC/vitamin C were incorporated into different concentrations of carbomer (1, 2, and 3% Carbopol® 940) to identify the most suitable concentration for topical application.
Physicochemical characterization
Fourier transform infrared spectroscopy (FTIR)
FTIR analysis was used to evaluate possible interactions among functional groups by means of their characteristic vibrational and rotational spectra, known as absorption bands, which correspond to energy levels within the formulations studied. The equipment used was a PerkinElmer Spectrum 400, operating in the scanning range of 4000 to 650 cm-1, with a resolution of 4 cm-1 and 32 scans per sample. Analyses were performed using the attenuated total reflectance (ATR) technique with a diamond crystal, and the lyophilized samples were applied directly onto the accessory.11
Injectability/ejection force
A 5 mL polypropylene syringe (BD, Becton Dickinson Ind. Cirúr. Ltda) fitted with a 27-gauge needle was used to quantify the injectability of the materials obtained. The syringe was mounted on a universal mechanical testing machine (Instron 3366), set to compression mode, equipped with a 500 N load cell. The compression grip applied force to the syringe plunger. The time and load required to empty the syringe were recorded and analyzed according to the composition of each material. The ejection force necessary for product extrusion was recorded using a force sensor at a constant speed of 1 mm min-1 at 25 °C.12 All measurements were performed in triplicate.
Rheological behavior
The rheological properties of the CMC hydrogels, with and without vitamin C, were evaluated using a controlled-stress rheometer (HAAKE MARS III, Thermo Scientific) equipped with a PP35 Ti parallel-plate geometry (35 mm diameter), a 0.5 mm gap, and temperature controlled at 25 °C. After sample loading, the material was allowed to rest for 3 min to ensure thermal and mechanical stabilization. Initially, a strain sweep was performed to determine the linear viscoelastic region (LVR), applying oscillatory stress from 0.1 to 10% at 1 Hz. Then, within the previously established LVR, a frequency sweep was conducted over the range of 0.1 to 10 Hz while maintaining constant stress at 0.1%. In addition, flow behavior was assessed by constructing viscosity curves as a function of shear rate. The shear rate was applied from 0.1 to 1000 s-1 in a logarithmic ramp, with 30 measurement points and a dwell time of 10 s at each point. To evaluate thixotropy, ascending (0.1 → 1000 s-1) and descending (1000 → 0.1 s-1) ramps were performed. All analyses were carried out in triplicate.
Storage (G’) and loss (G”) moduli
The rheological properties related to the storage modulus (G’) (elastic deformation) and the loss modulus (G”) (viscous deformation) of the samples were evaluated using a plate-plate rheometer (HAAKE MARS III) equipped with the PP 35 Ti modular system (Thermo Scientific). Measurements were performed under oscillatory conditions with frequencies ranging from 0.1 to 10 Hz, at 0.1% stress, with a 1 mm gap and temperature set at 25 °C. The maximum oscillatory frequency considered was 10 Hz.
Dynamic light scattering (DLS)
For particle size and electrophoretic mobility analysis, the samples were first subjected to sonication (UP-400S Ultraschallprozessor, Hielsher Ultrasound Technology) for 1 min to ensure homogeneous dispersion. Subsequently, the samples were diluted in ultrapure water (1:10, v/v) to achieve a scattering intensity compatible with the optimal detection range of the instrument.
Particle size measurements were carried out using disposable polystyrene cuvettes (DTS0012) in a Zetasizer Nano ZS (Malvern Instruments) at 25 °C. The attenuation index was automatically adjusted by the system (ranging mode: automatic), typically between 6-9, ensuring a detection intensity of 200-300 kcps. All analyses were performed in triplicate, and the mean diameter was recorded.
For electrophoretic mobility and zeta potential determination, a folded capillary cell (DTS1070) was used in the same instrument, operating at 25 °C. Samples were diluted at the same ratio (1:10, v/v) to maintain conductivity within the recommended range for the laser micro-electrophoresis technique. Measurements were conducted under standard applied voltage (auto-mode), and electrophoretic mobility and zeta potential were calculated using the Smoluchowski equation. All results were obtained in triplicate.
UV-Vis spectroscopy - determination of encapsulation efficiency and loading capacity
The determination of encapsulation efficiency (EE%) and drug loading of vitamin C in the O-carboxymethylchitosan nanoparticles was performed by UV-Vis spectroscopy using a PerkinElmer Lambda 35 spectrophotometer equipped with a 1 cm quartz cuvette. Initially, a vitamin C solution was prepared in ultrapure water and subjected to a spectral scan between 200 and 400 nm to identify the wavelength of maximum absorbance (λmax). The obtained value (254 nm) was used for all subsequent analyses. The calibration curve was constructed in triplicate from standard solutions at known concentrations of 2, 5, 10, 15, and 20 µg mL-1, allowing quantification of the free vitamin C in the samples. Encapsulated vitamin C was quantified indirectly, based on the determination of the non-encapsulated fraction. For this purpose, after the nanoparticle synthesis step, the suspensions were subjected to ultracentrifugation (20,000 rpm × g, 30 min at 4 °C). The supernatant was carefully collected and analyzed by UV-Vis at the previously determined λmax. Encapsulation efficiency was calculated according to the following equation 1:
where: m i vit C: vitamin C initial mass; m vitC free: mass of free vitamin C in the supernatant.
The mass of free vitamin C was obtained from the calibration curve. All analyses were performed in triplicate.
The total mass of the nanoparticles was obtained after controlled drying (lyophilization), allowing the correlation between the amount of active compound retained in the system and the mass of the carrier material.
Citotoxicity
The cytotoxicity evaluation of the formulations containing O-carboxymethylchitosan nanoparticles, with and without vitamin C, was conducted according to ISO 10993-5:2009,13 using the murine fibroblast cell line L929 (BCRJ 0051; derived from ATCC CCL-1™), obtained from the Rio de Janeiro Cell Bank. The assay followed the direct contact method, and cell viability and proliferation were assessed using the MTT (3-[4,5-dimethylthiazol-2-yl]-2,5 diphenyl tetrazolium bromide) test. After the exposure period, the plates were read spectrophotometrically at 570 nm, and absorbance values were normalized to the negative control. Prior to statistical analysis, the data were evaluated using the Grubbs test exclusively to identify outliers, as recommended for parametric datasets. The half-maximal inhibitory concentration (IC50) determination was performed by nonlinear regression fitting using a four-parameter sigmoidal model (4PL) in GraphPad Prism 6 (GraphPad Software Inc., San Diego, USA, 2014), a procedure widely employed in cytotoxicity analyses. All experimental conditions were evaluated in independent triplicates.
Stability study of the topical formulation
The formulation selected based on the physicochemical analyses and cell viability results was subjected to a preliminary stability study. Samples of the chosen formulation were stored in appropriate closed containers at 25 °C for a period of 90 days. At 0, 15, 30, and 90 days, the formulation was evaluated for mean particle size, polydispersity index (dynamic light scattering, DLS), and zeta potential using a Zetasizer Nano Series ZS instrument (Malvern Instruments).14
RESULTS AND DISCUSSION
Fourier transform infrared spectroscopy (FTIR)
FTIR analysis was used solely to evaluate general differences in the spectral profiles of the formulations and to identify possible interactions. Figure 1a shows the FTIR spectra of the samples containing only nanoparticulated CMC with different concentrations of carbomer (1, 2, and 3%). All three formulations exhibited intense peaks around 3400 cm-1, indicating the presence of hydroxyl groups (O-H), which are common in materials containing water or -OH groups in their structure. This region can provide information on the water adsorption capacity of the samples or on the presence of components capable of forming hydrogen bonds. Variations in intensity among the CC (CMC + carbomer) samples suggest that, although all contain hydroxyl groups, their quantity or availability may differ slightly.15 Samples CC1, CC2, and CC3 showed peaks in the 2900 cm-1 region, indicating C-H stretching vibrations, characteristic of aliphatic structures. These peaks may be associated with organic chains present in the material. The region between 1700-1600 cm-1 corresponds to C=O stretching vibrations, characteristic of carbonyl groups, such as carboxylic acids present in both CMC and Carbopol®. Since both components share this functionality, FTIR does not allow distinguishing their individual contributions, making it possible only to observe intensity variations or slight shifts that reflect interactions between the formulation components.16 When compared with the CMC sample, an increase in intensity is observed in the 1000 1200 cm-1 region, typically associated with C-O stretching vibrations of alcoholic, phenolic, or carbonyl groups. This behavior indicates a greater contribution from oxygen-containing functional groups characteristic of CMC itself.15

FTIR (ATR) spectra of gels containing nanostructured systems with or without vitamin C at different carbomer concentrations. CC1 (CMC 0.25% + 1% Carbopol®940); CC2 (CMC 0.25% + 2% Carbopol®940); CC3 (CMC 0.25% + 3% Carbopol®940); CC1Vit (CMC 0.25% + vitamin C 5% + 1% Carbopol®940); CC2Vit (CMC 0.25% + vitamin C 5% + 2% Carbopol®940) and CC3Vit (CMC 0.25% + vitamin C 5% + 3% Carbopol®940)
When comparing the samples with added vitamin C (CC1Vit, CC2Vit, and CC3Vit) (Figure 1b), an intensification of the band around 3300 cm-1 is observed, corresponding to the axial stretching of -OH, as well as the bands at 2883 and 2895 cm-1, attributed to the asymmetric stretching of the C-H group, especially for sample CC3Vit, possibly due to its higher carbomer concentration. The comparative results among the samples (CC1Vit, CC2Vit, and CC3Vit) show that the presence of the active compound in the matrix intensified the vibrational band around 3300 cm-1 and reduced the bands around 2883, 2895, 1640, and 1395 cm-1, which is indicative of active incorporation. When comparing the samples CC1Vit, CC2Vit, and CC3Vit, it is noted that the spectra are quite similar, with slight variations in peak intensity, particularly in the 3400 cm-1 band. It can be suggested that vitamin C did not significantly alter the fundamental structural composition of the samples, only causing small variations in the quantity or accessibility of the functional groups detected.17
The reductions in the vibrational bands observed in the FTIR indicate a possible secondary interaction between the drug and the matrix. Additionally, the intensification of the OH, CH, and other characteristic bands reinforces the hypothesis that vitamin C may be incorporated into the CMC matrix.18
Injectability/ejection force
Injectability evaluates the ease of manual injection and the rheological behavior under high shear rates.12 In this context, the analysis was performed to assess the force required for the samples to exit the container for future application. Although quantitative parameters such as peak force, plateau force, and area under the curve (AUC) may be used to characterize extrusion, this study opted for a qualitative comparison of the force profiles among the formulations, which is acknowledged as a limitation of the work.
Figure 2 shows the injectability behavior of the samples CMC, CC1, CC2, and CC3, based on the relationship between compression (or ejection) force and compressive displacement. Injectability, or ejection force, reflects the intrinsic resistance of the material to extrusion under compression and is greatly influenced by its internal structure and rheological properties.19,20

Injectability test of the samples: CMC (formulation containing only CMC 0.25%), CC1 (formulation containing CMC 0.25% + 1% Carbopol®940), CC2 (CMC 0.25% + 2% Carbopol®940) and CC3 (CMC 0.25% + 3% Carbopol®940)
The CMC sample exhibited a variable ejection force profile, with pronounced peaks throughout compression after 15 mm. This behavior suggests heterogeneous internal resistance and the need for increasing force as ejection proceeds, which may be related to the composition and distribution of the polymer chains.21
In contrast, the CC1 sample displayed a more stable curve, with ejection force predominantly between 20 and 30 N, without major oscillations. This consistency indicates uniform resistance throughout compression, which is advantageous for applications requiring predictable injectability. The stability of the force suggests a homogeneous internal microstructure or good particle packing, favoring flow under compression.19
The CC2 and CC3 samples exhibited distinct behaviors. For CC2, a higher initial ejection force was observed, stabilizing around 30 N along the displacement, suggesting greater initial resistance but relatively constant flow thereafter. CC3, however, showed abrupt force peaks exceeding 100 N, with sharp variations throughout compression, indicating high and non-uniform resistance. This behavior may be associated with the higher carbomer concentration (3%) in this sample, which promotes the formation of more rigid or dense networks.21
Figure 3 displays the injectability data for formulations containing vitamin C. The CC1Vit sample showed initial peaks around 30 N, followed by a gradual decrease in resistance throughout the compressive extension. This pattern suggests that, after a relatively high initial resistance, the internal structure of the gel reorganizes and allows for a more consistent flow - behavior typical of pseudoplastic systems.20

Injectability test of the samples with vitamin C, where: CC1Vit (formulation containing CMC 0.25% + vitamin C 5% + 1% Carbopol®940), CC2Vit (CMC 0.25% + vitamin C 5% + 2% Carbopol®940) and CC3Vit (CMC 0.25% + vitamin C 5% + 3% Carbopol®940)
The CC2Vit sample exhibited irregular peaks along the extension, reaching up to 25 N, indicating less stable injectability. Such fluctuations reflect variable internal resistance, possibly arising from heterogeneities in the matrix or defect points within the polymer network.22
CC3Vit, in contrast, showed the most favorable profile among the formulations studied: an initial peak around 18 N followed by an almost constant force. Compared with the other samples, CC3Vit presented the lowest mean ejection force and a relatively flat curve after the initial peak, suggesting good injectability with low resistance variation. This behavior indicates that its microstructure favors uniform flow and controlled resistance once the initial deformation is overcome.19,22
When comparing formulations with and without vitamin C, it can be observed that the presence of this component appears to contribute to a reduction in mean ejection force, particularly in the CC2Vit and CC3Vit samples. Vitamin C may act as a matrix-modifying agent for the carbomer, reducing internal density or promoting greater network uniformity, thereby facilitating flow under compression. This effect results in smoother injectability profiles and lower ejection forces, indicating a potential functional interaction between the active compound and the gel matrix.20,23
Rheological behavior
Figure 4a shows the rheological behavior study of viscosity versus shear rate for the formulations. In the formulations without vitamin C, all of them exhibit pseudoplastic behavior, meaning that viscosity decreases as the shear rate increases. This behavior is common in colloidal systems and suspensions, such as those using bentonite clays or other thickening agents, and is characteristic of cosmetic formulations or industrial products that require easy and uniform application. The reduction in viscosity with increasing shear rate is beneficial in practical contexts, as it facilitates product spreadability during application.24
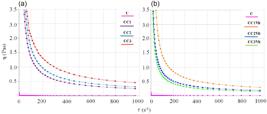
Rheological behavior of the formulations containing or not containing vitamin C nanostructured systems. h: apparent viscosity; t: shear rate. (a) C (formulation containing only CMC 0.25%), CC1 (formulation containing CMC 0.25% + 1% Carbopol®940), CC2 (CMC 0.25% + 2% Carbopol®940), CC3 (CMC 0.25% + 3% Carbopol®940); (b) CC1Vit (CMC 0.25% + vitamin C 5% + 1% Carbopol®940), CC2Vit (CMC 0.25% + vitamin C 5% + 2% Carbopol®940) and CC3Vit (CMC 0.25% + vitamin C 5% + 3% Carbopol®940)
When comparing the different curves, it can be observed that sample C (CMC) showed the lowest initial viscosity and a marked decrease along the shear rate, while samples CC1, CC2, and CC3 show progressively higher initial viscosity values, with CC3 being the highest. All samples appear to stabilize at low viscosity values after high shear rates (close to 1000 s-1), indicating a region where the shear effect on the fluid structure is reduced. This stabilization suggests that, beyond a certain shear rate, the internal structures of the fluid have been completely disrupted, reaching a state of constant viscosity.24
Formulations containing the gelling agent (Carbopol® 940) (CC1, CC2, and CC3) tend to stabilize at higher viscosity values compared to sample C, even at high shear rates. This rheological behavior in samples CC1, CC2, and CC3 suggests that, while sample C may be suitable for applications requiring low resistance to shear, the formulations with carbomer are more appropriate for products that need to maintain a certain consistency across a range of applied forces.25,26
Figure 4b shows the rheological behavior results of the formulations containing vitamin C. It can be observed that all of them exhibited pseudoplastic behavior, in which viscosity decreases as the shear rate increases, indicating that the internal structures of these formulations are broken down as the shear force increases, similar to the samples without vitamin C. This behavior is desirable in applications where the product must be easy to spread, as the reduced viscosity allows the product to flow when force is applied.27
These results indicate that the incorporation of vitamin C significantly influences the rheological behavior of the formulations, making them slightly less resistant and more stable under shear. This modification may be associated with the interaction of the active ingredient with the polymeric matrix, which promotes reorganization of the chains and reduces the intermolecular forces responsible for structural rigidity. Thus, formulations containing vitamin C exhibit better flow capacity and spreadability - desirable characteristics in topical products, as they facilitate application and promote more uniform distribution on the skin, without compromising the final consistency of the gel.28,29
Storage (G’) and loss (G”) moduli
Figure 5 shows the behavior of the storage modulus (G’) and loss modulus (G”) as a function of frequency (f) for the nanoestructured CMC formulations with or without vitamin C. The G’ axis (storage modulus) represents the elastic portion of the material, whereas G” (loss modulus) represents the viscous (plastic) portion. G’ gradually increases with frequency for all samples, indicating a more elastic response at higher frequencies. This is typical of materials with a more rigid structure that tend to store energy under rapid oscillations.30

Curves of storage (G’) and loss (G”) moduli as a function of frequency (f) for the CMC-based nanostructured formulations with or without vitamin C. (a) C (formulation containing only CMC 0.25%), CC1 (formulation containing CMC 0.25% + 1% Carbopol®940), CC2 (CMC 0.25% + 2% Carbopol®940), CC3 (CMC 0.25% + 3% Carbopol®940); (b) C (formulation containing only CMC 0.25%), CC1Vit (CMC 0.25% + vitamin C 5% + 1% Carbopol®940), CC2Vit (CMC 0.25% + vitamin C 5% + 2% Carbopol®940) and CC3Vit (CMC 0.25% + vitamin C 5% + 3% Carbopol®940)
Figure 5a shows that formulations CC1, CC2, and CC3 maintain G’ values several orders of magnitude higher than formulation C (O-carboxymethylchitosan), which may indicate an improved capacity to store elastic energy. Formulation C shows very low G’ compared to the others, suggesting a less elastic material and possibly a more fluid-like structure. G” also increases with frequency, but less sharply than G’. This indicates that energy dissipation (viscous component) occurs more slowly as frequency increases. Formulations CC1, CC2, and CC3 show higher G” values than formulation C, but the difference between G’ and G” indicates that these formulations still have an elastic predominance at higher frequencies.31
The difference between G’ and G” suggests that formulations CC1, CC2, and CC3 exhibit viscoelastic behavior, with predominance of the elastic response at high frequencies. Formulation C, with low G’ and G”, suggests a more viscous behavior at low frequencies, but tends to approach the other materials at higher frequencies, indicating a possible transition to a more elastic behavior as frequency increases. Formulations CC1, CC2, and CC3 show a more pronounced elastic response (high G’) and a greater capacity for energy dissipation (G”) than formulation C, suggesting that structural modifications in these samples may have improved these properties. The behavior of formulation C indicates a more fluid or less structured material.31
Based on the formulations C, CC1Vit, CC2Vit, and CC3Vit (Figure 5b), the analysis of the storage and loss moduli reveals differences in their viscoelastic properties. Formulation C exhibited the lowest G’ and G” values across almost the entire frequency range evaluated, indicating that it is the most flexible and least resistant to deformation. This suggests that sample C has a more open or less dense structure, resulting in a lower capacity to store and dissipate energy.32
Formulation CC1Vit, in turn, shows intermediate G’ and G” values, indicating greater rigidity and resistance compared to sample C. Meanwhile, formulations CC2Vit and CC3Vit presented the highest G’ and G” values, especially at higher frequencies. These values indicate that these samples possess a more organized and dense structure, which increases their energy storage capacity and resistance to deformation, making them more suitable for applications requiring greater rigidity and structural stability. When comparing all samples, formulation CC3Vit exhibits a progressive increase in the moduli, suggesting a modification in the composition or internal structure of each sample.30
Ultraviolet spectroscopy (UV-Vis)
The CC3Vit formulation was selected for the UV-Vis assays and the stability study due to its higher structural organization, better rheological response, and superior mechanical performance. Figure 6 presents the absorption spectra obtained for CC3Vit and its control formulations, analyzed after nanoparticle separation by ultracentrifugation, in order to quantify exclusively the fraction of free vitamin C present in the supernatant. The curve corresponding to the CC3Vit formulation shows intense peaks at 212 and 254 nm, which are characteristic of the electronic transitions of ascorbic acid, related to its conjugated enolic system.32,33 However, it is important to highlight that the 212 nm region has low specificity and high susceptibility to interference from solvents and excipients, in addition to possible band overlap. For this reason, only the 254 nm peak was considered in the interpretation of results. The increased intensity of this peak confirms the presence of non-encapsulated vitamin C in the supernatant, in accordance with the indirect method used for determining encapsulation efficiency.34,35

UV-Vis spectra of the formulations containing nanostructured systems of CMC only (C), CMC + Carbopol®940 + vitamin C (CC3Vit), CMC + and Carbopol®940 (CC3) and CMC + vitamin C (CVit)
At this point, it is observed that the CC3Vit formulation showed an encapsulation efficiency of 87%. This result is consistent with hydrophilic polymeric systems capable of retaining the active compound through physical interactions, ensuring efficient encapsulation without completely preventing the detectable release of the compound. The presence of only a residual fraction in the supernatant reinforces the ability of the CMC/Carbopol® 940 matrix to accommodate and protect vitamin C, favoring subsequent controlled release.36 The curve of the CVit formulation (CMC + vitamin C), analyzed under the same conditions, also exhibits peaks at 212 and 258 nm, but with lower absorbance, reflecting the difference in structural interaction between the active compound and the polymeric matrix. The slight shift observed in the peak at 254-258 nm may be associated with alterations in the microenvironment of the active compound, since CMC contains carboxylated groups capable of interacting via hydrogen bonding or weak electrostatic interactions. This behavior is consistent with previous descriptions of modified chitosan-based systems containing vitamin C.37
The CC3 formulation (CMC + Carbopol® 940 without vitamin C), on the other hand, shows low absorbance and the absence of defined peaks in the 240-300 nm region, confirming that the matrix excipients do not interfere with the characteristic signal of vitamin C. This aspect is essential, as it demonstrates that the supernatant reading reflects exclusively the free fraction of the active compound, without band overlap originating from the polymers. The isolated CMC solution displays an even more discrete spectrum, with no significant bands in the UV region, corroborating that CMC does not contain relevant chromophores within this wavelength range. Likewise, Carbopol® 940 exhibits no significant UV absorption, reinforcing the appropriateness of the methodological approach and the absence of spectral interference from the excipients.37
The results obtained support the interpretation that the CMC/Carbopol® 940 matrix interacts with vitamin C, but without significantly altering its fundamental electronic properties. The reduced signal intensity in the supernatant after encapsulation, when compared to the free active compound solution, is consistent with its partial retention within the nanostructured matrix, reflecting the experimentally obtained encapsulation efficiency.38
The consistency among the curves of the different formulations, the absence of polymer interference in the active compound’s signal, and the reproducibility of the λmax confirm the suitability of the indirect method based on ultracentrifugation for quantifying free vitamin C in hydrosoluble nanoparticulate systems.
Cytotoxicity study
According to ISO 10993-5:2009,13 materials that exhibit cell viability greater than 70% relative to the negative control are considered non-cytotoxic and can therefore be classified as biocompatible. All samples showed cell viability above 90% (Figure 7), indicating the absence of cytotoxicity and compatibility with murine fibroblasts. The control formulation (CMC 0.25%) displayed values close to 100%, while the formulations containing vitamin C (CC1Vit, CC2Vit, and CC3Vit) maintained similarly high viabilities, demonstrating that incorporation of the active compound did not compromise the biological safety of the polymeric matrix. These findings are consistent with systems based on modified chitosan, which have been described in the literature as intrinsically biocompatible materials due to their polysaccharide structure and low cellular reactivity.
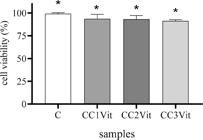
Cell viability of gels containing the CMC nanostructured system. C (formulation containing only CMC 0.25%), CC1Vit (CMC 0.25% + vitamin C 5% + 1% Carbopol®940), CC2Vit (CMC 0.25% + vitamin C 5% + 2% Carbopol®940) and CC3Vit (CMC 0.25% + vitamin C 5% + 3% Carbopol®940). Groups marked with different symbols indicate statistically significant differences (p < 0.05)
The high cell viability observed for all formulations reinforces the potential for topical application of the developed nanostructured systems, as materials intended for cutaneous use must be compatible with resident connective tissue cells such as fibroblasts. Furthermore, the results demonstrate that the presence of vitamin C did not induce adverse alterations in cellular response, maintaining the safety profile of the O-carboxymethyl chitosan matrix.38
Stability study
To complement the physicochemical characterization of the formulations and assess their robustness over time, a stability study was conducted focusing on the colloidal behavior of the selected nanoformulation (CC3Vit). This step is essential to confirm whether critical quality attributes - such as average particle diameter, PDI, and zeta potential - remain within the values obtained in this study, thereby ensuring the maintenance of the system’s functional properties. Thus, the study aimed to evaluate possible changes in these variables over 90 days at 25 °C, providing evidence of the stability of the chosen formulation and ensuring logical continuity with the previous development and characterization steps. Particle size is related to the stability and skin penetration capacity of the system, as nanoscale dimensions tend to favor controlled release of active compounds. The PDI indicates the degree of particle homogeneity, where values close to zero represent a more uniform distribution and therefore greater stability. Zeta potential (ZP), in turn, reflects the surface charge and electrostatic repulsion between particles. High ZP values (positive or negative) indicate greater colloidal stability, reducing the tendency toward aggregation over time.5
The results presented in Table 1 show the average particle diameters, PDI, and zeta potential values obtained by DLS over the 90-day period. The average particle diameter remained relatively constant over time, with only minor variations. On day 1, the mean diameter was 357.28 ± 10.85 nm; by day 15 (305.43 ± 22.64 nm), a reduction in particle size was observed. On day 30, the mean diameter was 347.04 ± 11.03 nm, and finally, at 90 days, 320.81 ± 7.51 nm, returning to values close to those initially observed. The slight initial decrease in particle size may be attributed to a process of particle reorganization or compaction, commonly observed in some nanoparticle formulations. Although differences between time points were statistically significant, the values remain very close in absolute terms, and not sufficient to characterize physical instability or meaningful alteration in particle size. Such minor variations are common in nanostructured systems and may be related to superficial reorganization or particle compaction during storage, without causing any relevant impact on the formulation’s integrity. This behavior is considered acceptable and indicative of good colloidal stability, as small fluctuations in average size (< 15%) do not constitute instability in nanoparticulate systems.33
Mean particle diameter and polydispersity obtained by dynamic light scattering (DLS) over a 90-days period
The PDI values (Table 1) ranged from 0.24 ± 0.055 to 0.22 ± 0.004 over the 90-day period, indicating a moderately narrow size distribution that is still relatively homogeneous, consistent with the behavior observed for the mean particle diameter. As with particle size, the PDI showed only small numerical fluctuations, with no significant changes indicating system instability. These results, together with the maintenance of the mean diameter, indicate that the nanoparticle formulation (CC3Vit) remained stable throughout the study period, with no tendency toward aggregation or sedimentation, which is desirable for controlled-release systems and topical applications.38
The zeta potential results (Table 1) showed negative values, with means ranging from -3.19 mV on the first day, -4.92 mV on day 15, -6.95 mV on day 30, and finally -6.95 mV on day 90. Zeta potential is a measure of the electrical surface charge of the particles and influences the colloidal stability of nanoparticles in solution.39 Over the study period, a slight increase in the magnitude of the zeta potential could be observed.
The negative charge of the zeta potential can be attributed to the presence of carboxyl groups in the polymer that forms the nanoparticle surface. These carboxyl groups ionize at neutral pH, conferring a negative charge to the particles. In addition, the use of CaCl2 as a crosslinker may also influence the surface charge, contributing to the negative zeta potential observed. The increase in zeta potential may indicate a modification of the nanoparticle surface or interactions with the dispersion medium. Stabilization at a higher magnitude over time is a positive indicator for formulation stability, since particles with zeta potential values close to zero tend to aggregate more easily. Thus, the values observed suggest that the system becomes more stable over time, which is advantageous for applications requiring a long-lasting and homogeneous dispersion.5
CONCLUSIONS
Based on the results obtained, it can be concluded that the incorporation of vitamin C into CMC nanoparticles in gel exhibits adequate safety and stability for potential topical application. The formulation demonstrated satisfactory colloidal stability, with a homogeneous particle distribution and PDI remaining stable throughout the study period, indicating a system with low tendency for aggregation. Furthermore, rheological analysis revealed pseudoplastic behavior, with appropriate viscosity and favorable shear response, facilitating the spreadability and absorption of the gel on the skin. The presence of vitamin C did not compromise the rheological properties, showing compatibility with the CMC matrix. In addition, cytotoxicity assays demonstrated that the formulation is safe and biocompatible with the skin.
Therefore, the CMC and vitamin C nanoparticle gel exhibits promising physical and chemical characteristics aligned with the requirements of stable topical formulations, indicating its potential for future applications in skin care treatments.
DATA AVAILABILITY STATEMENT
All data are available within the text.
REFERENCES
-
1 Stanescu, C.; Chiscop, I.; Mihalache, D.; Popa, F.; Tamas, C.; Stoleriu, G.; Nutrients 2025, 17, 2596. [Crossref]
» Crossref -
2 Gupta, V.; Mohapatra, S.; Mishra, H.; Farooq, U.; Kumar, K.; Ansari, M. J.; Aldawsari, M. F.; Alalaiwe, A. S.; Mirza, M. A.; Iqbal, Z.; Gels 2022, 8, 173. [Crossref]
» Crossref -
3 Mascarenhas-Melo, F.; Araújo, A. R. T. S.; Rodrigues, M.; Mathur, A.; Gonçalves, M. B. S.; Tanwar, K.; Heidarizadeh, F.; Nejaddehbashi, F.; Rahdar, A.; Mazzola, P. G.; Veiga, F.; Paiva-Santos, A. C.; Cosmetics 2023, 10, 68. [Crossref]
» Crossref -
4 Martins, R. M.; Martins, S. S.; Barbosa, G. L. F.; Silva, E. G. N.; Fonseca, M. J. V.; de Freitas, L. A. P.; J. Drug Delivery Sci. Technol. 2023, 88, 104860. [Crossref]
» Crossref -
5 Silva, E. G. N.; Barbosa, G. L. F.; Confessor, M. V. A.; de Sousa, W. J. B.; Fook, M. V. L.; Siqueira-Júnior, J. P.; de Freitas, L. A. P.; Martins, R. M.; J. Drug Delivery Sci. Technol. 2023, 90, 105164. [Crossref]
» Crossref -
6 Galdino, T. P.; de Oliveira, L. C.; Lima, E. P. N.; Farias, R. Í. R.; de Jesus, R. A.; de Queiroz, S. F. A. M.; Santos, A. C. Q.; Fook, M. V. L.; Research, Society and Development 2022, 11, e5011527634. [Crossref]
» Crossref -
7 Chen, L.; Xie, Y.; Chen, X.; Li, H.; Lu, Y.; Yu, H.; Zheng, D.; Int. J. Biol. Macromol. 2024, 275, 133465. [Crossref]
» Crossref -
8 Bańkosz, M.; Materials 2024, 17, 5502. [Crossref]
» Crossref -
9 Stavropoulou, A. P.; Theodosiou, M.; Sakellis, E.; Boukos, N.; Papanastasiou, G.; Wang, C.; Tavares, A.; Corral, C. A.; Gournis, D.; Chalmpes, N.; Gobbo, O. L.; Efthimiadou, E. K.; Colloids Surf., B 2022, 214, 112463. [Crossref]
» Crossref -
10 Chen, X.-G.; Park, H.-J.; Carbohydr. Polym. 2003, 53, 355. [Crossref]
» Crossref -
11 de Souza, M. F.; da Silva, H. N.; Rodrigues, J. F. B.; Macêdo, M. D. M.; de Sousa, W. J. B.; Barbosa, R. C.; Fook, M. V. L.; Polymers 2023, 15, 603. [Crossref]
» Crossref -
12 Kowsari, K.; Lu, L.; Persak, S. C.; Hu, G.; Forrest, W.; Berger, R.; Givand, J. C.; Babaee, S.; J. Pharm. Sci. 2024, 113, 3525. [Crossref]
» Crossref - 13 ISO 10993-5:2009: Biological Evaluation of Medical Devices - Part 5: Tests for in vitro Cytotoxicity; International Organization for Standardization, Geneva, 2009.
-
14 Campanale, C.; Savino, I.; Massarelli, C.; Uricchio, V. F.; Polymers 2023, 15, 911. [Crossref]
» Crossref -
15 Li, Y.; Zhang, J.; Jin, H.; Liu, H.; Wang, Y.; Spectrochim. Acta, Part A 2016, 165, 61. [Crossref]
» Crossref -
16 Vilimi, Z.; Pápay, Z. E.; Basa, B.; Orekhova, X.; Kállai-Szabó, N.; Antal, I.; Gels 2024, 10, 464. [Crossref]
» Crossref -
17 Wang, E.; Qi, Z.; Cao, Y.; Li, R.; Wu, J.; Tang, R.; Gao, Y.; Du, R.; Liu, M.; Pharmaceutics 2025, 17, 249. [Crossref]
» Crossref -
18 Barreiro Carpio, M.; Gonzalez Martinez, E.; Dabaghi, M.; Ungureanu, J.; Arizpe Tafoya, A. V.; Gonzalez Martinez, D. A.; Hirota, J. A.; Moran Mirabal, J. M.; ACS Appl. Mater. Interfaces 2023, 15, 54234. [Crossref]
» Crossref -
19 Robinson, T. E.; Hughes, E. A. B.; Eisenstein, N. M.; Grover, L. M.; Cox, S. C.; J. Visualized Exp. 2020, 159, e61417. [Crossref]
» Crossref -
20 Chen, M. H.; Wang, L. L.; Chung, J. J.; Kim, Y.-H.; Atluri, P.; Burdick, J. A.; ACS Biomater. Sci. Eng. 2017, 3, 3146. [Crossref]
» Crossref -
21 Martins, R. M.; Martins, S. S.; Barbosa, G. L. F.; Fonseca, M. J. V.; Rochette, P. J.; Moulin, V. J.; de Freitas, L. A. P.; J. Microencapsulation 2022, 39, 668. [Crossref]
» Crossref -
22 Malkin, A. Y.; Derkach, S. R.; Kulichikhin, V. G.; Gels 2023, 9, 715. [Crossref]
» Crossref -
23 Biermann, T.; Mesecke, L.; Teves, S.; Ziesche, I.; Lachmayer, R.; Materials 2025, 18, 3164. [Crossref]
» Crossref -
24 Martins, R. M.; Siqueira, S.; Fonseca, M. J. V.; Freitas, L. A. P.; J. Microencapsulation 2014, 31, 644. [Crossref]
» Crossref -
25 Stojkov, G.; Niyazov, Z.; Picchioni, F.; Bose, R. K.; Gels 2021, 7, 255. [Crossref]
» Crossref -
26 Barrulas, R. V.; Corvo, M. C.; Gels 2023, 9, 986. [Crossref]
» Crossref -
27 Roca-Arroyo, A. F.; Gutierrez-Rivera, J. A.; Morton, L. D.; Castilla Casadiego, D. A.; Gels 2025, 11, 588. [Crossref]
» Crossref -
28 Ramezanli, T.; Michniak-Kohn, B. B.; Mol. Pharmaceutics 2018, 15, 3813. [Crossref]
» Crossref -
29 Pârvănescu, R.; Trandafirescu, C.; Musuc, A. M.; Ozon, E. A.; Culita, D. C.; Mitran, R. A.; Stănciulescu, C.-I.; Şoica, C.; Gels 2025, 11, 532. [Crossref]
» Crossref -
30 Saha, D., Bhattacharya, S.; J. Food Sci. Technol. 2010, 47, 587. [Crossref]
» Crossref -
31 Zamboulis, A.; Nanaki, S.; Michailidou, G.; Koumentakou, I.; Lazaridou, M.; Ainali, N. M.; Xanthopoulou, E.; Bikiaris, D. N.; Polymers 2020, 12, 1519. [Crossref]
» Crossref -
32 Monfared-Hajishirkiaee, R.; Ehtesabi, H.; Rezaei, A.; Najafinobar, S. J.; Ind. Eng. Chem. 2023, 126, 382. [Crossref]
» Crossref -
33 Nawaz, A.; Latif, M. S.; Alnuwaiser, M. A.; Ullah, S.; Iqbal, M.; Alfatama, M.; Lim, V.; Gels 2022, 8, 412. [Crossref]
» Crossref -
34 Khuntia, A.; Mitra, J.; Food Chem. 2024, 458, 140257. [Crossref]
» Crossref -
35 Caritá, A. C.; de Azevedo, J. R.; Chevalier, Y.; Arquier, D.; Buri, M. V.; Riske, K. A.; Leonardi, G. R.; Bolzinger, M.-A.; Int. J. Pharm. 2023, 638, 122897. [Crossref]
» Crossref -
36 Sun, J.; Wei, Z.; Xue, C.; Food Packag. Shelf Life 2023, 37, 101073. [Crossref]
» Crossref -
37 Yin, X.; Chen, K.; Cheng, H.; Chen, X.; Feng, S.; Song, Y.; Liang, L.; Antioxidants 2022, 11, 153. [Crossref]
» Crossref -
38 Danaei, M.; Dehghankhold, M.; Ataei, S.; Davarani, F. H.; Javanmard, R.; Dokhani, A.; Khorasani S.; Mozafari, M. R.; Pharmaceutics 2018, 10, 57. [Crossref]
» Crossref -
39 Pochapski, D. J.; dos Santos, C. C.; Leite, G. W.; Pulcinelli, S. H.; Santilli, C. V.; Langmuir 2021, 37, 13379. [Crossref]
» Crossref
Edited by
-
Executive Editor handled this article:
Júlio S. Rebouças


