
 SURFACE-ENHANCED RAMAN SCATTERING SPECTROSCOPY OF THE NEONICOTINOID PESTICIDES IMIDACLOPRID AND THIAMETHOXAN ON SILVER NANOPARTICLES
Abstract
This study investigated the vibrational properties and adsorption geometries of the neonicotinoids imidacloprid (IMD) and thiamethoxam (THX) on silver nanoparticles (AgNP) through surface-enhanced Raman scattering (SERS) combined with density functional theory (DFT) calculations, providing critical insights into the chemical interactions between pesticides and metallic surfaces. Crucially, the vibrational assignment was meticulously performed using the potential energy distribution (PED) calculated based on DFT calculations, resulting in an exceptionally detailed molecular attribution. The Raman and SERS spectra of IMD and THX were analyzed, revealing preferentially enhanced bands associated with specific molecular groups in SERS. The SERS enhancement of normal modes involving the nitro and 1,3,5-oxadiazinan-4-ylidene groups for THX, as well as the nitro and 4,5-dihydroimidazole groups for IMD, demonstrated their preferential adsorption geometries on AgNP surfaces. DFT simulations helped to elucidate the molecular anchoring mechanisms, highlighting charge transfer effects between the pesticides and silver atoms. Furthermore, distinct IMD:THX mixtures confirmed the ability of SERS to distinguish between the two compounds, showcasing the applicability of the SERS technique in analyzing complex systems. The findings emphasize the potential of SERS spectroscopy as a rapid, cost-effective, and sensitive analytical tool for detecting neonicotinoid residues.
Keywords:
insecticides; simultaneous analyses; surface chemistry; density functional theory
INTRODUCTION
Neonicotinoids are a group of pesticides that present nicotine-derived systemic structures, which target nicotinic acetylcholine receptors – Na+ / K+ ionophores of the insect central nervous system. Such groups include imidacloprid, thiacloprid, nitenpyram, acetamiprid, thiamethoxam, clothianidin, and dinotefuran.1 These substances were considered substitutes for some pesticide classes, such as organophosphates and carbamates, as they offered advantages and remarkable chemical and biological properties, including relatively low mammalian toxicity and high insect-targeting efficacy.2,3 However, such compounds are persistent in the environment, and their toxicity to insects has strongly adverse effects on non-targeted pollinators such as bees. According to the Food and Agriculture Organization of the United Nations (FAO),4 the use of insecticides in 2021 accounted for about 22% of all pesticides used as agricultural or domestic sanitizers, reflecting the consumption of five tons of these compounds worldwide.
An important neonicotinoid pesticide is imidacloprid (IMD), Figure 1, which is part of the first generation of this group. Introduced commercially in 1991, IMD is the most widely used neonicotinoid worldwide in agriculture and veterinary applications due to its high insecticide efficacy.5,6 Another neonicotinoid pesticide is thiamethoxam (THX), Figure 1, also called thianicotinyls, which was introduced in 1998, and belongs to the second generation of neonicotinoids.2,3 The World Health Organization (WHO) classified IMD and THX as moderately hazardous pesticides and maximum residue limits allowed in fruit and vegetable samples have been established between 0.01 and 0.9 mg kg–1 for IMD and THX, respectively, according to the European Union.4,7 The values are low, so it is essential to monitor the residues using sensitive and specific techniques. The most used techniques in residue detection are liquid chromatography and gas chromatography, both coupled with mass spectrometry.8,9 Such techniques, although sensitive and specific enough to detect both substances within the allowed limit, require a long time for sample preparation and analysis, incur significant operational costs, and do not allow in situ detection.

Surface-enhanced Raman scattering (SERS) spectroscopy is a promising non-invasive technique that offers several advantages over conventional methods, such as faster analysis, simpler sample preparation, in situ sampling capabilities, potential for portable instruments, and comparatively lower operational costs. SERS spectroscopy is the most efficient technique for detecting substances at submonolayer concentration levels, adsorbed on the surface of coinage metals (Au, Ag, and Cu) plasmonic nanostructures, commonly referred to as SERS substrates. Silver nanoparticles (AgNP), usually in colloidal form, have been the most used SERS substrates over the decades,10 which encouraged the development of several synthesis methods with different sizes and shapes.11,12 The versatility of the SERS tool has garnered considerable interest due to its broad utility and remarkable potential for spanning areas as environmental analysis and food safety.13,14
It should also be noted that understanding the specific interaction between the adsorbates and the nanostructured surface is crucial for interpreting the experimental spectra and identifying routes to optimize analytical approaches for detecting SERS effects using highly efficient substrates.15
The SERS effect has been used previously to identify neonicotinoid residues, among other pesticides, in several studies reported in the literature. For instance, Dowgiallo and Guenther8 used nanostructured gold substrates to identify 21 pesticides by SERS, including THX and IMD, obtaining a limit-of-detection from 1 ppb to 10 ppm. Creedon et al.16 showed SERS analyses with nanomolar limits of detection for IMD and clothianidin using a substrate based on AgNP and polyvinylidene fluoride (PVDF) polymer. Gao et al.9 developed a superhydrophobic SERS substrate based on AuNP and SiO2 / PDMS / Ti3C2 to detect neonicotinoids in real food samples such as grains and tea. At the same time, Pham et al.17 used an Ag-AgNP / PDMS substrate for the SERS detection of IMD, carbaryl, and acephate in mango samples. An AuNP-modified magnetic molecularly imprinted polymer was used by Chi et al.18 to detect the neonicotinoids acetamiprid and thiacloprid in fruit samples.19 In summary, several studies highlight the outstanding potential of SERS spectroscopy in detecting pesticides or other organic contaminants in environmental and food samples. To expand the understanding of the SERS spectra of pesticides through vibrational assignments and their matching with proposals for molecular adsorption sites on metallic structures, density functional theory (DFT) calculations are the best choice. Several studies2,16,20,21 in the literature have presented DFT calculations for pesticide molecules without Ag or Au atoms or clusters. Gao et al.22 computed the vibrational frequencies of Ag3(THX) complex using DFT methods at B3LYP/6-311++G(d,p)/LanL2DZ(Ag) level of theory. Therefore, it is still necessary to perform a reliable vibrational assignment and propose an adsorption geometry for both pesticides, based on larger model clusters.
In the present work, the vibrational characterization of the insecticides IMD and THX was investigated using Raman spectroscopy in both solid and aqueous phases, as well as by SERS spectroscopy for the pesticides interacting with AgNP surfaces. The SERS analyses also included mixtures of IMD and THX at different proportions to assess the simultaneous detection of both compounds, which was successfully demonstrated in this study. The vibrational assignment of Raman and SERS spectra was performed using DFT calculations on pesticide molecules and their interaction with a ten-silver atom cluster model for the surface complexes, Ag10(IMD) and Ag10(THX), improving over previous models in the interaction modeling capability due to more available interaction spots. The PED (potential energy distribution) was calculated to support the assignment of both the Raman and SERS bands, allowing the vibrational assignment, marking a significant methodological differential for the present study. The interpretation of the experimental SERS data and the DFT data also allowed us to infer the possible molecular moieties responsible for molecular anchoring on the AgNP surface and propose adsorption geometries for both pesticides on the silver surface.
EXPERIMENTAL
Materials
The following substances were used: IMD (N-{1-[(6-chloro-3-pyridyl)methyl]-4,5-dihydroimidazol-2-yl}nitramide, ≥ 98%, Sigma-Aldrich), THX (N-[3-[(2-chloro-1,3-thiazol-5-yl)methyl]-5-methyl-1,3,5-oxadiazinan-4-ylidene]nitramide, 98%, Sigma-Aldrich), silver nitrate (≥ 99.99%, Sigma-Aldrich), sodium borohydride (≥ 99%, Sigma-Aldrich), hydrochloric acid (37%, Dinâmica). Glassware was cleaned using fresh aqua regia and copiously washed with deionized water. All reactants were used without any further purification. All solutions were freshly prepared with deionized water (18.2 MΩ cm resistivity at 25 °C) from a Millipore Synergy UV system.
Instrumentation
Ultraviolet-visible (UV-Vis) extinction spectra were collected using an Ocean Optics UBS2000+ spectrometer, operating from 190 to 2200 nm. The spectra were collected in quartz cuvettes with an optical path of 0.5 cm. The Raman and SERS spectra were collected in a Bruker SENTERRA Raman spectrometer coupled to an Olympus BX51 optical microscope, with a 50× long-distance working objective (numerical aperture (NA) = 0.51) and excitation with the 632.8 nm laser line from a He–Ne laser. The samples were subjected to 20 mW laser power and 60 s accumulation time to acquire Raman and SERS spectra.
Synthesis of AgNP
AgNP were prepared based on the synthesis reported by Creighton et al.23 with some modifications proposed by Emonds-Alt et al.24 Briefly, in an ice bath, 50.0 mL of a 2.5 × 10⁻³ mol L–1 AgNO3 aqueous solution was added dropwise to 150.0 mL of 2.0 × 10⁻³ mol L–1 NaBH4 aqueous solution. The mixture was stirred vigorously for 30 min. The extinction spectrum is shown in Figure 1S (Supplementary Material). Next, before the SERS analysis, the AgNP suspension was centrifuged at 6000 rpm for 30 min, the supernatant was removed, and the concentrated nanoparticles were used in SERS measurements. The experimental spectra were subjected to baseline correction using the ALS (asymmetric least squares) method.
SERS experiments
For SERS measurements, 180 µL of AgNP suspension was added to a vessel, followed by 20 µL of a 1.0 × 10⁻³ mol L–1 pesticide aqueous solution. To study THX, it was necessary to add 10 µL of a 1.0 mol L–1 HCl to the resulting suspension to induce AgNP aggregation and obtain a high signal-to-noise ratio in the SERS spectra. The pKa of thiamethoxam reported by Valadbeig25 is lower than the pH of the AgNP solution containing thiamethoxam and HCl; therefore, the neutral species is predominant under the experimental conditions. For the pesticide mixture, solutions were prepared in proportions 1:1, 1:3, and 3:1 (IMD:THX), with a concentration of 1.0 × 10⁻⁴ mol L–1. Subsequently, a 20 µL aliquot of this mixture was added to 180 µL of AgNP suspension. All experiments were conducted in the liquid phase, which allows for better heat dissipation and minimizes thermal degradation
Computational details
Quantum mechanical calculations based on the density functional theory (DFT) were performed using Gaussian 09 and GaussView 5.0 packages.26 To select the functional that best describes the system, the IMD Raman spectra were calculated from optimized structures from different functional / basis set levels. The results are presented in Figure 2S (see the Supplementary Material); the primary selection criterion was the similarity of the calculated Raman spectra to the experimental Raman spectrum of IMD. Based on that criterion, the Perdew-Burke-Ernzerhof (PBE) exchange-correlation functional27,28 and the 6-31+G(2df) Pople basis set29 were selected for all atoms, except for the silver atoms, which were described using the LANL2DZ effective core potential basis set.30 In all calculations, the self-consistent reaction field (SCRF) integral equation formalism continuum polarizable model (IEFPCM) method was employed to simulate solvation, configured with dielectric constant parameters for water.31 Alternative adsorption models between the Ag10 cluster and the molecules were studied. The theoretical spectrum, along with the HOMO (highest occupied molecular orbital) and LUMO (lowest unoccupied molecular orbital) of the optimized structure, are presented in Figure 3S (Supplementary Material). However, the calculated Raman spectrum differed significantly from the experimental one, and this model was therefore discarded. Adsorption structure of THX via the nitrogen atom was also proposed; however, during optimization, it rotated and converged to the lowest energy configuration with bonding through the oxygen atoms of the nitro group.
All Cartesian coordinates of optimized structures are shown in Tables 1S-5S in the Supplementary Material, and the optimized geometries of IMD and THX are shown in Figure 2.

It should be mentioned that the Ag10 cluster was chosen for the SERS studies because recent research32,33 indicates that a 10-atom cluster is large enough to support the approximation of plasmon oscillation, yet small enough to ensure sufficient symmetry to retain the clearly defined excited states of the molecule-metal system. The adsorption configuration was studied; for example, Figure 3S presents the calculated Raman spectrum of the Ag10(IMD) complex assuming adsorption via the nitrogen atom of the pyridinic moiety. In this configuration, the calculated Raman spectrum differed significantly from the experimental spectrum; other adsorption configurations resulted in reorientation during optimization, leading to configurations that tended towards the most stable configuration. Similar results were obtained for TMX. The presented configurations were selected based on the configuration that resulted in the minimum energy for the model complexes, as well as the best reproduction of the Raman spectra.
The HOMO and LUMO frontier molecular orbitals (FMO), and molecular electrostatic potential (MEP) surfaces were constructed using time-dependent DFT (TD-DFT) at the same level of theory used in the optimization of the model complexes Ag10(IMD) or Ag10(THX), i.e., PBE/6-31+G(2df), LANL2DZ. All surfaces were generated using isovalues of 2.0 × 10⁻² e Å–3 and spin density of 4.0 × 10⁻⁴ e Å–3. The distance of charge separation between the HOMO and LUMO states was calculated based on the differences in partial atomic charges between the ground and excited states, according to the charge transfer model proposed by Jacquemin et al.34 The change in Mulliken charge baricenter in the transition, dCT, was calculated and compared to the values obtained for organic dyes. For the Ag10(IMD) complex, the dCT value obtained was 2.15, while for the Ag10(THX) complex, it was 3.86. These values indicate a significant transfer charge in the HOMO-LUMO transition considered in the present study. The calculations are presented in the Supplementary Material.
Harmonic frequencies were calculated at the same level of theory by diagonalizing the Hessian matrix in internal coordinates and were used to characterize all structures as minimum points on the potential energy surface. After calculation of vibrational wavenumbers (, cm–1) and Raman activities (Ai, Å4 amu–1), the Raman intensities of the normal modes, Ii, were obtained using Equation 1:35
where α is a constant (10–12), is the laser wavenumber (cm–1), h is the Planck constant (6.6261 × 10⁻³⁴ J s), c is the speed of light in vacuum (2.9980 × 1010 cm s–1), kB is the Boltzmann constant (1.3806 × 10⁻²³ J K–1) and T is the temperature (298.15 K). The full-width at half maximum of Raman and SERS bands was set to 10 and 24 cm–1, respectively. The frequencies were scaled by a factor of 0.9925, based on a literature suggestion.36 All spectra were assigned using the Vibrational Energy Distribution Analysis 4x (VEDA 4x) software,37 and the normal mode was observed in GaussView 5.0 software26 when necessary. PED analysis results in the calculation of the contribution of each internal coordinate in the superposition of the local mode coordinates.37
RESULTS AND DISCUSSION
SERS has been studied to develop detection strategies for both IMD and THX, primarily based on characteristic bands observed during optimization. A comparison between the characteristic experimental frequencies of IMD8,9,16,19,38,39 and THX9,22,40,41 reported in representative studies in several SERS substrates, comprised both of Ag and Au nanostructures, and the experimental frequencies observed in this work are presented in the Supplementary Material (Tables 8S and 9S). The frequencies are similar, with minute variations that can be attributed to the different SERS substrates used. In particular, the study by Gao et al.22 on thiamethoxam showed strong similarity in band positions, possibly due to the use of AgNP, although the authors used citrate as the reducing and protecting agent, while the present study used borohydride as the reducing agent. Other studies3,5,8,16,22,38-41 on IMD and THX showed larger discrepancies, which are associated with the use of more complex substrates and nanoparticles that have different protecting agents, which may influence both band positions and relative intensities. It is also worth noting that these studies focused on optimizing detection strategies and generally did not provide detailed vibrational assignments, which further highlights the contribution of the present study.
Raman and SERS of IMD
Figure 3 shows the solid-phase Raman spectrum and the SERS spectrum of IMD in borohydride reduction based AgNP colloidal suspension. It is worth mentioning that the choice of AgNP was based on the relative lability of the borate protective layers compared to other substances, such as citrate. The use of less labile protective layers resulted in interference in the SERS spectra of IMD. Table 1 shows the assignment of selected Raman and SERS bands (the complete assignment is presented in Tables 6S in the Supplementary Material) based on the PED calculated for the DFT-optimized structure. It should be mentioned that the standard deviation of the calculated frequencies relative to the experimental observation was determined, and the values obtained did not exceed an average of 6% (Table 6S).
Assignment of Raman and SERS bands of IMD based on the PED distribution calculated for the optimized structure

(a) Raman spectra of IMD in solid-phase, and (b) SERS spectrum of IMD in AgNP colloidal suspension
The solid-phase Raman spectrum in Figure 3a presents the highest intensity band at 1484 cm–1, assigned to δ(HCC) + δ(HCH) of the imidazole group. Several other bands of medium relative intensity were observed at 1583, 1566, 1372, 1278, 1110, 1000, 817, 752, and 476 cm–1, which were assigned to pyridine, imidazole, and nitro moieties (Table 1). The SERS spectrum of IMD in Figure 3b presents high-intensity bands at 1458, 1110, 1033, 908, and 828 cm–1. It may be noticed in the SERS spectrum of IMD a tendency to a preferential enhancement of bands at wavenumbers higher than 800 cm–1.42,43 This enhancement may be associated with the surface-selection rules for SERS, and indicate that mostly in-plane vibrational modes are enhanced for the compound. The most intense SERS band, at 1458 cm–1, was assigned to δ(HCH) + δ(HCH) of the 4,5-dihydroimidazole group, suggesting that, considering surface selection rules, the plane of this ring is oriented perpendicular to the Ag surfaces.44,45 The band at 1110 cm–1 is assigned to δ(HCC) + ν(NC) from the pyridine moiety, the band at 908 cm–1 is assigned to ν(NN) + ν(ON) of the nitro group. The selective enhancement of the above bands suggests that pyridine and nitro moieties are involved in the interactions with AgNP surfaces. Figure 4S (Supplementary Material) presents the displacement vectors for the 1459, 1110, and 716 cm–1 modes, which shows large components perpendicular to the metallic cluster, which further supports the above interpretation of the molecular orientation on the AgNP surface.
The SERS band at 1034 cm–1 in Figure 3b has no obvious counterpart, neither in the IMD solid-phase Raman spectrum (Figure 3a) nor in the DFT-simulated spectrum (shown in Figure 7S). However, it is well established in the literature46,47 that pyridinic moieties present a substantial shift in the breathing mode associated with the coordination of the pyridinic-N with the metallic surface. Thus, the observation of this band may be associated with the interaction of the pyridine ring with AgNP and related to the pyridine breathing mode, initially placed at 1000 cm–1 in the solid-phase Raman and SERS spectra, respectively. SERS bands assigned to the antisymmetric stretching mode νas(NO2) at 1526 and 1486 cm–1 were observed, while those assigned to symmetric stretching mode νs(NO2) at 1291 and 1216 cm–1 presented very low enhancement. Other SERS bands related to the nitramide group (R–NNO2), such as those observed at 748 and 420 cm–1, presented low enhancement or were not observed in the SERS spectrum.
Figure 4a shows the MEP map of the isolated IMD structure. The MEP provides a charge density map, indicating the most probable interaction of the pesticide with a point charge.48 Different colors represent the varying values of electrostatic potential at the surface. The color gradient ranges from red to blue, indicating regions of most negative to most positive electrostatic potential, respectively, while green represents regions of potential close to zero. It may be observed in Figure 4a that the nitro group of IMD presents the most negative potential region of the structure.

Figure 4b shows the HOMO and LUMO frontier orbitals of the Ag10(IMD) complex. The HOMO presented the electron density primarily located on the silver cluster. However, the LUMO shows an electron distribution over the conjugated system that connects the dihydroimidazole and nitramide groups, and a smaller portion on the pyridinic group. The observation of charge transfer (CT) in the Ag10(IMD) complex suggests that chemical enhancement plays a significant role in the IMD SERS spectra. CT also helps to understand the striking changes in relative intensities in the IMD SERS spectrum compared to the Rama spectrum. The changes related to the chemical interaction complement the discussion above on surface selection rules, as shifts in bands assigned to the pyridinic ring (discussed previously) may be associated with the chemical interaction resulting in the CT state. The dCT value was calculated,36 obtaining a value of 2.15, which indicates significant charge transfer between the Ag atoms and adsorbed IMD.
Raman and SERS of THX
Figure 5 shows the experimental Raman spectra in solid-state and SERS spectra of THX. Table 2 presents the vibrational assignment of Raman and SERS bands in the region between 1800 and 400 cm–1 based on the PED calculated vibrational modes taking from the DFT-optimized structure. The complete band assignments and the standard deviation of the calculated frequencies relative to the experimental values are provided in Table 7S (Supplementary Material). The Raman spectrum presents high-intensity bands at 1465, 963, 759, and 692 cm–1. The band at 1415 cm–1 is assigned to the ν(ON) of the nitro group + δ(CH2) of the methyl group linked to the 1,3,5-oxadiazinan-4-ylidene moiety. The band at 963 cm–1 is assigned to the ν(NN). The band at 759 cm–1 is assigned to the γ(ONON) of the nitramide + ν(SC) of the thiazole ring + δ(CCN) of the nitrogen of the 1,3,5-oxadiazinan-4-ylidene.
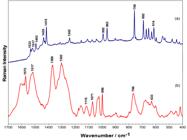
(a) Raman spectra of THX in solid-phase and (b) SERS spectrum of THX in AgNP colloidal suspension
Assignment of Raman and SERS bands of THX based on the PED distribution calculated for the optimized structure
The bands at 1368, 1302, 1071, and 998 cm–1 in the SERS spectrum presented high intensity. The band at 1368 cm–1 was attributed to the ν(ON) of the nitro group + δ(CH2) of the methyl linked to the 1,3,5-oxadiazinan-4-ylidene group. The band at 1302 cm–1 was attributed to the ν(NO) of the nitro group + δ(HCC) + τ(HCCS) of the thiazole ring. The band at 1071 cm–1 was assigned to the ν(NN) of the nitramide group + τ(HCOC) of the 1,3,5-oxadiazinan-4-ylidene moiety. The band at 998 cm–1 was attributed to the ν(NN) of the nitramide group. The vibrational modes highlighted above would be those with significant components perpendicular to the Ag surface, as predicted by surface selection rules. Figure 5S (see the Supplementary Material) presents the displacement vectors for the 1387, 1253, and 1030 cm–1 modes; the selected modes presented large components perpendicular to the metallic cluster, which further supports the above interpretation of the molecular orientation on the AgNP surface. It can be noted that the vibrational modes involved mainly the nitro and the nitramide groups, but also an oxadiazinan-4-ylidene moiety, suggesting that the interaction of THX with the Ag surface would preferentially occur through the nitro group. In contrast, the 1,3,5-oxadiazinan-4-ylidene group was close to the surface as well.
In the region between 800 and 400 cm–1, bands of lower intensity were observed. The band at 766 cm–1 was ascribed to δ(ONN) of the nitro group + γ(NNO) of the nitro group. The band at 418 cm–1 was ascribed to ν(NC) + δ(ONN) + δ(NCN) of the nitramide and oxadiazinan-4-ylidene moieties. The observation of these bands in the SERS spectrum reinforces the proposed anchoring of THX to the silver surface through the nitro group.
Figure 6a shows the MEP map for the THX molecule. It is observed that the region of the nitro group exhibits the most negative potential values, reinforcing the suggestion of THX interaction through the oxygen atoms of the nitro group with the Ag surface. Figure 6b shows the FMO of the optimized geometry of THX adsorbed on the Ag10 cluster. The HOMO presents an electronic density highly localized on the Ag10 cluster; the LUMO, whereas the LUMO shows electron density distributed over the nitramide and 1,3,5-oxadiazinan-4-ylidene moieties. This characterizes a metal-to-adsorbate charge transfer, suggesting a relevant interaction between these groups and the silver surface. The dCT distance values were calculated36 obtaining a value of 3.86, indicating a significant charge transfer between the silver atoms and the adsorbed THX. The above suggestion corresponds with the experimental results, as evidenced by the spectral changes observed in the SERS spectrum compared to the spectrum of the solid THX. That comparison reinforces the notion that the proposed Ag10(THX) model is a reasonable description of the pesticide adsorption on the Ag surface.

SERS of IMD and THX mixtures in water
One interesting application of the SERS study presented above may come from noticing that the IMD and THX spectra presented expressive differences, which may allow the differentiation of the two species in mixtures using SERS. To verify if this is possible, a SERS study was carried out with mixtures of pesticides in an IMD:THX molar ratio of 1:1, 1:3, and 3:1 in AgNP, shown in Figure 7.

SERS spectra of IMD:THX mixtures in AgNP colloidal suspension at different molar ratios: (a) 1:1, (b) 1:3, and (c) 3:1 (●: IMD SERS bands; *: THX SERS bands)
In Figure 7, the bands at 1537, 1109, 1033, 907, 850, and 828 cm–1 are characteristic of IMD, and the bands at 1570, 1468, 1000, and 766 cm–1 are related to THX. It is worth mentioning that some bands may overlap, and small shifts may occur in the SERS spectra of the experimental mixtures. This situation was observed in our experiments, particularly in the regions above 1200 cm–1 and between 700 and 600 cm–1 of the SERS spectra of the mixtures. It should be noted that the SERS spectra of the 1:1 and 3:1 IMD:THX ratios present primarily bands associated with IMD. This observation suggests that, in a mixture of these compounds, IMD has its anchoring on the nanoparticle surface, favored over THX, i.e., IMD is favored in the competition for adsorption sites on the metal surface. Nonetheless, the SERS spectra for the three studied relative concentrations of IMD and THX also present bands of THX with measurable intensity, showing an increasing trend in the IMD:THX 3:1, 1:1, 1:3 range, as shown in Figure 7. Thus, it can be claimed that SERS spectroscopy allows for the simultaneous observation and identification of both analytes with clear discrimination. Increasing complexity may be envisioned for the SERS experiments, as the present experiments demonstrate the potential of this technique in analyzing complex mixtures, such as those found in environmental samples.
CONCLUSIONS
This study demonstrated the effectiveness of SERS spectroscopy combined with DFT calculations for characterizing and analyzing molecular interactions between the neonicotinoid pesticides IMD and THX and AgNP surfaces. SERS spectral profiles revealed specific enhanced bands, whose assignments allowed the inference of predominant molecular moieties anchoring these compounds to metallic surfaces. The enhanced SERS bands of IMD suggest that pyridine and nitro moieties are involved in the interactions with AgNP surfaces. At the same time, the SERS profile of THX indicates that the interaction of this compound with the Ag surface would preferentially occur through the nitro group.
SERS experiments with mixtures of IMD and THX at different molar ratios demonstrated the ability of the technique to simultaneously detect both compounds. The superior affinity of IMD for the metallic surface was evidenced, but both molecules could be reliably observed. The use of DFT calculations, followed by a PED description of the vibrational modes of adsorbed molecules on gold clusters, proved essential for understanding the experimental vibrational patterns and allowing the proposed chemical interactions of both adsorbates with silver surfaces.
SUPPLEMENTARY MATERIAL
Complementary material for this work (UV-Vis spectrum of AgNP aqueous suspension; Raman spectra of IMD simulated using several functionals and basis sets; Raman spectra and HOMO-LUMO orbitals calculated for Ag10(IMD) complex (adsorption through pyridine); cartesian coordinates of the equilibria structure for Ag10, THX, Ag10(THX), IMD, and Ag10(IMD); tables with the assignment of Raman and SERS bands for IMD and THX based on PED calculations) is available at http://quimicanova.sbq.org.br/, as a PDF file, with free access.
Supplementary PDF
DATA AVAILABILITY STATEMENT
The data used in this article are all available within the text and the supporting information file. Additional data may be requested from the corresponding authors.
ACKNOWLEDGMENTS
The authors acknowledge CNPq, FAPEMIG (APQ-00887-23), and CAPES (Finance Code 001) for financial support. G. P. O. and R. O. thank CAPES for doctoral fellowships.
REFERENCES
-
1 Wang, Y.; Fu, Y.; Wang, Y.; Lu, Q.; Ruan, H.; Luo, J.; Yang, M.; Food Chem.: X 2022, 15, 100375. [Crossref]
» Crossref -
2 Zhang, F.; Zhang, Y.; Ni, H.; Ma, K.; Li, R.; Spectrochim. Acta, Part A 2014, 118, 162. [Crossref]
» Crossref -
3 Maienfisch, P.; Huerlimann, H.; Rindlisbacher, A.; Gsell, L.; Dettwiler, H.; Haettenschwiler, J.; Sieger, E.; Walti, M.; Pest Manage. Sci. 2001, 57, 165. [Link] accessed in May 2026
» Link -
4 Food and Agriculture Organization of the United Nations (FAO); Pesticides Use, Pestices Trade and Pesticides Indicators - Global, Regional and Country Trends, 1990-2020; FAOSTAT Analytical Briefs: Rome, 2022. [Crossref]
» Crossref -
5 Seifert, J.; Encyclopedia of Toxicology, 3 rd ed.; Academic Press: Oxford, 2014, p. 477. [Crossref]
» Crossref -
6 Ma, Y.; Huang, Z.; Li, S.; Zhao, C.; Nanomaterials 2019, 9, 426. [Crossref]
» Crossref -
7 World Health Organization (WHO); The Who Recommended Classification of Pesticides by Hazard and Guidelines to Classification, 2019th ed.; WHO: Geneva, 2020. [Link] accessed in May 2026
» Link -
8 Dowgiallo, A. M.; Guenther, D. A.; J. Agric. Food Chem. 2019, 67, 12642. [Crossref]
» Crossref -
9 Gao, Z. F.; Li, Y. X.; Dong, L. M.; Zheng, L. L.; Li, J. Z.; Shen, Y.; Xia, F.; Sens. Actuators, B 2021, 348, 130728. [Crossref]
» Crossref -
10 Fan, M.; Andrade, G. F. S.; Brolo, A. G.; Anal. Chim. Acta 2020, 1097, 1. [Crossref]
» Crossref -
11 Reguera, J.; Langer, J.; de Aberasturi, D. J.; Liz-Marzán, L. M.; Chem. Soc. Rev. 2017, 46, 3866. [Crossref]
» Crossref -
12 Lu, X.; Rycenga, M.; Skrabalak, S. E.; Wiley, B.; Xia, Y.; Annu. Rev. Phys. Chem. 2009, 60, 167. [Crossref]
» Crossref -
13 Jiang, L.; Hassan, M. M.; Ali, S.; Li, H.; Sheng, R.; Chen, Q.; Trends Food Sci. Technol. 2021, 112, 225. [Crossref]
» Crossref - 14 Andrade, G. F. S.; de Oliveira, R.; Marques, F. C.; Martini, W. S.; Oliveira, G. P.; Sant’Ana, A. C.; Toledo, P. H. M.; Encyclopedia of Sensors and Biosensors, 1 st ed.; Elsevier: Oxford, 2023.
-
15 de Oliveira, R.; Sant’Ana, A. C.; Spectrochim. Acta, Part A 2024, 322, 124832. [Crossref]
» Crossref -
16 Creedon, N.; Lovera, P.; Moreno, J. G.; Nolan, M.; O’Riordan, A.; J. Phys. Chem. A 2020, 124, 7238. [Crossref]
» Crossref -
17 Pham, U. T.; Phan, Q. H. T.; Nguyen, L. P.; Luu, P. D.; Doan, T. D.; Trinh, H. T.; Dinh, C. T.; Van Nguyen, T.; Tran, T. Q.; Le, D. X.; Pham, T. N.; Le, T. D.; Nguyen, D. T.; Processes 2022, 10, 442. [Crossref]
» Crossref -
18 Chi, H.; Wang, C.; Wang, Z.; Zhu, H.; Mesias, V. S. D.; Dai, X.; Chen, Q.; Liu, W.; Huang, J.; Analyst 2020, 145, 5158. [Crossref]
» Crossref -
19 Cao, X.; Hu, Y.; Yu, H.; Sun, S.; Xu, D.; Zhang, Z.; Cong, S.; She, Y.; Talanta 2024, 266, 125000. [Crossref]
» Crossref -
20 Moreira, A. A. G.; de Lima-Neto, P.; Caetano, E. W. S.; Barroso-Neto, I. L.; Freire, V. N.; Spectrochim. Acta, Part A 2017, 185, 245. [Crossref]
» Crossref -
21 Leyton-Soto, F.; Schultz, Z. D.; Ormazábal-Toledo, R.; Ruiz-León, D.; Giordano, A.; Isaacs, M.; New J. Chem. 2024, 48, 3924. [Crossref]
» Crossref -
22 Gao, Y.; Xu, M.; Xiong, J.; J. Environ. Sci. Health, Part B 2019, 54, 1234. [Crossref]
» Crossref -
23 Creighton, J. A.; Blatchford, C. G.; Albrecht, M. G.; J. Chem. Soc., Faraday Trans. 2 1979, 75, 790. [Crossref]
» Crossref -
24 Emonds-Alt, G.; Mignolet, B.; Malherbe, C.; Monbaliu, J. C. M.; Remacle, F.; Eppe, G.; Phys. Chem. Chem. Phys. 2019, 21, 22180. [Crossref]
» Crossref -
25 Valadbeigi, Y.; Int. J. Mass Spectrom. 2026, 519, 117547. [Crossref]
» Crossref - 26 Frisch, M. J.; Trucks, G. W.; Schlegel, H. B.; Scuseria, G. E.; Robb, M. A.; Cheeseman, J. R.; Scalmani, G.; Barone, V.; Petersson, G. A.; Nakatsuji, H.; Li, X.; Caricato, M.; Marenich, A. V.; Bloino, J.; Janesko, B. G.; Gomperts, R.; Mennucci, B.; Hratchian, H. P.; Ortiz, J. V.; Izmaylov, A. F.; Sonnenberg, J. L.; Williams-Young, D.; Ding, F.; Lipparini, F.; Egidi, F.; Goings, J.; Peng, B.; Petrone, A.; Henderson, T.; Ranasinghe, D.; Zakrzewski, V. G.; Gao, J.; Rega, N.; Zheng, G.; Liang, W.; Hada, M.; Ehara, M.; Toyota, K.; Fukuda, R.; Hasegawa, J.; Ishida, M.; Nakajima, T.; Honda, Y.; Kitao, O.; Nakai, H.; Vreven, T.; Throssell, K.; Montgomery Jr., J. A.; Peralta, J. E.; Ogliaro, F.; Bearpark, M. J.; Heyd, J. J.; Brothers, E. N.; Kudin, K. N.; Staroverov, V. N.; Keith, T. A.; Kobayashi, R.; Normand, J.; Raghavachari, K.; Rendell, A. P.; Burant, J. C.; Iyengar, S. S.; Tomasi, J.; Cossi, M.; Millam, J. M.; Klene, M.; Adamo, C.; Cammi, R.; Ochterski, J. W.; Martin, R. L.; Morokuma, K.; Farkas, O.; Foresman, J. B.; Fox, D. J.; Gaussian 09, revision D.01, Gaussian, Inc., Wallingford, 2009.
-
27 Perdew, J. P.; Burke, K.; Ernzerhof, M.; Phys. Rev. Lett. 1996, 77, 3865. [Crossref]
» Crossref -
28 Hohenberg, P.; Kohn, W.; Physical Review Journals Archive 1964, 136, B864. [Crossref]
» Crossref -
29 Hehre, W. J.; Ditchfield, R.; Pople, J. A.; J. Chem. Phys. 1972, 56, 2257. [Crossref]
» Crossref -
30 Hay, P. J.; Wadt, W. R.; J. Chem. Phys. 1985, 82, 299. [Crossref]
» Crossref -
31 Marenich, A. V.; Cramer, C. J.; Truhlar, D. G.; J. Phys. Chem. B 2009, 113, 6378. [Crossref]
» Crossref -
32 Birke, R. L.; Znamenskiy, V.; Lombardi, J. R.; J. Chem. Phys. 2010, 132, 214707. [Crossref]
» Crossref -
33 Birke, R. L.; Lombardi, J. R.; J. Opt. 2015, 17, 114004. [Crossref]
» Crossref -
34 Jacquemin, D.; Bahers, T. L.; Adamo, C.; Ciofini, I.; Phys. Chem. Chem. Phys. 2012, 14, 5383. [Crossref]
» Crossref -
35 Marques, F. C.; Alves, R. S.; dos Santos, D. P.; Andrade, G. F. S.; Phys. Chem. Chem. Phys. 2022, 24, 27449. [Crossref]
» Crossref -
36 Kesharwani, M. K.; Brauer, B.; Martin, J. M. L.; J. Phys. Chem. A 2015, 119, 1701. [Crossref]
» Crossref -
37 Jamróz, M. H.; Spectrochim. Acta, Part A 2013, 114, 220. [Crossref]
» Crossref -
38 Zhu, X.; Wu, R.; Wang, X.; Fu, X.; Liu, Z.; Geng, X.; Teng, J.; Anal. Methods 2025, 17, 5034. [Crossref]
» Crossref -
39 Yang, B.; Liu, J.; Liu, X.; Niu, S.; Zhang, F.; Wang, Y.; Song, D.; Bi, S.; Talanta 2024, 278, 126524. [Crossref]
» Crossref -
40 Xu, Y.; Kutsanedzie, F. Y. H.; Hassan, M.; Zhu, J.; Ahmad, W.; Li, H.; Food Chem. 2020, 315, 126300. [Crossref]
» Crossref -
41 Abu Bakar, N.; Shapter, J. G.; Heliyon 2023, 9, e1486. [Crossref]
» Crossref -
42 Moskovits, M.; J. Chem. Phys. 1982, 77, 4408. [Crossref]
» Crossref -
43 Marques, F. C.; Oliveira, G. P.; Teixeira, R. A. R.; Justo, R. M. S.; Neves, T. B. V.; Andrade, G. F. S.; Vib. Spectrosc. 2018, 98, 139. [Crossref]
» Crossref -
44 Moskovits, M.; Suh, J. S.; J. Phys. Chem. 1984, 88, 5526. [Crossref]
» Crossref -
45 Moskovits, M.; DiLella, D. P.; Maynard, K. J.; Langmuir 1988, 4, 67. [Crossref]
» Crossref -
46 Sant’Ana, A. C.; Alves, W. A.; Santos, R. H. A.; Ferreira, A. M. D.; Temperini, M. L. A.; Polyhedron 2003, 22, 1673. [Crossref]
» Crossref -
47 Golab, J. T.; Sprague, J. R.; Carron, K. T.; Schatz, G. C.; Van Duyne, R. P.; J. Chem. Phys. 1988, 88, 7942. [Crossref]
» Crossref -
48 Mircescu, N. E.; Varvescu, A.; Herman, K.; Chiş , V.; Leopold, N.; J. Spectrosc. 2011, 26, 311. [Crossref]
» Crossref
Edited by
-
Associate Editor handled this article:
Ana Paula L. de Batista


