 Computer vision in Quality 4.0: empirical insights from industrial demands
Abstract
Paper aims This paper examines how computer vision (CV) technologies are being integrated into the Quality 4.0 framework, addressing the gap between conceptual discussions and industrial implementation.
Originality Unlike previous studies based on simulated environments or theoretical frameworks, this research draws on 202 proofs of concept (POCs) developed with real industrial demands. The dataset provides a rare empirical perspective on how CV technologies are adopted.
Research method The study employs a mixed-method approach combining descriptive statistics, trend identification, and correspondence analysis to identify technical and contextual patterns across the POCs.
Main findings The analysis reveals challenges in CV adoption, including the need for customization to sector-specific requirements and environmental characteristics. Simultaneously, it identifies opportunities in automated inspection, predictive maintenance, and real-time decision-making. The increasing use of classification, segmentation, and object detection techniques indicates a progression toward greater technical maturity.
Implications for theory and practice The findings extend Quality 4.0 research by providing empirical evidence of the technological and organizational conditions shaping CV implementation. For practitioners, they offer actionable insights on aligning CV deployment with infrastructure and production constraints. Overall, this study provides the first large-scale empirical mapping of CV implementation, demonstrating its role as an enabler of data-driven quality management.
Keywords:
Computer vision; Quality 4.0; Industry 4.0; Quality management; Digital manufacturing
1. Introduction
In the current landscape of industrial innovation, the integration of digital technologies has revolutionized traditional manufacturing processes, leading to the emergence of Industry 4.0. This transformation is characterized by the convergence of cyber-physical systems (CPS), the Internet of Things (IoT), big data, and artificial intelligence (AI), which collectively enhance operational efficiency and product quality (Frank et al., 2019; Kang et al., 2016). Within this paradigm, Quality 4.0 emerges as a crucial concept, combining these digital advancements with quality management practices to foster superior quality outcomes (Sony et al., 2020). Quality 4.0 leverages advanced data analytics, machine learning, and real-time monitoring to transition from reactive to proactive quality management. This shift enables organizations to predict and prevent quality issues, optimize processes, and ensure higher customer satisfaction (Sony et al., 2020).
According to Jacob (2017) and Sony et al. (2020), Quality 4.0 is grounded on the integration of ten key elements – including data management, connectivity, analytics, collaboration, and leadership – that collectively enable a shift from reactive to predictive and adaptive quality management. As quality assurance in manufacturing has traditionally relied on manual inspection activities performed by workers, the automation of these tasks represents a critical step toward digital transformation. In this context, computer vision emerges as a central technological enabler of Quality 4.0, directly contributing to data acquisition, real-time analytics, and process automation, and thereby enhancing the precision, speed, and consistency of quality inspection processes.
Computer vision (CV) has matured to a point where it supports diverse applications across different manufacturing environments, enabling precise and efficient inspection processes that enhance quality management (Zhou et al., 2023). Despite significant technical progress, a detailed understanding of CV’s broader adoption within the Quality 4.0 framework is still limited. Most existing studies focus on algorithms or isolated applications, with fewer contributions offering systematic empirical evidence of how CV is demanded, tested, and adapted in industrial contexts (Wang et al., 2021). Understanding these implementation dynamics is crucial for advancing Quality 4.0, as the effectiveness of CV depends not only on technical performance but also on its alignment with process conditions, data infrastructure, and production environments. Generating empirical evidence from real industrial implementations is therefore essential to identify the practical enablers and limitations of CV, and to guide organizations in effectively translating Quality 4.0 principles into operational results (Wuest et al., 2016).
Thus, the primary goal of this study is to explore this intersection through an exploratory empirical study of 202 proofs of concept (POCs) developed with real industrial demands and parts. By analyzing these POCs systematically, the paper identifies opportunities and challenges that reflect not only the conditions of the POCs, but also recurring industrial patterns documented in the broader literature. Hence, this study evaluates various factors such as application targets, CV techniques applied, and features related to the process, providing an overview of computer vision implementation in the industry.
The findings contribute to the literature in two main ways. First, they provide empirical insights into the current trends, challenges, and opportunities of CV adoption in Quality 4.0. Second, they extend theoretical discussions by connecting them with evidence drawn from industrial practice, highlighting technological and organizational aspects that are crucial for successful adoption. Moreover, this work identifies critical factors influencing the successful implementation of computer vision technologies, such as inspection environments, internet connectivity, and the integration of various AI techniques. These insights may be helpful for organizations aiming to transition towards Quality 4.0, emphasizing the need for alignment between technological capabilities and organizational objectives. Furthermore, this research also underscores the importance of customization and adaptation of computer vision technologies to specific industrial contexts, which is crucial for the effective deployment of these technologies in diverse manufacturing environments (Smith et al., 2021).
Lastly, the evolution of Quality 4.0 within Industry 4.0 represents a significant advancement in quality management practices. However, translating theoretical potential into practical application requires addressing numerous challenges, including technological integration and organizational alignment (Frank et al., 2019; Kang et al., 2016). So, this study also contributes to this ongoing discourse by providing empirical insights for understanding and implementing computer vision technologies within the Quality 4.0 paradigm.
The remainder of the paper is structured as follows. The next section provides an overview of the theoretical background and existing research on computer vision and Quality 4.0. The method section outlines the research design and methods used for data collection and analysis. The results section presents the findings of the study. Next, the discussion section explores the implications of the research results. Finally, the conclusion summarizes the key contributions and offers directions for future research.
2. Theoretical background
2.1. Quality management and its evolution to Quality 4.0
The concept of quality has undergone significant transformations over the past century, evolving through various stages that reflect advancements in industrial processes and technological innovations (Garvin, 1988). Initially, quality was managed through inspection, where the primary focus was on detecting non-compliant products through manual checks (Feigenbaum, 1991). This reactive approach was later complemented by Shewhart's introduction of control charts in the 1920s, which allowed for proactive monitoring and control of process variability (Shewhart, 1931). The post-World War II era saw the emergence of Total Quality Control (TQC) and Total Quality Management (TQM) (Ishikawa, 1985). These paradigms emphasized a holistic approach to quality, integrating quality control into every aspect of the organizational process (Deming, 1986). TQM focused on continuous improvement and customer satisfaction, leveraging statistical methods and cross-functional team efforts (Montgomery, 2009). Despite the advancements brought by TQM and Six Sigma methodologies, the pace of innovation in quality management has slowed, creating a gap for new models and approaches (Zonnenshain & Kenett, 2020).
The advent of the fourth industrial revolution, known as Industry 4.0, marks a significant shift towards the digitalization and automation of manufacturing processes. This era is characterized by the integration of CPS, IoT, and big data analytics, which collectively enable real-time monitoring, decision-making, and optimization of production systems (Li, 2018; Xu et al., 2018). Within this context, Quality 4.0 emerges as a concept that seeks to digitalize and enhance traditional quality management practices using advanced technologies. Quality 4.0 is not a replacement for traditional quality methodologies but rather an evolution that integrates digital tools to improve process performance, visibility, and connectivity (Jacob, 2017). It leverages technologies such as AI, IoT, and big data to provide real-time insights, predictive analytics, and automated quality control measures, thereby transforming quality management into a more proactive and strategic function (Zonnenshain & Kenett, 2020). Table 1 provides an overview of key aspects within the concept of Quality 4.0.
Quality 4.0 is founded on several key elements that align with the broader goals of Industry 4.0. These elements include analytics, data management, connectivity, scalability, collaboration, competency, leadership, culture, compliance, and management systems (Jacob, 2017). The integration of these elements facilitates the transition from reactive quality control to a more predictive and adaptive quality management system. The implementation of Quality 4.0 requires a cultural shift within organizations, where employees participate in the digital transformation process. Leadership plays a critical role in fostering a culture of continuous improvement and innovation, ensuring that quality practices are integrated into every aspect of the business (Javaid et al., 2021). Furthermore, the use of AI and machine learning in Quality 4.0 enables the development of intelligent systems capable of identifying patterns, predicting defects, and optimizing processes in real-time (Smith et al., 2021).
In this context, computer vision is a crucial technology within the Quality 4.0 framework, offering advanced capabilities for automated inspection, defect detection, and process control (Javaid et al., 2021). CV systems utilize deep learning algorithms, such as Convolutional Neural Networks (CNNs), to analyze images and videos, extracting meaningful information that can be used to ensure product quality and consistency (LeCun et al., 2015). In manufacturing, CV applications range from surface defect detection and dimensional measurement to object recognition and robotic guidance (Chouhad et al., 2021; Moru & Borro, 2020). These applications not only improve the accuracy and efficiency of quality inspections but also enable the continuous monitoring of production processes, providing valuable data for predictive maintenance and process optimization (Zhou et al., 2023).
2.2. Computer vision advanced applications in industry
Computer vision has seen a rapid evolution in its application within the industrial sector. This technology encompasses a range of functions, including defect detection, sorting, visual servoing, metrology, counting, object detection, robot guidance, and augmented reality support. These applications are often integrated to enhance manufacturing processes, aligning with the broader goals of Quality 4.0.
The most prevalent application of computer vision in industry is quality control. Computer vision techniques enable precise visual inspection for defect detection, significantly enhanced by deep learning algorithms such as CNNs (Chouhad et al., 2021). These advanced algorithms allow computer vision systems to detect a wide array of defects across various surfaces, outperforming traditional methods in both accuracy and scope. For example, Chouhad et al. (2021) utilized a CNN to classify surface irregularities in copper pieces post-laser cutting, employing a 4K camera and chromatic confocal technology. Similarly, Ardanza et al. (2019) developed a quality control use case for additive manufacturing (AM), utilizing a human-machine interface (HMI) platform to operate and monitor an AM machine with high-resolution imaging, ensuring the accuracy of each printed layer. Moru & Borro (2020) proposed a machine vision application for sub-pixel level measurement of industrial gears, optimizing quality control and reducing downtime.
Further studies, such as Devereux et al. (2021), investigated automated object identification systems for nuclear reactor cores, employing semantic segmentation to outperform traditional methods. Wang & Guo (2014) developed a system for detecting faults in fruits and vegetables, achieving high recall and low false detection rates using a color histogram and Linear Support Vector Machine (SVM). In the automotive industry, Srivastava et al. (2019) evaluated deep learning models for real-time object identification, balancing resource consumption, run time, and accuracy across different hardware platforms.
Additionally, sorting applications in computer vision systems involve categorizing mixed items by shape, color, size, or other visual characteristics, often integrated with inspection processes in various industries. For instance, Soustek et al. (2020) explored machine vision for sorting nuts and washers, utilizing a visualization tool from National Instruments for automated inspection. In the food industry, Morales et al. (2014) described a robotic system for handling onions and artichokes, incorporating a parallel manipulator and custom-designed end-effector with computer vision software. Alaskar et al. (2022) employed a convolutional deep learning network to enhance the automatic sorting of date fruits, achieving high accuracy through a custom CNN architecture.
Computer vision systems also excel in visual guidance and measurement applications. Adams et al. (2018) demonstrated a thermal spraying application using machine learning-based vision to align plasma gun nozzles. Vijayan et al. (2017) discussed robotic assembly systems employing visual guidance and feedback, with artificial neural networks (ANNs) enhancing computing time and convergence. De Araujo & Lins (2020) proposed an autonomous system for workpiece referencing in machining, using stereo vision and cloud-based image analysis. Zawada-Tomkiewicz & Tomkiewicz (2020) developed an intelligent vision sensor for evaluating machined surfaces during cutting processes, addressing current research challenges. Castelli et al. (2017) created a machine learning-based visual servoing solution for robot control in copper wire winding, showcasing the integration of computer vision in automated manufacturing.
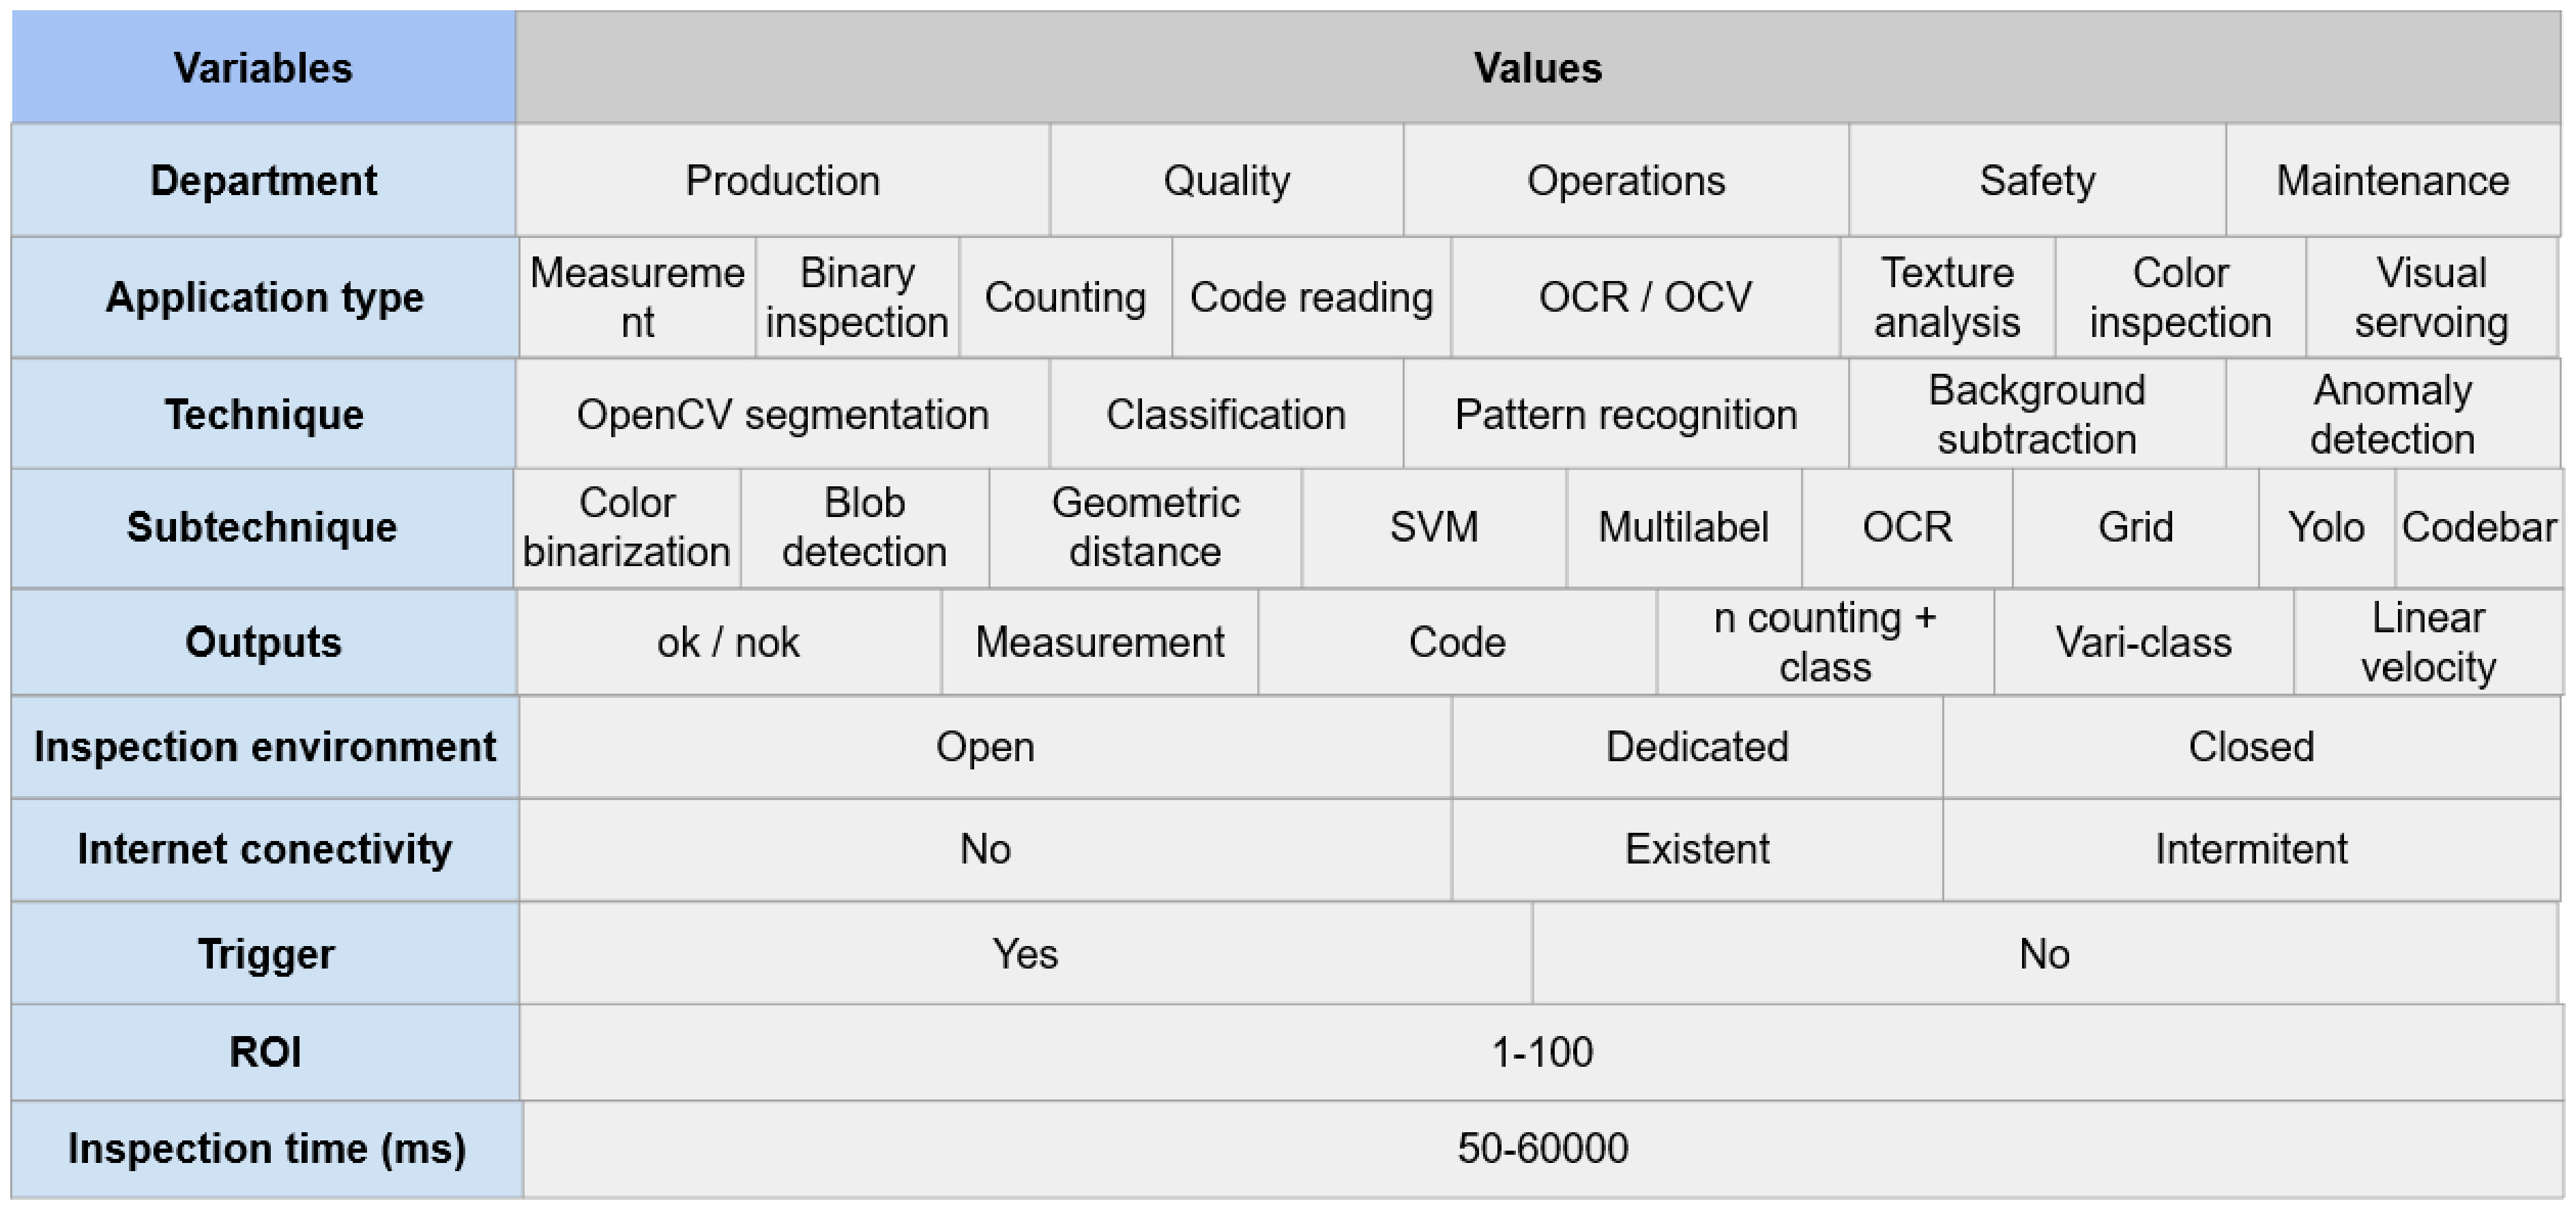
A morphological matrix is presented to systematize the various technological and organizational alternatives and aspects of computer vision implementation (Figure 1).

In the matrix, department is a variable that categorizes the beneficiary departments, such as production, quality, and maintenance. This classification assists in resource allocation and strategic planning of projects. Application type encompasses various operational categories like measurements, inspections, and code reading, which are essential for optimizing product and process designs within industrial settings. Technique refers to the main methodologies used in computer vision applications, while Subtechnique specifies algorithmic variants within each category, following the hierarchical organization commonly adopted in computer vision and Quality 4.0 studies (Javaid et al., 2021; Radziwill, 2018; Smith et al., 2021; Sony et al., 2020; Zhou et al., 2023). Outputs in the matrix define the types of data provided to industrial controllers, including codes, measurements, and classification results; these outputs are integral to the automation and control processes within the industry. The inspection environment variable classifies the system's conditions, distinguishing between open, closed, or dedicated environments to suit different operational needs.
Internet connectivity evaluates the impact of internet availability on the implementation of cloud computing, crucial for real-time data processing and remote operations in modern industrial applications. The trigger variable is critical as it defines the mechanisms that activate the inspection process, ensuring timely and accurate synchronization between the camera and the manufacturing line.
Region of interest (ROI) indicates the focus areas within the camera’s field of view that are processed, optimizing the system's efficiency by concentrating on regions critical for quality control and inspection (Gonzalez & Woods, 2018). Finally, inspection time (ms) measures the duration required to perform an inspection, providing insights into the system’s efficiency and the mechanical limits of the production line. This temporal metric is vital for evaluating the feasibility of deploying computer vision systems in high-speed industrial environments.
Despite the advancements in Quality 4.0 and the integration of computer vision technologies, gaps remain in the literature. While theoretical frameworks and conceptual models are abundant, empirical studies that highlight the applications, challenges, and successes of adopting Quality 4.0 are limited (Broday, 2022). There is a need for empirical research looking at technologies in the context of Quality 4.0 to bridge the theoretical advancements with practical applications, providing insights into the challenges and opportunities of implementing computer vision within the Quality 4.0 framework
3. Methods
The study employs an empirical research design centered on 202 proofs of concept (POCs) developed in response to real industrial demands within a technological testbed integrated into a learning factory environment. These demands were submitted by manufacturing companies from various industrial sectors, aiming to evaluate the feasibility of computer vision applications for quality control of their manufactured products. Each POC was developed using actual product samples provided by the related companies, thereby reproducing authentic industrial conditions and challenges. This approach enabled the systematic exploration of factors influencing the adoption of computer vision technologies and provided empirical evidence on opportunities and barriers within the Quality 4.0 framework.
3.1. Research scenario
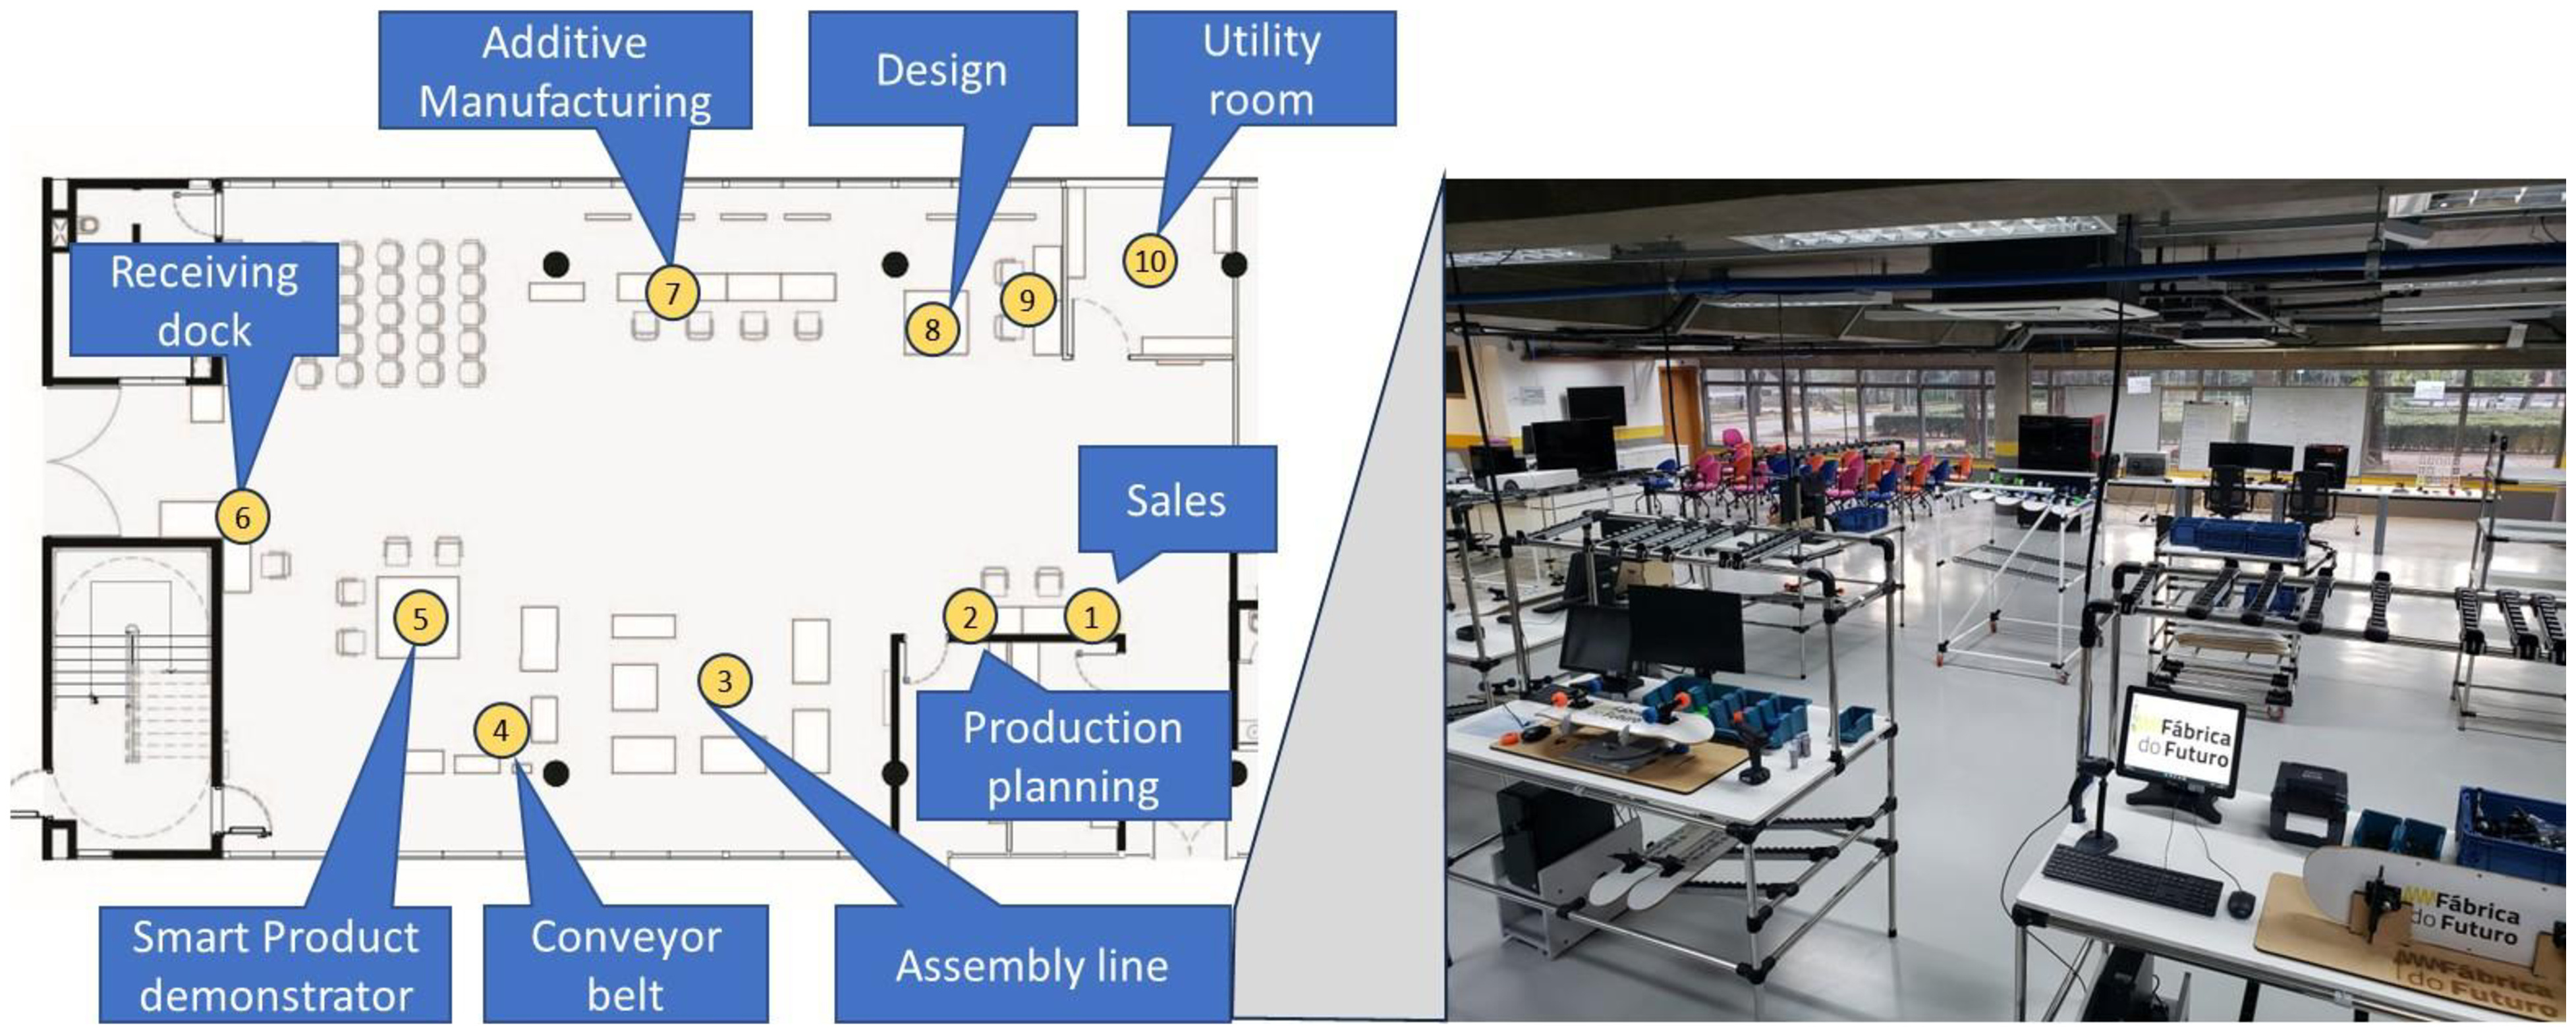
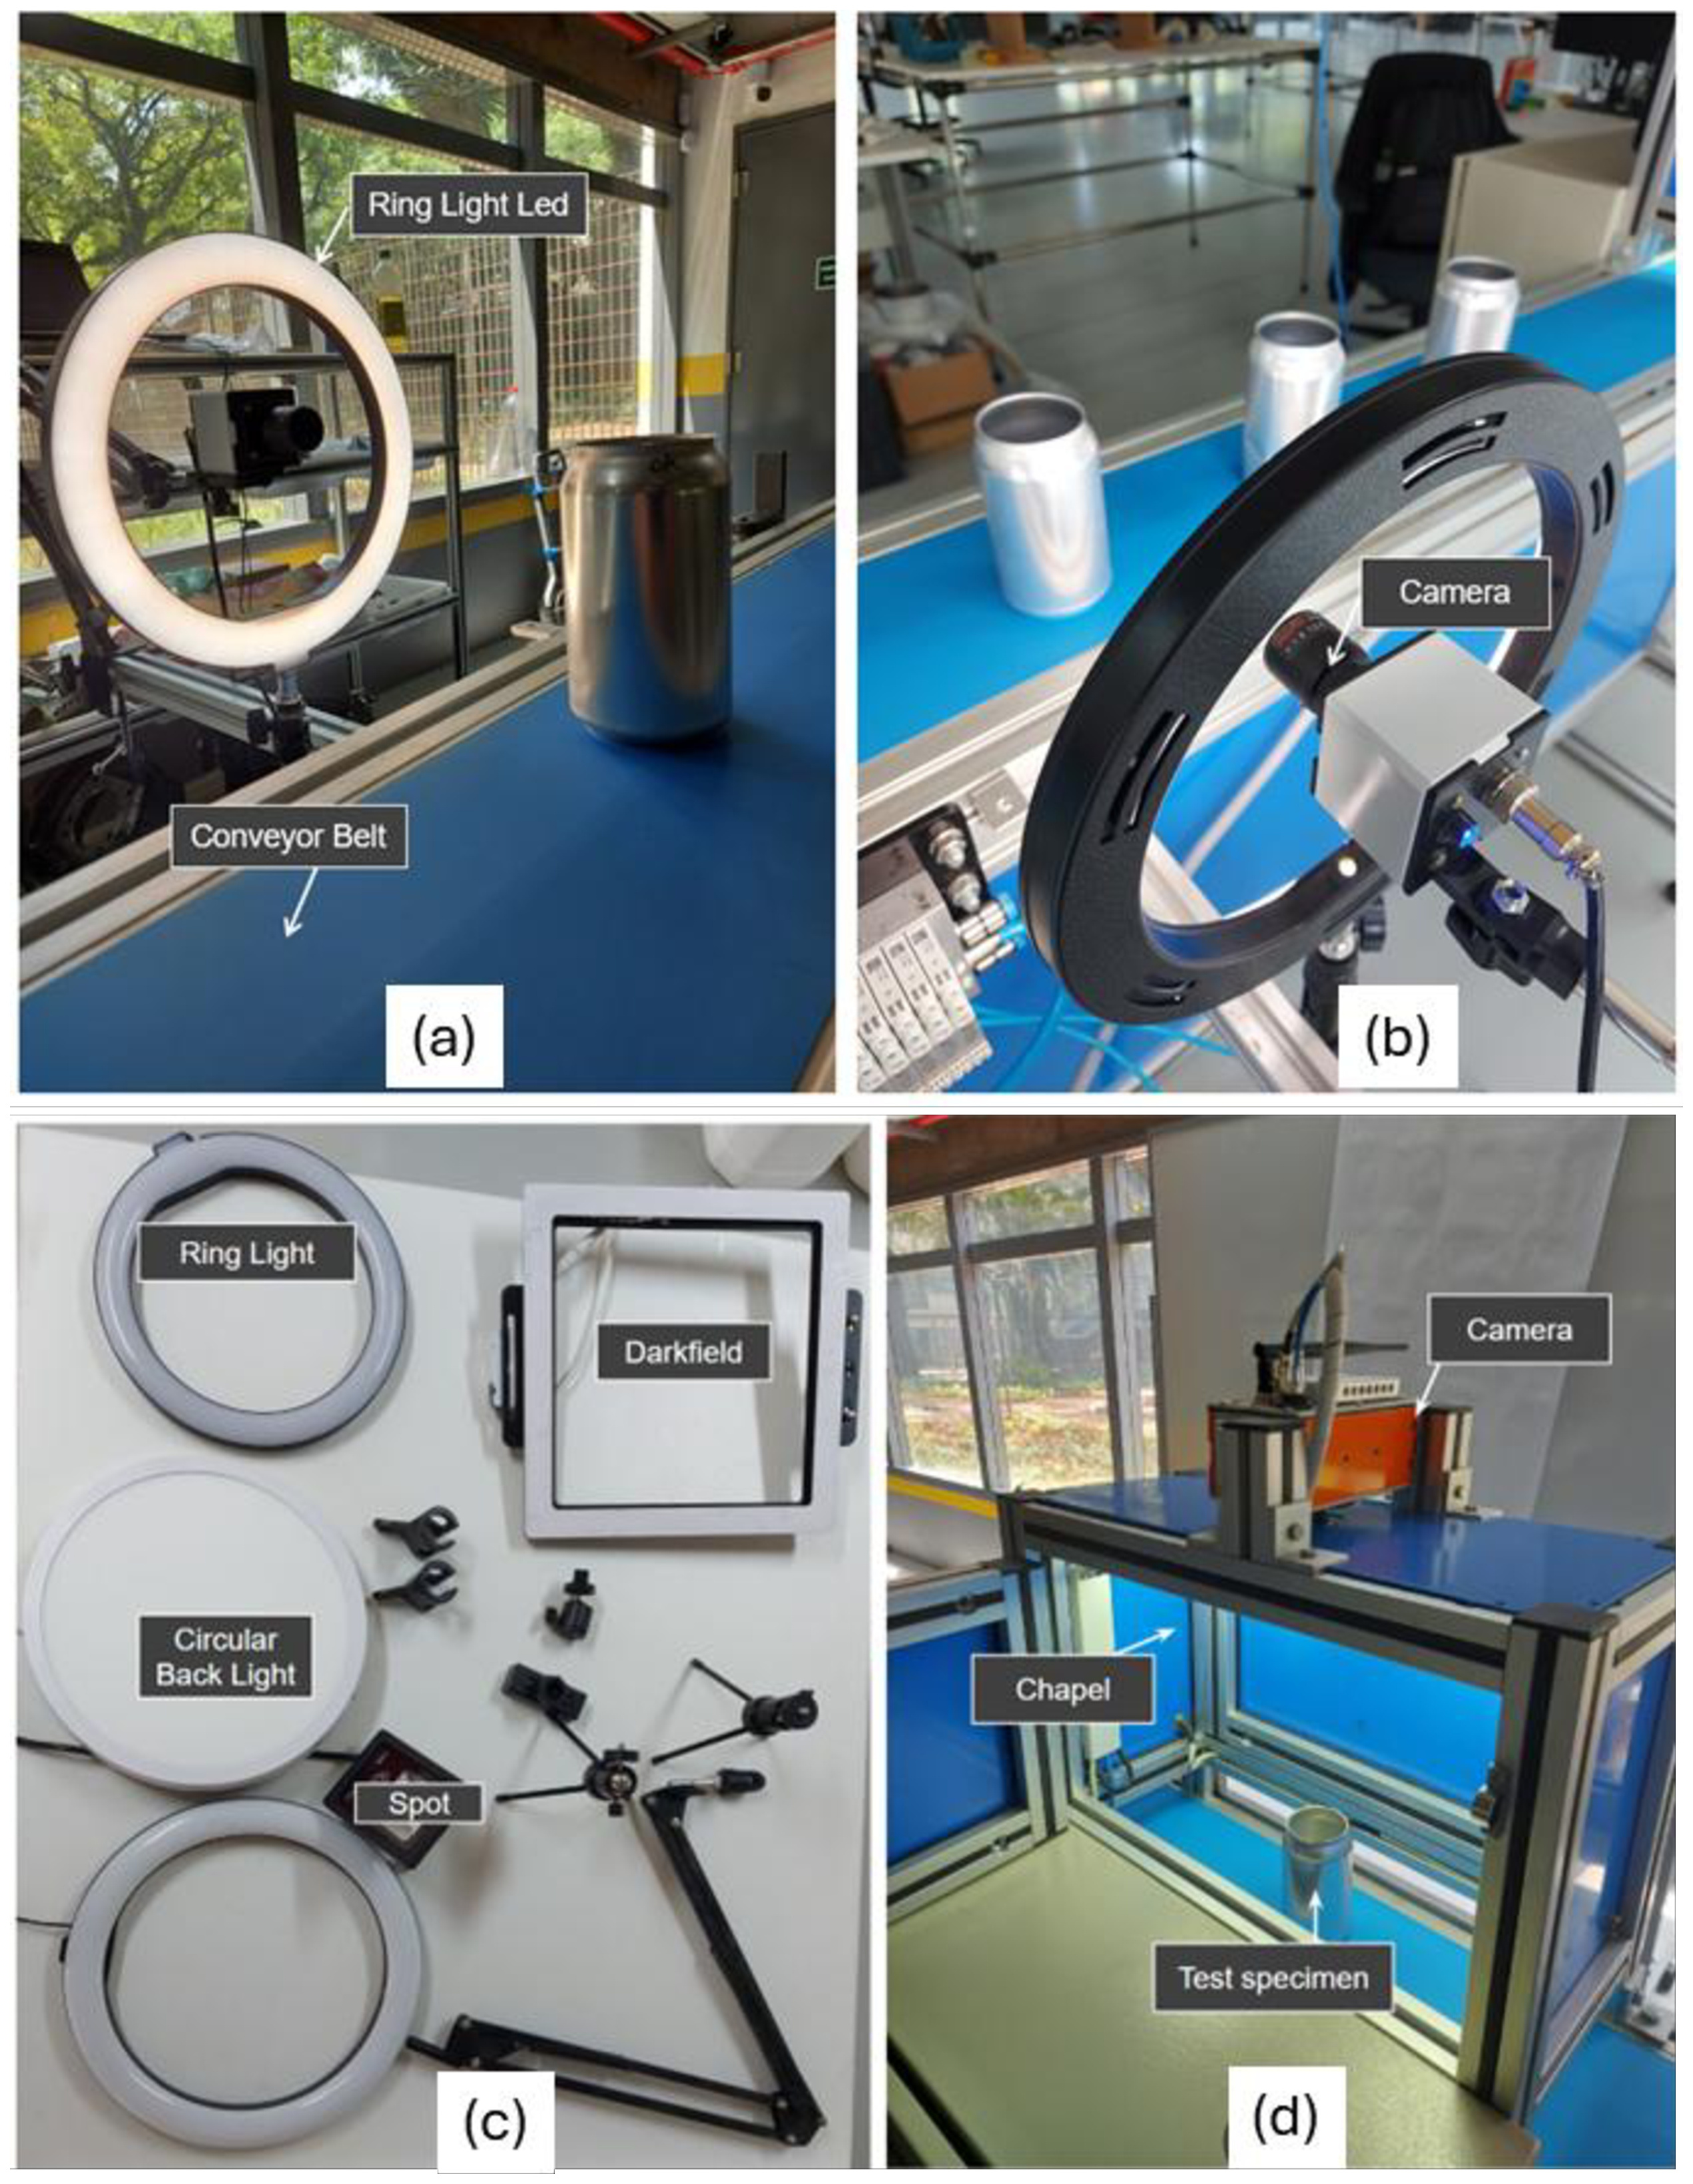
The proofs of concept within this research were implemented and tested in a learning factory environment. The learning factory, known as Fábrica do Futuro, is located at the University of São Paulo. The learning factory environment is equipped with various setups designed to replicate real-world industrial conditions as truly as possible (Figure 2). These setups include conveyor lines (Figures 3a and 3b), assembly benches, enclosed environments (Figure 3d), and internal logistics equipment like carts and a pallet truck. The conveyor belt used in the study measures 4.5 x 0.16 meters and has a variable linear speed ranging from 0.1 m/s to 0.9 m/s. For the tests, two cameras were used: one MVISIA® ESOS v2.6 model with a global shutter, 120 fps, and a resolution of 1600×1200 pixels; and one MVISIA® SENS v1.2 model with a rolling shutter, 20 fps, and a resolution of 1920×1080 pixels. For lighting, the study utilized a range of equipment, including ring light LEDs (9 W 6000 K), circular and rectangular backlights, spotlights, and darkfield lights (Figure 3c).


3.2. Data collection
A computer vision service provider has partnered with the learning factory to establish a testbed designed to assess the feasibility of applying computer vision technologies to quality control across diverse situations and industrial sectors. The initiative sought to enable the evaluation of these technologies within an environment that replicates real factory conditions, as testing new solutions in operational production lines is often impractical. The data collection process consisted of 202 POCs (units of analysis) obtained over three years, from 2019 to 2021. This time interval corresponds to a defined temporal cut selected during the research design phase, in which all POCs submitted were systematically collected and analyzed. The delimitation of this interval ensured a manageable and methodologically consistent dataset, allowing in-depth comparative analysis across application contexts. These POCs involved a range of companies that submitted application cases for testing within the learning factory environment. Thus, the POCs represent a variety of contexts (e.g., quality inspection of beverage cans, feature identification in stamped automotive parts, and object counting in logistics applications), resulting in a comprehensive dataset that illustrates the applicability of computer vision to quality control.
More specifically, each POC followed a detailed procedure to ensure consistency and reliability in the findings. The procedure included the following steps:
-
Initial setup – The learning factory environment was prepared with the necessary equipment and configurations to simulate the specific industrial conditions required for each POC. The setup included, for instance, adjusting the conveyor belt speed and installing the lightning in a way that was similar to the production line conditions.
-
Data collection – Industrial customers provided test specimens and additional materials such as videos and pictures. These inputs were used to design minimum viable solutions using proprietary software based on Python, facilitating the demonstration or validation of these solutions.
-
Execution – Each POC was executed under controlled conditions, with careful monitoring and documentation of all relevant variables. The setup varied depending on the specific application, ranging from inspections to tasks such as sorting and counting.
-
Documentation – Detailed records were kept for each POC, including the ID, execution date, technical characteristics, and outcomes. This ensured a comprehensive dataset for subsequent analysis.
Each POC was meticulously documented. Data collected included the number of ROIs, inspection time, the presence of a trigger, inspection environment (open, closed, dedicated), internet connectivity at the potential application site (existent, intermittent, non-existent), and application type (measurement, binary inspection, counting, code reading, OCR/OCV, texture analysis, color inspection).
3.3. Data analysis
The collected data were analyzed using descriptive statistics, trend analysis, and correspondence analysis (Greenacre & Blasius, 2006) to identify key findings and insights, such as technological evolution trends, the relationship between technologies and industrial sectors, and application challenges, such as limited connectivity.
Initially, a descriptive analysis was conducted to summarize the key characteristics and outcomes of the POCs. This was followed by more detailed analyses to identify patterns, challenges, and opportunities associated with the adoption of CV technologies, identified from each context of the POCs. The descriptive analysis involved summarizing the quantitative and qualitative data collected from the POCs. This included calculating frequencies, means, and standard deviations for the quantitative variables and categorizing the qualitative data to identify common themes and patterns. To understand the progression of CV applications, the data was interpreted to identify trends over the three-year period. This involved examining the growth in the number of POCs, changes in application types, and the adoption of different CV techniques (e.g., anomaly detection, pattern recognition, etc.) and subtechniques (code bar, color binarization, etc.).
A correspondence analysis was also performed to gain deeper insights into the relationships between various CV techniques and their application areas. This multivariate statistical technique helped to identify patterns and clusters in the data, revealing hidden structures that might not be evident through traditional tabular analysis methods. The results were visualized in two-dimensional or three-dimensional graphs, where the proximity between points (categories) reflected similarity in terms of frequency profiles.
4. Results
This section presents the key findings from the analysis of the 202 POCs, focusing on application areas, techniques used, and environmental factors affecting implementation to better understand the application of CV technologies.
4.1. Sample characteristics
POCs from the automotive sector are predominant in the sample, accounting for 20.8% of the cases or 43 proofs of concept (Figure 4). This is likely due to the high level of automation in the automotive industry compared to other industrial segments. Agroindustry and the food and beverage sector follow with a significant number of cases, 27 and 25, respectively. Electronics (10.9%), mining and steelmaking (9.4%), and R&D (7.4%) also have significant relevance in the sample.

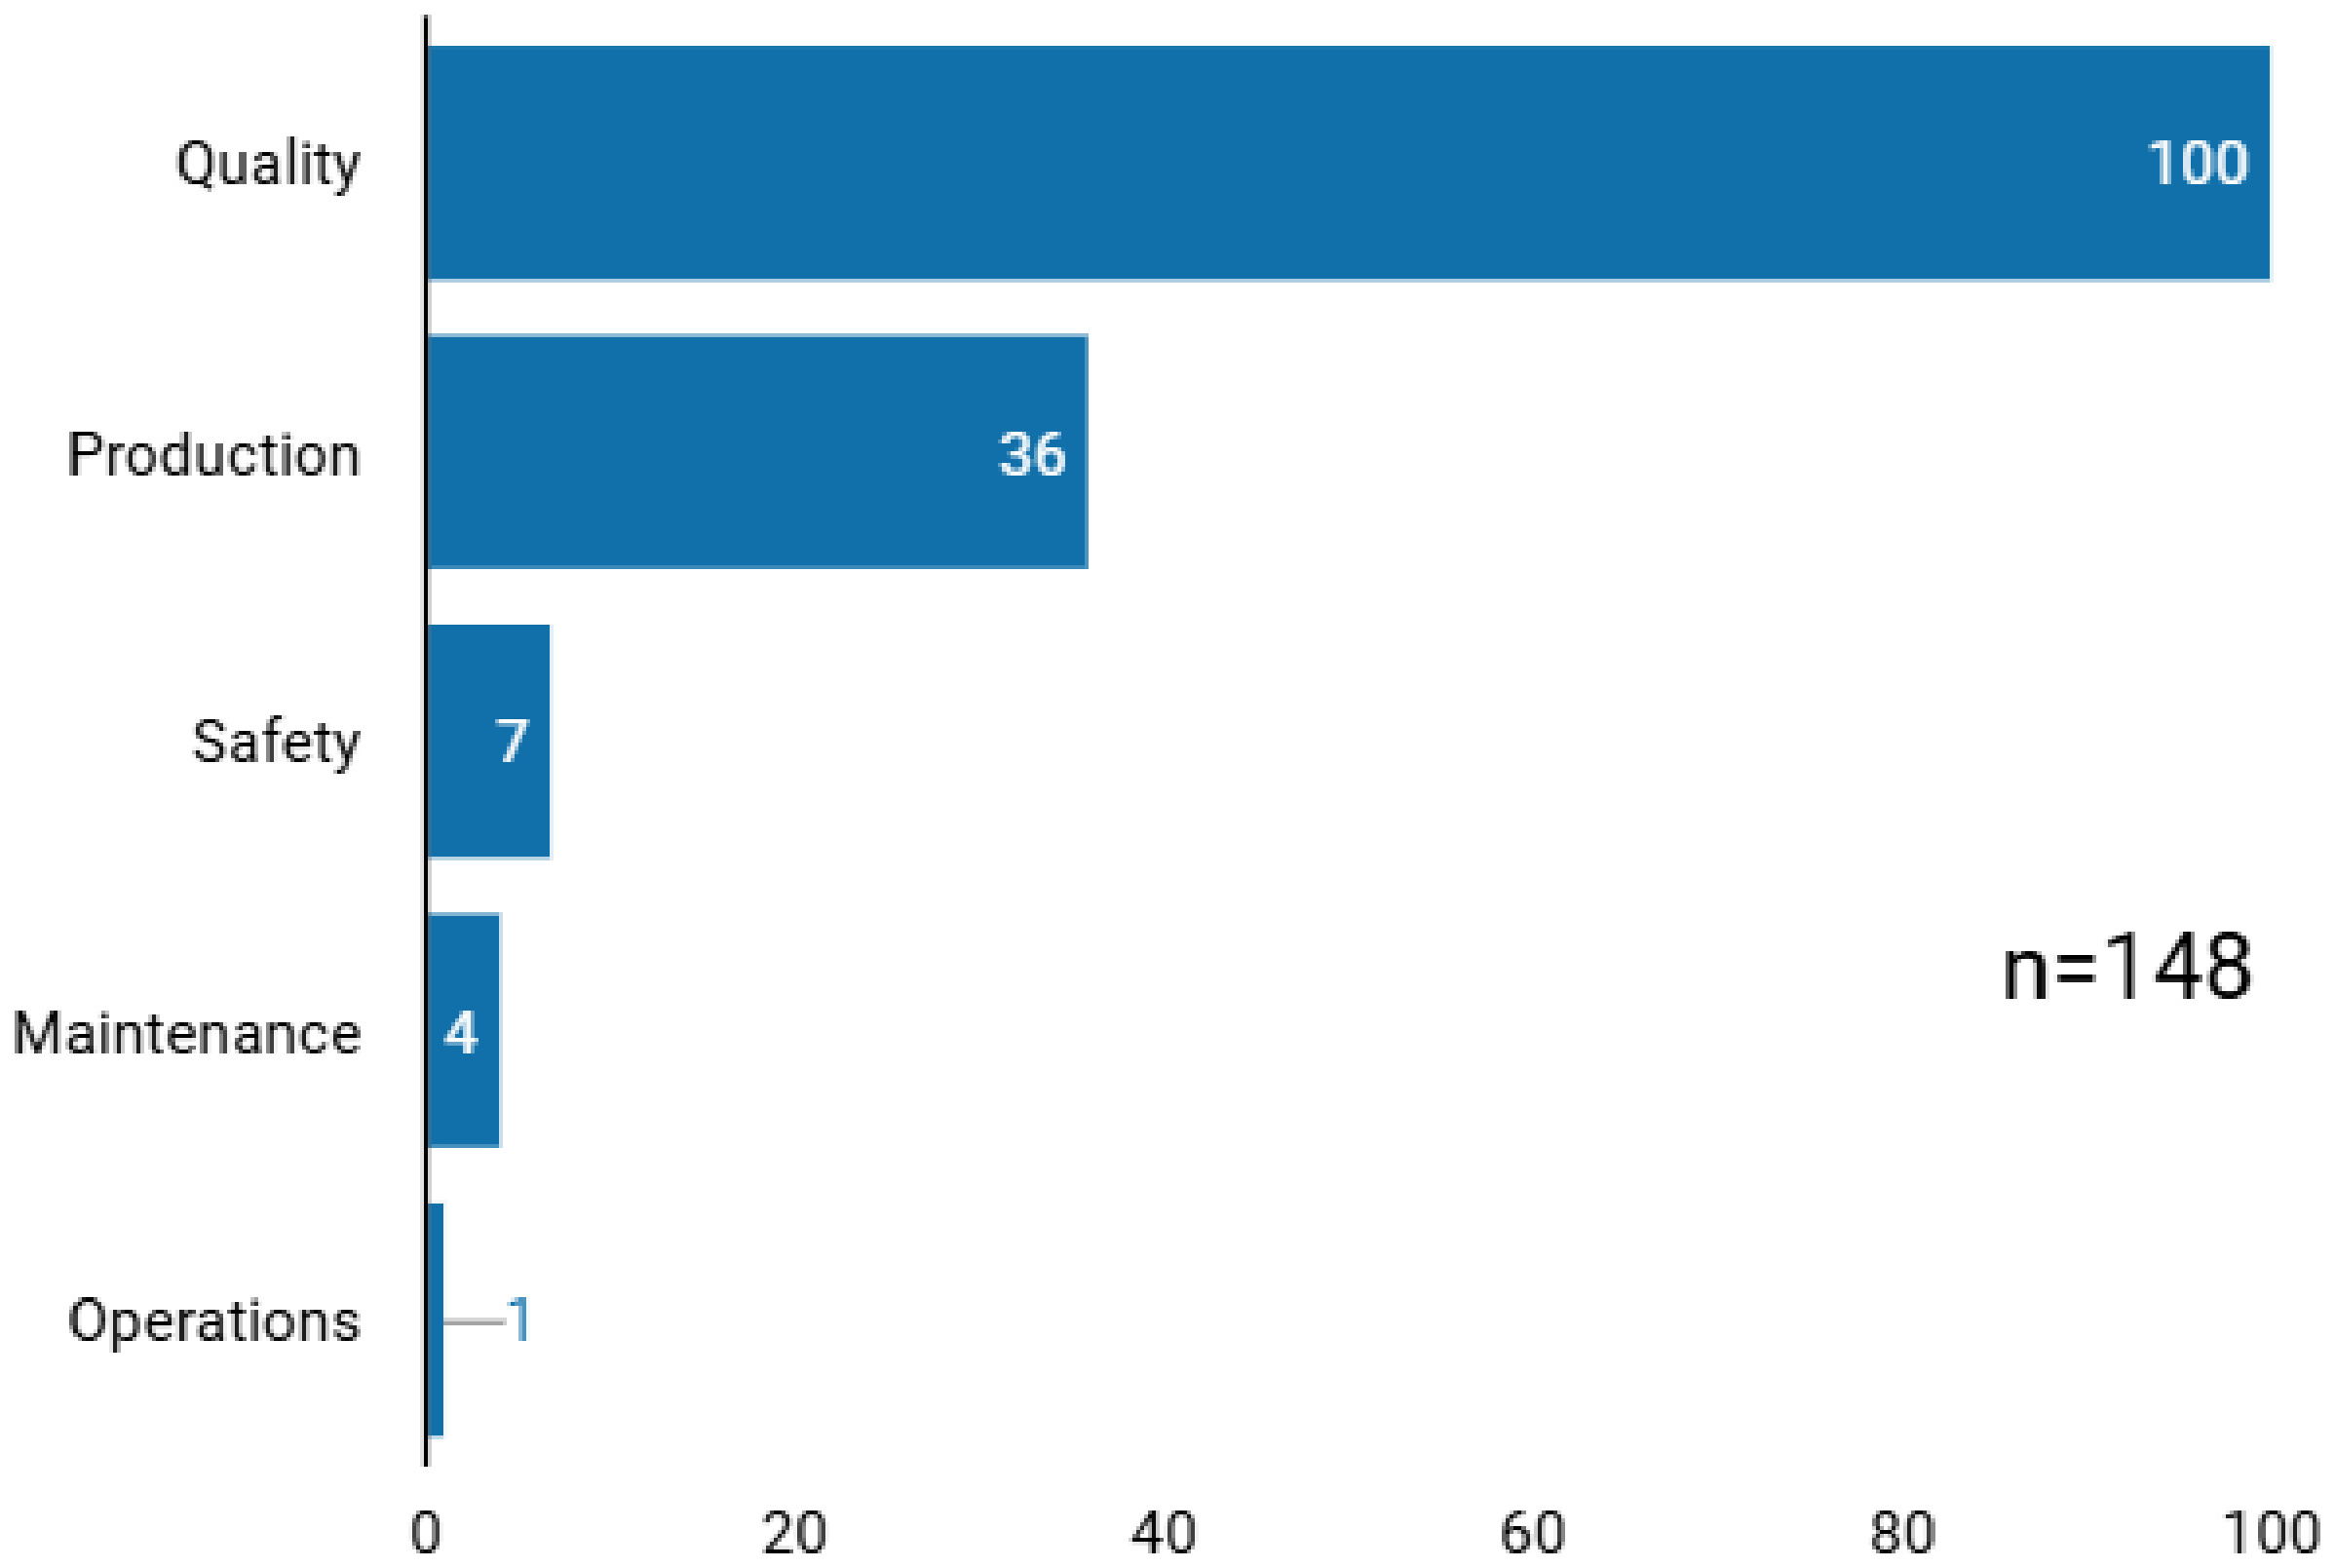
Figure 5 illustrates the distribution of proofs of concept conducted across various functional areas from the industrial customers. The quality department stands out with a significant majority of 100 proofs of concept. In comparison, 36 proofs of concept concerned the manufacturing department, also indicating a significant level of experimental activity aimed at optimizing production processes. Other functional areas, such as safety, maintenance, and operations, presented much lower numbers, with 7, 4, and 1 records, respectively. This indicates that these areas were still not the main focus of interest in CV technology applications.

Distribution of organizational departments where the technology has been implemented. Source: Authors.
Figure 6 shows the distribution of computer vision applications in industrial contexts. Most systems (52.9%) perform binary inspection, involving “yes or no” decisions such as detecting the presence or absence of components. Measurement accounts for 19.4%, reflecting the importance of dimensional precision in quality control. Counting represents 7.3%, followed by texture analysis (6.3%) and color inspection (5.2%), which address surface and color quality. Finally, OCR/OCV (5.2%) and code reading (3.7%) support traceability and label verification.

4.2. Application areas and techniques
The POC analysis showed that computer vision technologies were mainly applied in quality control, measurement, and counting. Figure 7 illustrates their growth from 2019 to 2021, with binary inspections rising from 10 to 46 applications (totaling 101), indicating strong demand for automated quality control. Measurement also expanded from 3 to 22 cases, reflecting greater emphasis on precision. Texture analysis and counting grew to 10 and 8 cases, respectively, showing increased interest in advanced image analysis. Color inspection rose slightly from 4 to 6, while OCR/OCV declined, possibly due to saturation or shifts to newer methods. Overall, applications increased from 13 in 2019 to 101 in 2021, highlighting the rapid integration of CV for efficiency, quality, and automation.

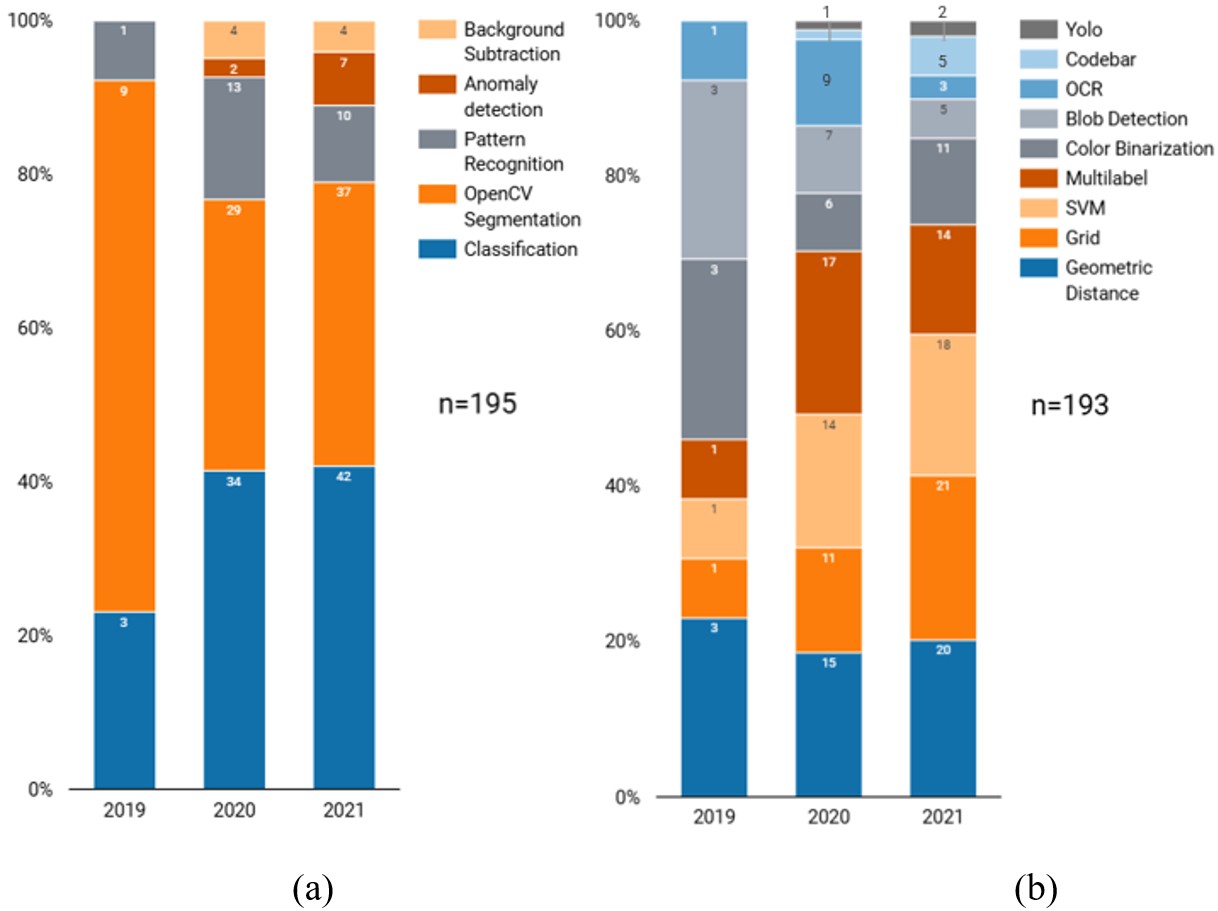
Figure 8 shows a steady and diversified growth of computer vision techniques from 2019 to 2021. Classification rose from 3 to 42 applications (total 79), and OpenCV segmentation from 9 to 37, indicating their expanding role in automating visual inspection and detailed image analysis. Anomaly detection and background subtraction also increased modestly. Among subtechniques (Figure 8b), geometric distance grew from 3 to 20 cases (total 38), and grid from 1 to 21, emphasizing their value for precision and data organization. Color binarization rose from 3 to 11, SVM from 1 to 18, and multilabel classification reached 17 in 2020, evidencing greater complexity in image processing. OCR peaked at 9 in 2020, while Yolo appeared in 2020 as a key tool for real-time detection. Overall, these trends point to a progressive adoption of more advanced and diversified CV methods, enhancing industrial precision and efficiency.
Furthermore, Figure 9 highlights the deployment of CV techniques tailored to specific needs across different industries. Both the automotive sector and food industry predominantly use "binary inspections" (28 and 15 instances, respectively) to ensure product quality and safety. Agroindustry employs a variety of techniques, with a balance between "binary inspections" (8 instances) and "counting" (7 instances) playing a prominent role in the counting and quality control of agricultural products. The pharmaceutical, electronics, and textile sectors emphasize "binary inspections" and "measurements" for strict compliance and precision in quality checks. Other sectors, except for the construction industry, show a similar trend. In construction, a more even distribution of applications is observed. This analysis demonstrates the widespread and sector-specific application of computer vision technologies, underscoring their essential role in enhancing quality control, operational efficiency, and compliance across diverse industries.

The next analysis, presented in Figure 10, compares CV application categories with the techniques employed. In binary inspections, classification dominates (62 cases), confirming its central role in pass/fail assessments, followed by OpenCV segmentation and background subtraction. For measurement, OpenCV segmentation is most common (35 cases), supporting detailed deviation detection. Counting also relies mainly on this technique (12 cases). In texture analysis, classification and OpenCV segmentation are equally frequent, while color inspection emphasizes both (6 and 3 cases, respectively) for color-based differentiation. OCR/OCV (9 cases) and code reading (7) primarily use pattern recognition, aligning with their text and code identification goals. Overall, the results indicate that technique selection is closely aligned with each application’s functional requirements.
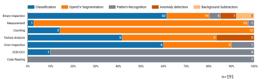
Figure 11 provides an overview of the main techniques and their corresponding sub-techniques used in computer vision systems. In “classification”, the prominence of the “SVM” sub-technique stands out, being employed in 33 instances, denoting its robustness and reliability in accurately classifying images. Concurrently, the significant use of the "multilabel" approach, with 27 instances, underscores the contemporary need to classify images into multiple categories simultaneously, a necessity in a world with complex visual information. "OpenCV segmentation" shows a marked preference for geometric distance, with 37 applications. This may illustrate its capability to measure similarities or differences for distinguishing elements in an image. "Color binarization" also plays a notable role, with 17 occurrences, reinforcing its effectiveness in segregating elements based on specific hues. "Blob detection" and the use of "multilabel" complement the segmentation framework, revealing the diversity of techniques adopted to visually break down an image into discernible components. In "pattern recognition," there is a tilt towards specialized techniques such as "OCR," used in 13 situations, and "codebar" applied in 6 cases, emphasizing the demand for precision in interpreting texts and codes in various formats and media. The occasional presence of “geometric distance” and "grid", each with a single application, suggests the need for methods that compare shapes and geometric structures to recognize patterns. For "anomaly detection," the "grid" technique is exclusively used 9 times, highlighting its usefulness in identifying deviations. This method can be particularly effective in isolating regions for detailed analysis, a critical step in identifying abnormalities in images. Lastly, in the context of "background subtraction," "grid" is also shown as the only subtechnique adopted, present in 8 cases.

4.3. Industrial environment and task characteristics
The industrial infrastructure and task characteristics were also examined, such as internet connectivity and inspection environment at the production site of the company providing the samples.
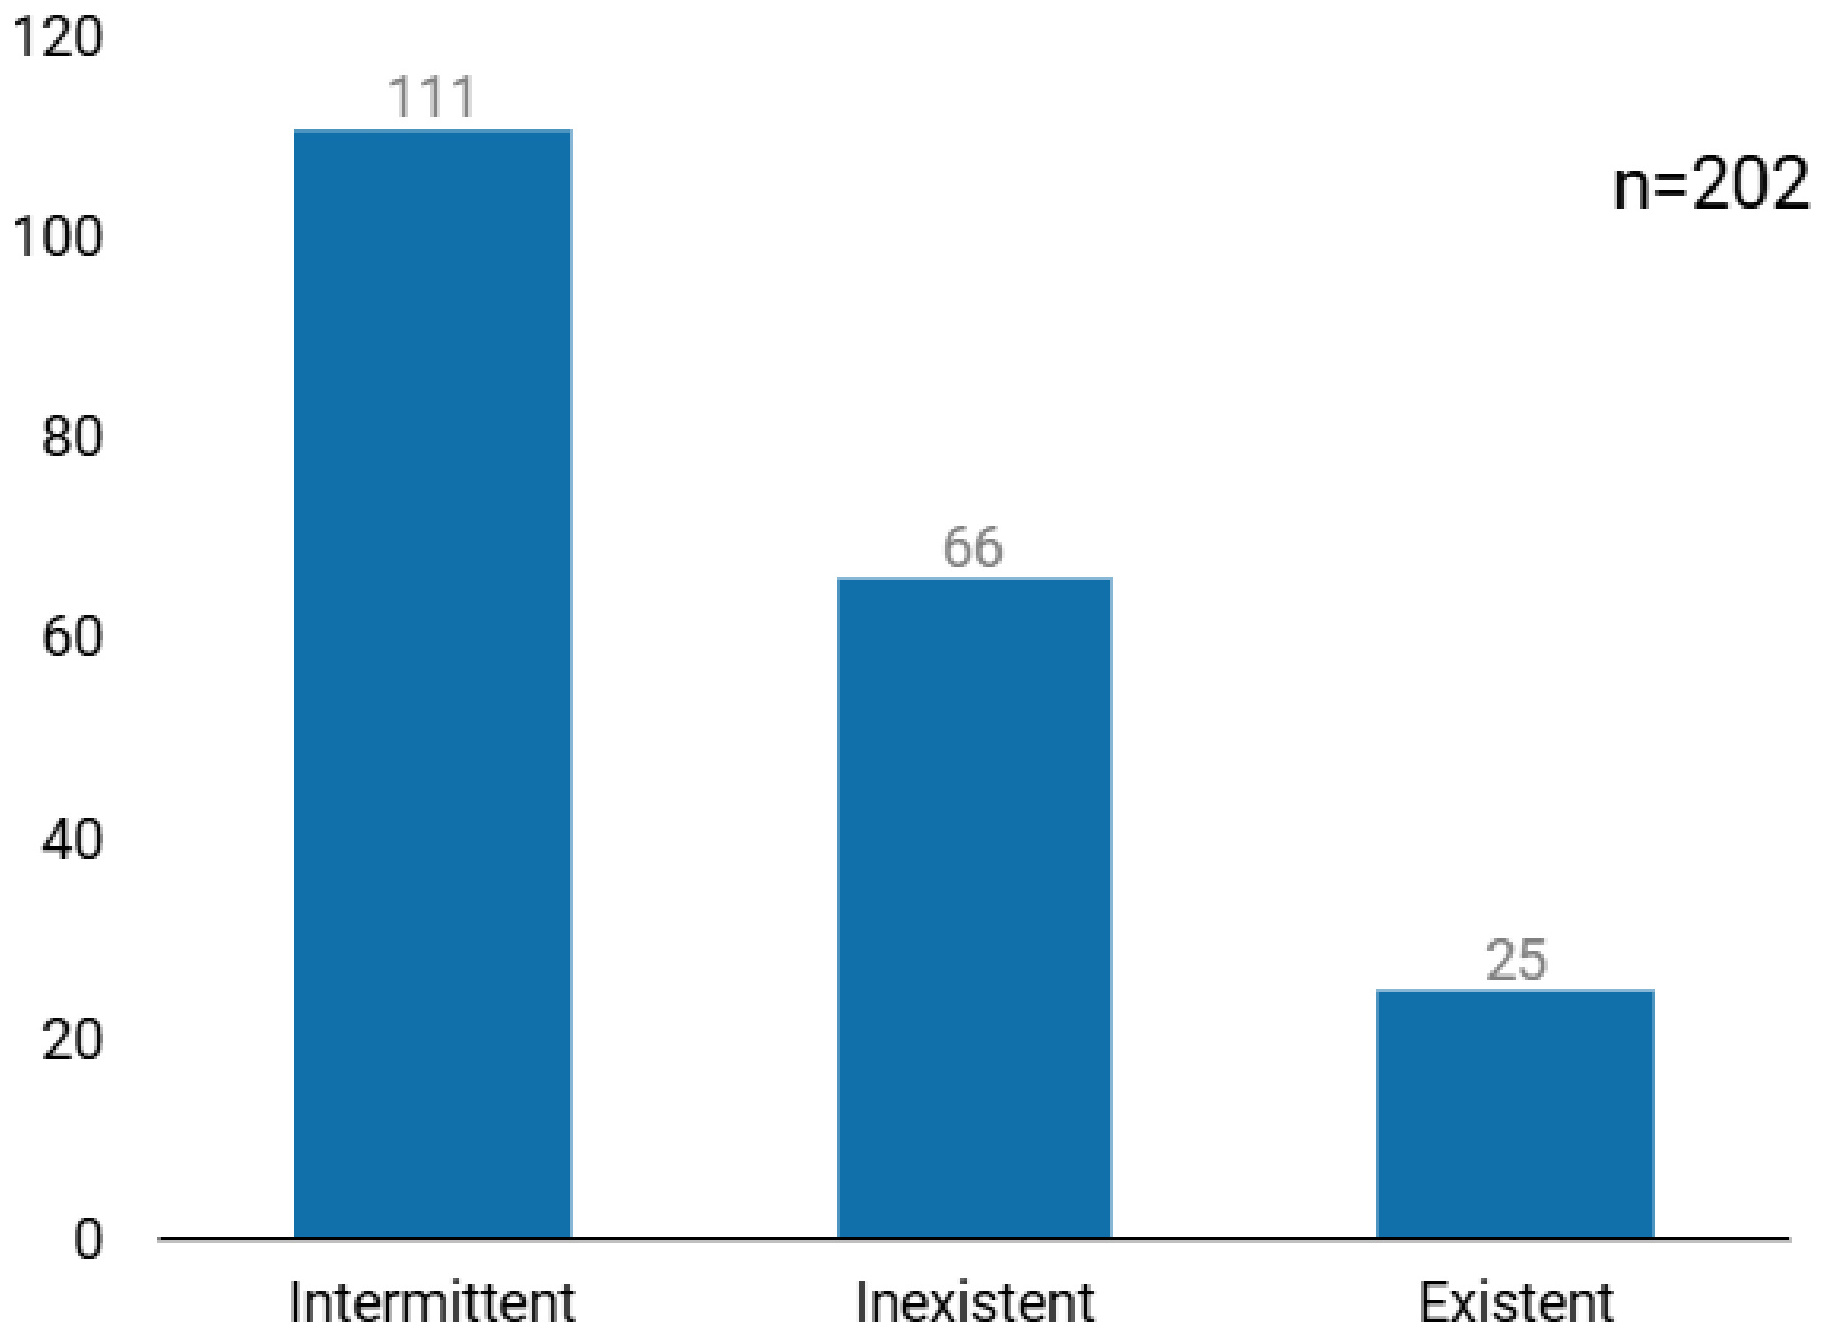
Figure 12 shows that most industrial environments (111 out of 202) had intermittent internet connectivity, typically activated on demand for configuration or remote support. This highlights the need for systems capable of operating both online and offline to ensure continuous functionality. In contrast, 66 cases reported no connectivity, revealing limitations that hinder the adoption of digital technologies and the potential for modernization through connectivity. Only 25 cases (12.4%) indicated continuous internet access, reflecting environments already prepared for cloud-based and possibly 5G-integrated solutions.

Figure 13 presents the distribution of inspection environments. Most installations (88) are closed areas, offering sufficient control and artificial lighting to ensure consistent inspection. Dedicated environments (78) feature enclosed setups with optimal and stable lighting conditions, supporting high inspection accuracy. Open environments (36) expose objects to uncontrolled lighting and external variables, posing greater challenges for CV systems and emphasizing the need for more robust solutions to handle environmental variability.

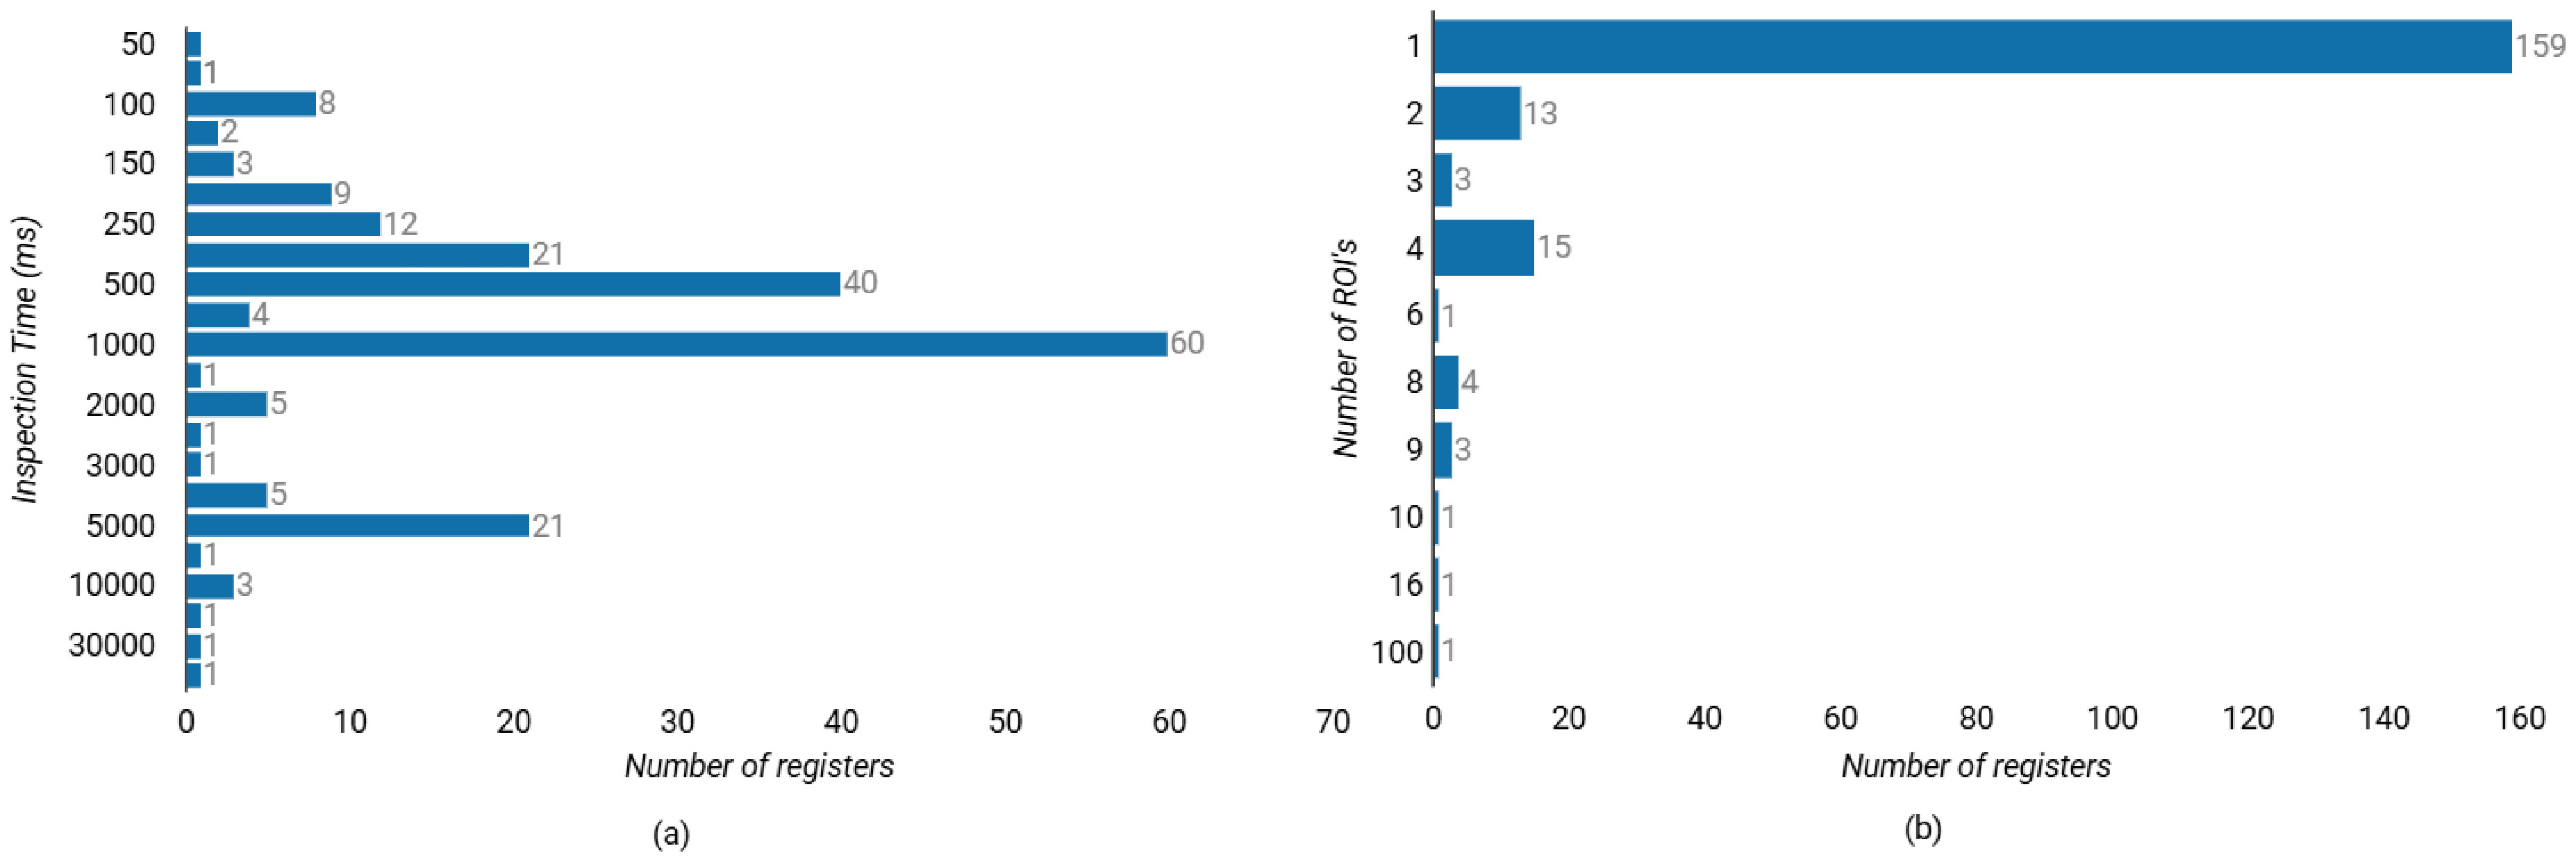
Figure 14 presents two key operational parameters of the POCs: inspection time and the number of regions of interest (ROIs). Across 202 measurements, inspection times varied widely, with a mean of 1,905 ms, a median of 875 ms, and a high standard deviation of 5,103 ms. The most frequent inspection time was 1,000 ms, while the maximum reached 60,000 ms, indicating the presence of extreme outliers and considerable process variability that may reflect specific inefficiencies or contextual challenges in certain industrial settings. Regarding ROIs, 201 records were analyzed, and in 159 cases, only a single ROI was used, as shown by the mode, median, and lower quartiles all equal to one, suggesting fixed-position inspections focused on a single feature. The average of 2.22 ROIs was inflated by a few high values (maximum of 100), with a standard deviation of 7.22, again indicating outliers rather than general dispersion. Overall, the results show that most industrial CV applications operate with short, consistent inspection times and a single ROI, with a few exceptional cases demanding higher complexity.

4.4. Correspondence analysis in the context of quality 4.0
A correspondence analysis was conducted to gain a comprehensive understanding of the interaction between various CV techniques within the Quality 4.0 framework. This analysis uncovers the relationships between different categories and their contributions to Quality 4.0 initiatives. Principal dimensions derived from this analysis illustrate the associations between categories, offering a visual representation that identifies patterns and clusters, essential for enhancing quality management through digital technologies. The correspondence analysis chart (Figure 15) maps the relationship between application categories and departments based on Quality 4.0 principles. The first axis (component X) captures the largest variance, while the second axis (component Y) represents additional variance. Application types (red points) and departments (blue points) are plotted to show their proximity and correlation. For example, "color inspection" is narrowly linked with "safety" indicating a solid application of CV for ensuring compliance and safety. "Measurement" is associated with "production" and "quality" reflecting its importance in maintaining production accuracy and quality. "Code reading" and "counting" are also near "production," suggesting their utility in inventory management and process tracking. Techniques like "binary inspection," "OCR/OCV," and "texture analysis" are closer to "quality", underscoring their role in quality control and compliance verification. Functional areas such as "maintenance" and "operations", although less associated with specific techniques, indicate a broader application of CV technologies, enhancing various operational aspects.
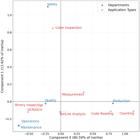
Figure 16 shows the relationship between application types and specific CV techniques within quality 4.0. Techniques such as "code reading" and "OCR/OCV" are positioned distantly from others along axis X, highlighting their unique applications in text and code recognition tasks. "Counting" and "measurement" are grouped, indicating shared techniques for quantification and precision tasks. "Texture analysis" and "color inspection", despite their central positions, differ along Component Y, suggesting diverse yet distinct applications for surface and color assessment. Techniques like “classification", "anomaly detection", and "background subtraction” cluster together with "binary inspection", implying their frequent use in defect detection and quality assurance tasks. Application types like "measurement", "counting", "texture analysis", and "binary inspection" seem to cluster together based on their usage or similarity in methods, showing separation from certain techniques (e.g., pattern recognition).
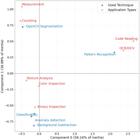
Figure 17 shows a detailed view of the relationship between general CV techniques and their subtechniques. Subtechniques such as "blob detection" and "geometric distance" cluster close to "OpenCV segmentation", indicating their use in similar contexts within Quality 4.0, like precision measurements and feature identification. "Color binarization" and "OpenCV segmentation" also share proximity, suggesting they are commonly used in tasks requiring color processing. Subtechniques related to "pattern recognition", such as "Codebar" and "OCR", are logically grouped, emphasizing their roles in automated identification and tracking. "YOLO", a real-time object detection method, is distinctively positioned, reflecting its specialized use in dynamic and real-time quality control environments. Subtechniques for "classification" such as “multilabel", "SVM", and "grid" are closely associated, highlighting their use in complex classification and anomaly detection tasks. "Background subtraction" is near "anomaly detection" and "SVM". This may indicate their combined use for separating objects of interest from backgrounds, which is crucial in automated inspection processes.

The correspondence analysis underscores the strategic deployment of CV techniques within Quality 4.0, revealing that these technologies enhance quality management. "Color inspection" applications are pivotal for security and compliance. At the same time, "measurement" and "counting" are integral to production accuracy and efficiency. Departments like maintenance and operations utilize a broad array of CV techniques, reflecting the versatility and adaptability of these technologies in various industrial scenarios. Moreover, the clustering of techniques such as "binary inspection" and "OCR/OCV" with quality-related tasks indicates their critical role in maintaining high standards and regulatory compliance. The distinct positioning of advanced subtechniques like "YOLO" and "multilabel" highlights their specialized applications in dynamic and complex quality assurance environments. By aligning CV capabilities with organizational objectives, businesses can effectively transition to a proactive and adaptive quality management system.
5. Discussion
The empirical analysis of 202 proofs of concept (POCs) developed in the learning factory provides evidence on the technical and organizational aspects influencing the adoption of computer vision within the Quality 4.0 framework. Based on real production parts and industrial demands, the results indicate the application patterns and the coexistence of persistent barriers and emerging opportunities that shape the trajectory of CV implementation in manufacturing.
A recurrent limitation identified in the POCs was the need for specific adjustments to integrate vision systems with legacy equipment and existing information flows. Synchronizing image capture, data processing, and production takt time often required custom engineering efforts. These observations are consistent with the literature that highlights integration and interoperability as enduring obstacles to the diffusion of digital technologies in manufacturing (Zhou et al., 2023). Furthermore, inspection cycle times varied substantially across applications – from milliseconds to several seconds – revealing that even when algorithms are effective, their operational fit depends on production speed and process synchronization.
Environmental conditions also proved to be a decisive factor for CV system performance. Many POCs required dedicated setups with controlled lighting and physical isolation from external interference. In contrast, applications tested in open environments experienced instability due to dust, vibration, and variable illumination. These findings corroborate Pacchini et al. (2019), who emphasized that robustness remains one of the main challenges for the industrial use of CV. The evidence suggests that, despite algorithmic advances, the physical and optical configuration of the system continues to impact its reliability in real production contexts.
Customization emerged as another critical element for success. Particularly in sectors such as agribusiness and food, achieving accurate results required tailor-made algorithms, specific illumination setups, and preprocessing routines adapted to the visual characteristics of products. Such findings support Smith et al. (2021), who noted that off-the-shelf CV solutions seldom meet industrial demands without contextual adaptation. This need for contextual adaptation reflects the analytical and collaborative dimensions of Quality 4.0, in which the integration of expertise and data analytics is essential to tailor digital solutions to specific production realities. Consequently, CV implementation remains an engineered process, dependent on expert knowledge and iterative fine-tuning rather than full plug-and-play integration.
The analysis also revealed recurrent connectivity constraints. Several POCs operated in environments with intermittent or absent internet access, limiting the feasibility of cloud-based inference and real-time monitoring. This reinforces Lu et al. (2020) argument that reliable digital infrastructure is essential for Industry 4.0 deployment. In such conditions, hybrid or edge-computing architectures may represent practical alternatives to support continuous operation while mitigating dependency on network availability.
Despite the above constraints, the results demonstrate the tangible potential of CV to improve quality inspection processes. The majority of successful POCs addressed binary inspection or dimensional measurement, which proved technically viable, scalable, and economically relevant. These systems replaced or supported manual inspection, improving repeatability and traceability. A smaller subset of projects explored more advanced applications – texture analysis, object counting, and real-time object detection (e.g., YOLO-based models) – indicating a gradual progression toward more sophisticated use cases. This evolution mirrors the broader trend of increasing technical maturity described by Smith et al. (2021).
From a Quality 4.0 perspective, these findings illustrate that CV is transitioning from isolated automation tools to key enablers of data-driven quality management. The growing use of classification, segmentation, and object-detection techniques signals a movement toward integrated, continuous-improvement systems that connect shop-floor inspection with broader analytics frameworks. However, the persistence of integration, customization, and connectivity challenges indicates that successful adoption depends not only on algorithmic capability but also on organizational readiness and infrastructure robustness.
For practitioners, the evidence highlights the importance of aligning CV deployments with the technological maturity of their production systems. Incremental implementation strategies, starting with structured, high-feasibility tasks and gradually advancing to complex real-time analyses, appear more sustainable than abrupt, large-scale rollouts. For researchers, the study underscores the need to further investigate hybrid architecture, adaptive models for variable environments, and frameworks that assess return on investment for Quality 4.0 technologies under different maturity levels.
6. Conclusions
This study contributes to the literature on Quality 4.0 and computer vision by providing empirical evidence from 202 proofs of concept of real industrial demands developed under conditions that replicated real production setups. The analysis offers a systematic overview of how CV has been applied in different sectors, highlighting both recurring challenges and emerging opportunities. These insights bridge the gap between theoretical discussions of Quality 4.0 and its practical implementation, complementing prior work that has emphasized the importance of understanding digital technologies in real industrial contexts (Zhou et al., 2023).
The findings indicate that challenges such as integration with legacy systems, the need for customization, environmental robustness, and connectivity constraints remain central barriers to implementation. At the same time, the POCs revealed opportunities for automating routine inspections, improving product quality, enabling real-time process adjustments, and scalability across sectors, underscoring the transformative role of CV within the Quality 4.0 paradigm.
From a managerial perspective, the results suggest that successful adoption of CV requires strategic alignment with existing infrastructure and production demands, as well as careful planning to ensure that inspection performance matches industrial requirements. Managers can use these findings to prioritize feasible applications while preparing for more advanced deployments.
Although conducted in a learning factory, the patterns identified mirror challenges and opportunities widely recognized in industry. Future studies should validate these findings in real production environments, across different sectors, and over time. Overall, the evidence demonstrates that computer vision is not merely an auxiliary inspection tool but a core technological enabler of Quality 4.0, strengthening its pillars of automation, data analytics, connectivity, and continuous improvement. By grounding these conclusions in empirical data, the study offers actionable insights to researchers and practitioners seeking to advance digital quality management in manufacturing.
Acknowledgements
The authors would like to thank the partner CV technology provider, its professionals, and the companies that provided samples for the study. This study was partially funded by CNPq, under the grant number 303440/2023-6.
Data availability
Research data are not publicly available due to confidentiality restrictions.
-
How to cite this article:
Marinho, F. O., Zomer, T. T. S., Durão, L. F. C. S., Cauchick-Miguel, P. A., & Zancul, E. (2026). Computer vision in Quality 4.0: empirical insights from industrial demands. Production, 36, e20250096. https://doi.org/10.1590/0103-6513.20250096
-
Financial support
This study was partially funded by CNPq, under the grant number 303440/2023-6.
-
Ethical Statement
This study did not involve human participants, human data, or animals. Therefore, ethical approval and informed consent were not required. Data acquisition was conducted under a formal research cooperation agreement between the involved institutions.
References
- Adams, S., Crannell, G., Bolcavage, A., McIntyre, R., & Beling, P. A. (2018, June). A condition monitoring system for low vacuum plasma spray using computer vision. In Proceedings of the 2018 IEEE International Conference on Prognostics and Health Management (ICPHM) USA: IEEE. https://doi.org/10.1109/ICPHM.2018.8448464.
-
Alaskar, H., Alhewaidi, S., Obaid, B., Alzahrani, G., Abdulahi, A., Sbai, Z., & Vaiyapuri, T. (2022). Dates fruit classification using convolution. Neural Networks : The Official Journal of the International Neural Network Society, 216, 757-775. https://doi.org/10.1007/978-981-16-1781-2_66
» https://doi.org/10.1007/978-981-16-1781-2_66 -
Araujo, P. R. M., & Lins, R. G. (2020). Computer vision system for workpiece referencing in three-axis machining centers. International Journal of Advanced Manufacturing Technology, 106(5-6), 2007-2020. https://doi.org/10.1007/s00170-019-04626-w
» https://doi.org/10.1007/s00170-019-04626-w -
Ardanza, A., Moreno, A., Segura, Á., de la Cruz, M., & Aguinaga, D. (2019). Sustainable and flexible industrial human machine interfaces to support adaptable applications in the Industry 4.0 paradigm. International Journal of Production Research, 57(12), 4045-4059. https://doi.org/10.1080/00207543.2019.1572932
» https://doi.org/10.1080/00207543.2019.1572932 -
Broday, E. E. (2022). The evolution of quality: from inspection to quality 4.0. International Journal of Quality and Service Sciences, 14(3), 368-382. https://doi.org/10.1108/IJQSS-09-2021-0121
» https://doi.org/10.1108/IJQSS-09-2021-0121 -
Castelli, F., Michieletto, S., Ghidoni, S., & Pagello, E. (2017). A machine learning-based visual servoing approach for fast robot control in industrial setting. International Journal of Advanced Robotic Systems, 14(6), 1729881417738884. https://doi.org/10.1177/1729881417738884
» https://doi.org/10.1177/1729881417738884 -
Chouhad, H., El Mansori, M., Knoblauch, R., & Corleto, C. (2021). Smart data driven defect detection method for surface quality control in manufacturing. Measurement Science & Technology, 32(10), 105403. https://doi.org/10.1088/1361-6501/ac0b6c
» https://doi.org/10.1088/1361-6501/ac0b6c - Deming, W. E. (1986). Out of the crisis Cambridge: MIT Press.
- Devereux, M. G., Murray, P., & West, G. (2021). automated object detection for visual inspection of nuclear reactor cores. Nuclear Technology, 208(1), 115-128. https://doi.org/10.1080/00295450.2020.1863067.
- Feigenbaum, A. V. (1991). Total quality control (3rd ed.). New York: McGraw-Hill.
-
Frank, A. G., Dalenogare, L. S., & Ayala, N. F. (2019). Industry 4.0 technologies: implementation patterns in manufacturing companies. International Journal of Production Economics, 210, 15-26. https://doi.org/10.1016/j.ijpe.2019.01.004
» https://doi.org/10.1016/j.ijpe.2019.01.004 - Garvin, D. A. (1988). Managing quality: the strategic and competitive edge New York: Free Press/Collier Macmillan.
- Gonzalez, R. C., & Woods, R. E. (2018). Digital image processing London: Pearson.
-
Greenacre, M., & Blasius, J. (2006). Multiple correspondence analysis and related methods New York: Chapman and Hall/CRC. https://doi.org/10.1201/9781420011319
» https://doi.org/10.1201/9781420011319 - Ishikawa, K. (1985). What Is total quality control?: The japanese way USA: Prentice Hall Direct.
-
Jacob, D. (2017). Quality 4.0 impact and strategy handbook: getting digitally connected to transform quality management [White paper]. LNS Research. Retrieved in 2025, October 21, from https://www.sas.com/en/whitepapers/quality-4-0-impact-strategy-109087.html
» https://www.sas.com/en/whitepapers/quality-4-0-impact-strategy-109087.html -
Javaid, M., Haleem, A., Pratap Singh, R., & Suman, R. (2021). Significance of Quality 4.0 towards comprehensive enhancement in manufacturing sector. Sensors International, 2, 100109. https://doi.org/10.1016/j.sintl.2021.100109
» https://doi.org/10.1016/j.sintl.2021.100109 -
Kang, H. S., Lee, J. Y., Choi, S., Kim, H., Park, J. H., Son, J. Y., Kim, B. H., & Do Noh, S. (2016). Smart manufacturing: past research, present findings, and future directions. International Journal of Precision Engineering and Manufacturing. Green Engineering, 3(1), 111-128. https://doi.org/10.1007/s40684-016-0015-5
» https://doi.org/10.1007/s40684-016-0015-5 -
LeCun, Y., Bengio, Y., & Hinton, G. (2015). Deep learning. Nature, 521(7553), 436-444. https://doi.org/10.1038/nature14539 PMid:26017442.
» https://doi.org/10.1038/nature14539 -
Li, L. (2018). China’s manufacturing locus in 2025: with a comparison of “Made-in-China 2025” and “Industry 4.0.”. Technological Forecasting and Social Change, 135, 66-74. https://doi.org/10.1016/j.techfore.2017.05.028
» https://doi.org/10.1016/j.techfore.2017.05.028 - Lu, Y., Morris, K. C., & Frechette, S. (2020). Current standards landscape for smart manufacturing systems (NISTIR 8107, 43 p.). USA: National Institute of Standards and Technology.
- Montgomery, D. C. (2009). Introduction to statistical quality control (6th ed.). Hoboken: John Wiley & Sons.
-
Morales, R., Badesa, F. J., Garcia-Aracil, N., Sabater, J. M., & Zollo, L. (2014). Soft robotic manipulation of onions and artichokes in the food industry. Advances in Mechanical Engineering, 2014, 345291. https://doi.org/10.1155/2014/345291
» https://doi.org/10.1155/2014/345291 -
Moru, D. K., & Borro, D. (2020). A machine vision algorithm for quality control inspection of gears. International Journal of Advanced Manufacturing Technology, 106(1-2), 105-123. https://doi.org/10.1007/s00170-019-04426-2
» https://doi.org/10.1007/s00170-019-04426-2 -
Pacchini, A. P. T., Lucato, W. C., Facchini, F., & Mummolo, G. (2019). The degree of readiness for the implementation of Industry 4.0. Computers in Industry, 113, 103125. https://doi.org/10.1016/j.compind.2019.103125
» https://doi.org/10.1016/j.compind.2019.103125 -
Radziwill, N. M. (2018). Quality 4.0: Let’s Get Digital - The many ways the fourth industrial revolution is reshaping the way we think about quality Retrieved in 2025, October 21, from https://arxiv.org/pdf/1810.07829
» https://arxiv.org/pdf/1810.07829 - Shewhart, W. (1931). Economic control of quality of manufactured product New York: D. Van Nostrand Company Inc.
-
Smith, M. L., Smith, L. N., & Hansen, M. F. (2021). The quiet revolution in machine vision - a state-of-the-art survey paper, including historical review, perspectives, and future directions. Computers in Industry, 130, 103472. https://doi.org/10.1016/j.compind.2021.103472
» https://doi.org/10.1016/j.compind.2021.103472 -
Sony, M., Antony, J., & Douglas, J. A. (2020). Essential ingredients for the implementation of Quality 4.0: a narrative review of literature and future directions for research. The TQM Journal, 32(4), 779-793. https://doi.org/10.1108/TQM-12-2019-0275
» https://doi.org/10.1108/TQM-12-2019-0275 -
Soustek, L., Martinek, R., Snajdr, L., & Bilik, P. (2020). Camera based tests of dimensions, shapes and presence based on virtual instrumentation. In I. Zelinka, P. Brandstetter, T. Trong Dao, V. Hoang Duy, & S. Kim (Eds.), AETA 2018 - Recent Advances in Electrical Engineering and Related Sciences: Theory and Application. AETA 2018. Lecture Notes in Electrical Engineering (Vol. 554). Cham: Springer. https://doi.org/10.1007/978-3-030-14907-9_94
» https://doi.org/10.1007/978-3-030-14907-9_94 - Srivastava, Y., Murali, V., & Dubey, S. R. (2019). PSNet: parametric sigmoid norm based CNN for face recognition. In Proceedings of the 2019 IEEE Conference on Information and Communication Technology, CICT 2019 USA: IEEE. https://doi.org/10.1109/CICT48419.2019.9066169.
-
Vijayan, A. T., Sankar, A., & Sudheer, A. P. (2017). A comparative study on the performance of neural networks in visual guidance and feedback applications. Automatika (Zagreb), 58(3), 336-346. https://doi.org/10.1080/00051144.2018.1437683
» https://doi.org/10.1080/00051144.2018.1437683 -
Wang, L., Liu, Z., Liu, A., & Tao, F. (2021). Artificial intelligence in product lifecycle management. International Journal of Advanced Manufacturing Technology, 114(3-4), 771-796. https://doi.org/10.1007/s00170-021-06882-1
» https://doi.org/10.1007/s00170-021-06882-1 -
Wang, Y., & Guo, H. (2014). Machine vision and applications. Applied Mechanics and Materials, 457-458, 1377-1380. https://doi.org/10.4028/www.scientific.net/AMM.457-458.1377
» https://doi.org/10.4028/www.scientific.net/AMM.457-458.1377 -
Wuest, T., Weimer, D., Irgens, C., & Thoben, K.-D. (2016). Machine learning in manufacturing: advantages, challenges, and applications. Production & Manufacturing Research, 4(1), 23-45. https://doi.org/10.1080/21693277.2016.1192517
» https://doi.org/10.1080/21693277.2016.1192517 -
Xu, L., Xu, E. L., & Li, L. (2018). Industry 4.0: state of the art and future trends. International Journal of Production Research, 56(8), 2941-2962. https://doi.org/10.1080/00207543.2018.1444806
» https://doi.org/10.1080/00207543.2018.1444806 - Zawada-Tomkiewicz, A., & Tomkiewicz, D. (2020). Monitoring system with a vision smart sensor. In M. Majewski, & W. Kacalak (Eds.), Innovations Induced by Research in Technical Systems. IIRTS 2019. Lecture Notes in Mechanical Engineering Cham: Springer. https://doi.org/10.1007/978-3-030-37566-9_9.
-
Zhou, L., Zhang, L., & Konz, N. (2023). Computer vision techniques in manufacturing. IEEE Transactions on Systems, Man, and Cybernetics. Systems, 53(1), 105-117. https://doi.org/10.1109/TSMC.2022.3166397
» https://doi.org/10.1109/TSMC.2022.3166397 -
Zonnenshain, A., & Kenett, R. S. (2020). Quality 4.0—the challenging future of quality engineering. Quality Engineering, 32(4), 614-626. https://doi.org/10.1080/08982112.2019.1706744
» https://doi.org/10.1080/08982112.2019.1706744
Edited by
-
Editor(s):
Adriana Leiras