 EVALUATION OF LOGISTICS RISK FACTORS WITH BWM METHOD; SIVAS PROVINCE EXAMPLE
ABSTRACT
This study investigates the logistics risk factors impacting Sivas, a strategically significant region in Turkey’s logistics network, especially within the Belt and Road Initiative (BRI) framework. Using the Best-Worst Method (BWM), the study analyzes nine main criteria and twenty-seven sub-criteria that can cause delays or disruptions in logistics activities. Data were collected from 15 logistics experts in Sivas through questionnaires and analyzed using Lingo 20.0 software. The analysis reveals that transportation risk is the most critical factor affecting logistics activities in Sivas, while organizational risks have the least impact. Specifically, accidents during transportation were identified as the most significant sub-criterion, whereas worker strikes were deemed the least significant. This study contributes to the literature by offering a detailed categorization and prioritization of logistics risks, providing actionable recommendations for mitigating these risks. Furthermore, it presents a transferable model applicable to other regions with similar logistical and economic profiles, offering valuable insights for policymakers and industry stakeholders.
Keywords:
logistics risk factors; best and worst method (BWM); multi criteria decision making
1 INTRODUCTION
Today, with the rapid advancement of technology, there has been a significant increase in the speed of accessing information and technology, thereby greatly facilitating businesses in their market outreach endeavors. The field of logistics, which originated as a military discipline in the annals of history, has now permeated every aspect of our lives. It encompasses a wide range of essential services such as transportation, storage, inventory management, packaging, and product handling. By efficiently managing these logistics functions, companies gain a competitive edge, allowing them to concentrate on their core activities in both local and global markets. In its essence, logistics can be described as the vital link within the supply chain, where the seamless flow of information, services, and products is established in a bidirectional manner. Its purpose is to ensure that the right product reaches the right place, at the right time, and at the right price, all while meeting the precise conditions and requirements of the customers. By forging strategic partnerships with various business entities, logistics strives to create added value for customers.
However, it is important to acknowledge that logistics operations also entail certain risk factors. These risks arise due to the diverse nature of logistics activities and the vast expanse of their operational scope. Such factors can lead to delays in logistics operations, potentially impacting the timely delivery of goods and services.
Despite these challenges, the ever-evolving realm of logistics continues to adapt and innovate. Technological advancements, coupled with effective risk management strategies, help mitigate these inherent risks, ensuring smooth and efficient logistics operations in today’s dynamic business landscape. Logistics risk can be defined as natural or human factors that cause a disruption or breakdown in the process of logistics activities at any stage. Companies can minimize these threats, which are generally considered unfavorable, by identifying them beforehand and reducing them to a minimum during their operations, thereby preventing time and cash losses. Barriers that are typically addressed after they arise affect the success of companies due to the additional costs and delays, they cause in operations, and they are crucial for the continuity of both private and public institutions’ futures, necessitating identifying possible risks and damages beforehand and planning solutions (Kaba 2013: 37-38).
This article makes a significant contribution to the state of the art by offering an in-depth analysis of the logistics risks associated with Sivas’s strategic role in Turkey’s logistics network, particularly within the context of the Belt and Road Initiative (BRI). It advances the discourse on logistics risk management by identifying and systematically categorizing the key risks that Sivas faces, including transportation, supply chain, and organizational challenges. By prioritizing these risks, the paper offers actionable recommendations for public and private institutions to mitigate them according to their severity. Furthermore, it presents a transferable model that can be applied to other regions with comparable logistics and economic profiles. As a result, this study enriches the current body of literature on regional logistics risk management and offers valuable insights for policymakers, industry stakeholders, and researchers focused on optimizing logistics networks in emerging economies.
In this study, logistics risk factors of companies in the logistics sector in Sivas province were evaluated using the Best and Worst Method (BWM), one of the Multi-Criteria Decision Making (MCDM) methods. Data obtained from experts through a survey was analyzed using Lingo 20.0 software. The chosen method was preferred in this study as it is newly developed in the literature, requires less pairwise comparisons than the Analytic Hierarchy Process (AHP). Since the evaluation of logistics risk factors using BWM has not been encountered in the literature, this study contributes to the literature in this regard.
The study consists of five sections. The next section will provide a literature review on both the risk factors and studies conducted using the BWM method. In the third section, the method used in the study will be introduced. The fourth section will present the application of the study based on the collected data. The final section will provide the results of the study.
2 LITERATURE REVIEW
In the study, literature review was conducted in three ways: (1) Studies Related to Risk Factor, (2) Studies using MCDM in assessing supply chain risks (3) Studies Using BWM.
2.1 Studies Related to Risk Factor
In conducting a literature review on risk factors, prior studies that aim to identify and select relevant factors were first examined to guide the determination of risk factors for this research.
Zsidisin and Ellram (2003) applied the agency theory framework to manage supplier behavior as a tool to mitigate supply risk and reduce the impact of harmful events. The main criteria assessed in the study included behavior-based management, buffer-focused management, and sources of supply risk. Sub-criteria such as requiring suppliers to hold inventory, inability to meet quality requirements, inability to meet delivery requirements, technological lagging, supplier development, and developing target costing with suppliers were considered. Additionally, factors like using multiple supply sources, inability to meet volume demand changes, competitive pricing, and supplier certification were examined.
Chopra and Sodhi (2004) explored the risk factors faced by companies in the supply chain. The main criteria assessed included systems, distribution, delays, capacity, intellectual property, inventory, procurement, and forecasts. Sub-criteria like system integration issues, supplier bankruptcy, war and terrorism, dependency on a single source, natural disasters, and highcapacity utilization at the supply source were evaluated. Other factors included e-commerce, excessive handling due to border crossings, forecast inaccuracies due to long lead times, sales promotions causing information distortion, short product life cycles, global outsourcing, fluctuating demand, exchange rate risk, and industry capacity utilization.
Wu et al. (2006) proposed an integrated methodology to classify, manage, and assess risk factors in inbound logistics activities. The study focused on criteria such as engineering/production, financial and insurance issues, market characteristics, accidents, quality, and natural/man-made disasters. Sub-criteria included supply continuity, delivery errors, financial health, technical innovation rate, knowledge management, employee accidents, and unexpected risk attacks. Other factors such as legal claims by customers, supplier management, IT/internet security, and natural disasters were also considered.
Cucchiella and Gastaldi (2006) developed a framework aimed at protecting businesses from risk factors. The study analyzed both internal and external sources such as information delays, customs regulations, capacity, internal organization, political environment, price fluctuations, and stochastic supplier quality factors.
Tang (2006) aimed to classify supply chain risk factors to provide practical access to these classifications. The study categorized the risk factors under four main headings in terms of strategic and tactical plans: supply management, product management, demand management, and information management. In the strategic planning group, product variety and supply chain visibility were assessed, while information sharing, vendor-managed inventory, and collaborative planning, forecasting, and supply criteria were evaluated in the tactical planning group.
Manuj and Mentzer (2008) developed an integrated global supply chain risk management model by drawing from various disciplines such as operations management, supply chain management, logistics, strategy, and international business. The authors categorized risk factors under eight main headings: demand risks, operational risks, security risks, supply risks, macro risks, competitive risks, policy risks, and resource risks.
Ritchie and Brindley (2009) examined risk criteria that affect supply chain performance under five main headings: timeliness, support, price, related costs, and quality. They emphasized the importance of creating reliable, robust, and practical measurement systems, highlighting the positive and negative effects of risk management activities on businesses in the supply chain.
Ho et al. (2015) conducted a comprehensive review of 224 international articles published between 2003 and 2013 on supply chain risk factors. They categorized risk factors under five common groups: production risks, macro risks, supply risks, demand risks, and infrastructure risks (financial, transportation, and information risks). They also examined supply chain risk management processes such as risk identification, mitigation, assessment, and monitoring.
Chatterjee and Kar (2016) used the fuzzy TOPSIS method to identify supply chain risks. They found that the most significant criterion was supply risk, while the least significant was control risk.
Kırılmaz and Erol (2017) conducted a study aimed at reducing supply-related risks, evaluating them under five main and 30 sub-criteria. They developed a procedure to apply these identified risks to an international automotive company, categorizing them into control, flexibility, avoidance, and collaboration.
Yolaç et al. (2019) conducted a literature review on logistics risk factors in Istanbul and analyzed the impact of risk management activities on business performance. The study revealed that managing supply and IT-related risks positively impacted supply chain performance, while managing demand, logistics, and environmental risks did not have a significant effect.
Demirkol (2019) conducted a study to identify risk factors in the supply chain and evaluate their impact on business performance, specifically focusing on the automotive industry in Turkey.
The study examined the relationship between processes designed to mitigate environmental, economic, security, and supplier-related risks and their impact on operational and supplier risks.
Panjehfouladgaran and Lim (2020) identified and clustered risk factors in reverse logistics activities, categorizing 42 logistics risk criteria into tactical, operational, and strategic groups.
Moktadir et al. (2024) reviewed the current and future status of multi-criteria decision-making (MCDM) methods in sustainable supply chain risk assessment. The authors analyzed 101 articles published since 2010, concluding that sustainable supply chain risks are generally assessed using one or two MCDM methods.
Gaudenz and Borghesi (2006) used the AHP method to evaluate supply chain risk factors, focusing on micro factors, information factors, demand factors, supply factors, production factors, and transportation factors. They found that delays and deficiencies in orders had the greatest impact, while waiting during production had the least.
Kull and Talluri (2008) evaluated supply chain risk factors using the AHP method and identified five main and 14 sub-criteria: delivery errors, flexibility errors, quality errors, cost errors, and trust errors. Delivery errors were found to be the most important criterion, while trust errors were the least important.
Schoenherr et al. (2008) conducted a case study in a U.S. manufacturing company, assessing supply chain risks in international procurement using AHP. They evaluated the risks of supply chain activities in Mexico and China, finding that product cost was the most significant risk factor, while engineering and innovation were the least.
Faisal (2009) used the AHP method to prioritize supply chain risk factors, grouping them into relational, financial, physical, and informational sub-chains. The most significant risk criterion was found to be financial, while the least important was relational.
Tuncel and Alpan (2010) conducted an industrial case study to identify and analyze supply chain risk factors, categorizing them into four main groups: manufacturer, inbound/outbound logistics, customers, and suppliers. The authors concluded that system performance could be improved and overall system costs reduced through risk management actions and mitigation scenarios.
Korucuk and Erdal (2018) examined logistics risk factors in Samsun using AHP and VIKOR methods. The study focused on five main criteria: packaging risks, transportation-related risks, organizational risks, purchasing risks, and inventory-related risks. The analysis revealed that packaging risks were the most significant factor, followed by transportation-related risks.
Mital, Del Giudice, and Papa (2018) used cognitive maps and AHP methods to identify supply chain risks for four different product groups, including rice, mobile phones, milk, and cigarettes. The main criteria evaluated in the study were buyer-supplier relationships, quality, continuity of supply, supplier service, and cost. The results showed that the risk varied depending on the product supply chain.
2.2 Studies using MCDM in assessing supply chain risks
The second part of the literature review consists of studies using MCDM in assessing supply chain risks. Table 1 shows studies using MCDM in assessing supply chain risks.
2.3 Studies Using BWM
The studies conducted using the BWM method in the third part of the literature review are listed in Table 2.
As a result of the literature review, the main criteria and sub criteria included in the logistics risk factors were determined. The determined criteria are listed in Table 4. Additionally, as a result of the literature review, BWM, one of the MCDM methods, was deemed appropriate to evaluate logistics risk factors.
BWM has some important advantages that make it reliable (Rezaei, 2015:56).
-
BWM can determine criteria weights alone and can be integrated with different MCDM methods.
-
Only integers are used in BWM. This makes the use of BWM even easier.
-
The BWM method assesses the consistency of responses provided in the questionnaire.
3 METHODOLOGY
In this section, the BWM used in the study will be introduced.
3.1 Best and Worst Method (BWM)
BWM (Best and Worst Method) was developed as the MCDM method by Rezeai in 2015 (Rezeai, 2015). In this method, the best and worst criteria are determined by the decision maker, and then pairwise comparisons are made to find the weights of the criteria. In this study, logistics risk criteria were evaluated with linguistic terms specified in Table 3 by decision makers using BWM.
The steps of the Best and Worst method are as follows (Rezaei, 2015):
Step 1. Determining the criteria (C 1, C 2, C 3,. . . ,C n )
Step 2. Involves determining the decision maker’s best and worst criteria. Here, the best refers to the most important criteria and the worst refers to the least important criteria.
Step 3. In this step, the importance of the best criterion (most important criterion) relative to other criteria is determined using Table 2. As a result of the comparisons, the Best-Others (A B ) vector is obtained, which shows the importance of the best criterion compared to other criteria. The vector A B is shown in Equation 1.
Each a Bj in the vector A B shown in Equation 1 shows the importance of the best criterion, B according to the j criterion. Also, since the criterion A BB is compared with itself, the degree of importance becomes 1 (Equally Important).
Step 4. In this step, the importance levels of the other criteria according to the worst criterion (least important criterion) are determined using Table 2. As a result of the comparisons, the Others-Worst (A W ) vector is obtained, which shows the importance of other criteria compared to the worst criterion. The vector A W is shown in Equation 2.
Each a jW in the vector A W shown in Equation 2 shows the degree of importance of the criterion j relative to the worst criterion W. Also, since the criterion A WW is compared with itself, the degree of importance becomes 1 (Equally Important).
Step 5: With the model shown in Equation 3, the optimum weights of the criteria and the consistency indicator (ξ L ) are calculated. If the consistency indicator is close to “0”, it indicates high consistency (Rezaei, 2016).
4 APPLICATION
This study identifies the factors that have the greatest and least impact on logistics activities in Sivas, Turkey, based on nine main criteria and twenty-seven sub-criteria that may cause delays and/or disruptions in logistics processes. The determined criteria were selected from the studies under the heading 2.1 Studies Related to Risk Factors of the literature review. The selected criteria were evaluated as logistics risk factors. The selected criteria are given in Table 4. Surveys were conducted with 15 experts consisting of private sector companies, public institutions, and academic professionals from the international trade and logistics department in Sivas province. These surveys were developed by adapting the criteria related to logistics risk factors.
Each expert was individually surveyed, and the survey results were applied to the BWM using Lingo 20.0 software.
Some risk factors shown in Table 4 are classified as supply chain risks while others are classified as logistics risks.
-
Logistics Risks: Transport Risk Criteria (TRC), Inventory Risk Criteria (IVRC), Information Risk Criteria (IRC)
-
Supply Chain Risks: Macro Risk Criteria (MRC), Supply Risk Criteria (SRC), Production Risk Criteria (PRC), Financial Risk Criteria (FRC), Technology Risk Criteria (TCRC), Organizational Risk Criteria (ORC).
The principal objective of this study was to analyze the specific logistics risks associated with Sivas’ strategic role within the Turkish logistics network. Nevertheless, it is acknowledged that some of the risk criteria examined also overlap with broader supply chain risks. This is due to the close interconnectivity of logistics and supply chain processes, whereby disruptions in logistics can have cascading effects throughout the supply chain. For example, risks pertaining to transportation and supply directly impact the performance of the supply chain. Delays or disruptions in logistics can result in supply shortages or inefficiencies throughout the chain.
Furthermore, in accordance with the opinions of the 15 experts who participated in the study for a more comprehensive analysis, it was deemed appropriate to consider the supply chain risks outlined in Table 4 as part of the logistics risk factors.
The analysis of main criteria and sub-criteria according to Decision Maker 1 (DM 1) is presented in Table 5 and Table 6, respectively, to show the implementation steps of BMW.
According to Table 5, A B = {1,3,2,9,7,6,8,5,4} and A W = {9,7,8,1,3,4,2,5,6}. With Equation 3, the main criteria weights are found for DM 1. DM 1 assessed the sub-criteria in an analogous manner. Table 6 presents the evaluation of the sub-criteria of the FRC main criterion by decision maker DM 1 as an example of this assessment. The main criteria weights found are shown in Table 7.
According to Table 6, A B = {1,9,7} and A W = {9,1,7}. With Equation 3, the sub-criteria weights are found for DM 1. The sub-criteria weights found are shown in Table 7.
The same procedures are applied to other decision makers in order to calculate the weights of the main and sub-criteria. Then the weights of the main criteria are multiplied by the weights of the sub-criteria and the combined weights of the sub-criteria are found. The criteria weights and consistency rates for DM 1 are shown in Table 7.
According to DM 1, while the most important main criterion is Macro Risk criteria, it is seen that the least important criterion is production risk criteria. Again, according to DM 1, while the most important sub-criteria is the risks arising from war and terrorism, it has been concluded that the least important sub-criterion is capacity flexibility. Since the consistency ratios were found close to 0 in the analyzes performed for DM 1, it can be said that the results are consistent.
After applying the same procedures to other decision makers, the results of 15 decision makers are combined in the last step. The geometric mean is used in the merging process. The overall combined weights are obtained by taking the geometric mean of the combined weights of the main criteria and sub-criteria. The overall combined weight averages of the main criteria are shown in Table 8 and the sub-criteria in Table 9.
In Table 8, it is seen that the most important main risk criteria among 9 main criteria are “transportation risk criteria” and the least important main risk criteria are “organizational risk criteria”.
Based on the analysis presented in Table 9, “accidents during transportation” emerges as the most significant sub-risk criterion among the 27 sub-criteria, while “system integration or covered system network” ranks as the least significant.
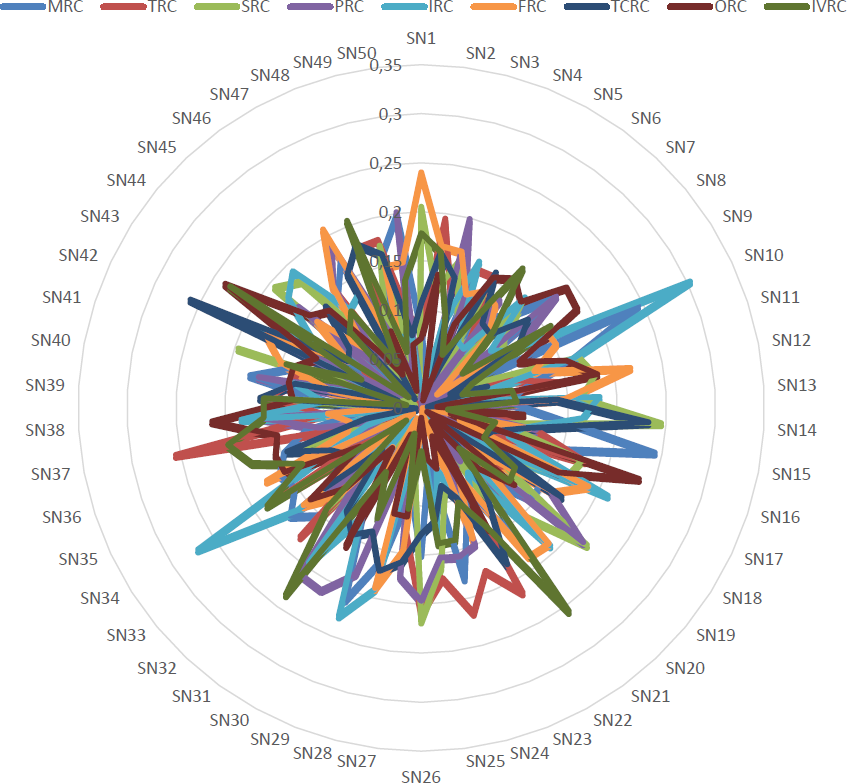
Furthermore, a sensitivity analysis was carried out in this study by varying the weights of the main criteria using Monte Carlo simulation. The simulation included fifty scenarios with different weight variations for the main criteria. The results of the sensitivity analysis are displayed in Figure 1.

In each of the fifty different scenarios, the weights of the main criteria are different, as can be seen in Figure 1.
5 DISCUSSION
5.1The Aggregation Methodology
The geometric mean application for aggregating weights is a significant methodological decision in this study and offers numerous essential benefits. The geometric mean is particularly effective for merging weights due to its capacity to maintain proportional relationships among data. The arithmetic mean is calculated by averaging the sum of the data, whereas the geometric mean is derived from the product of the data. This allows each weight to contribute to the aggregate value, more precisely representing the proportional disparities between the weights. For instance, if a multiplier effect or proportional relationship exists among certain criteria, the geometric mean may effectively represent this structure, whereas the arithmetic mean may overlook it.
The geometric mean facilitates a more equitable outcome by diminishing the effect of extreme high or low weights on the aggregate value. Outliers can significantly influence the total and distort the outcomes in arithmetic mean. The geometric mean mitigates the influence of outliers and offers a more equitable representation of the entire spectrum of weights in a composite measure. This enhances the robustness and reliability of our analytical results.
Another significant rationale for employing the geometric mean in weight aggregation is its compatibility with nonlinear data. Certain variables and weights in our study may exhibit a proportional or multiplicative relationship rather than a linear combination. In such instances, the geometric mean more accurately reflects these non-linear correlations.
The application of the geometric mean is more rational and significant when derived from the product of two components or the computation of growth rates. The geometric mean is an average defined exclusively for non-zero and positive numbers, ensuring mathematical and conceptual consistency. This ensures the significance and conceptual coherence of the combination when all weights are non-negative and equal to non-zero. This is a significant advantage, particularly when dealing with ratios, indices, or percentage expressions, and enhances the mathematical coherence of integrating weights in this study’s analysis.
In conclusion, the use of the geometric mean furnishes a cohesive depiction of weights in this study, while presenting significant benefits such as maintaining proportional relationships, mitigating the influence of outliers, and encapsulating non-linear structures. Consequently, the geometric mean is regarded as a significant and judicious selection that bolsters the methodological rigor of this study and the validity of the analytical outcomes.
5.2 Logistics Risks and Opportunities in the Sivas Region
Sivas, with its central location in Turkey, diverse economic structure, and significant logistics potential, holds strategic importance. The geopolitical position, economic framework, and logistical significance of Sivas, especially in the context of the Belt and Road Initiative (BRI), warrant detailed discussion. Sivas’s central location places it at the crossroads of major trade routes, making it a critical hub in the logistics network. This strategic position facilitates the distribution of goods and enhances the efficiency of logistics operations.
The economic structure of Sivas is diverse, encompassing industries such as manufacturing, agriculture, mining, and services. The production of cement, textiles, and food products significantly contributes to both local and national economies. The agricultural sector is robust, with the production of cereals, fruits, and livestock playing a vital role in the province’s economic stability. Additionally, Sivas possesses substantial mineral resources, including iron and coal, which support local industries and generate employment opportunities. This diversity makes Sivas economically dynamic.
From a logistics perspective, Sivas’s importance is multifaceted. The province serves as a major transit point for goods moving between the eastern and western regions of Turkey. Wellestablished road and rail networks facilitate seamless transportation, reducing transit times and costs. Furthermore, the Belt and Road Initiative presents significant opportunities for Sivas by integrating it into the larger international trade network. Infrastructure development under the BRI can lead to increased trade volumes, improved supply chain efficiency, and greater economic integration with global markets. Inclusion in the BRI framework can attract investments in infrastructure, such as the modernization of railways, highways, and logistics centers, further bolstering Sivas’s role as a logistics hub.
However, it is crucial to acknowledge that Sivas faces various logistics risks that can disrupt operations. The primary risks identified in this study include transportation risks (such as accidents and road disruptions), supply risks (like the inability to handle volume demand changes), and organizational risks (including worker strikes and staff shortages). To mitigate these risks and ensure smooth logistics operations, effective risk management strategies are essential.
Transportation risks emerged as the most critical, with accidents during transportation being the most significant sub-risk. To mitigate this, improving road safety measures, regular maintenance of transport infrastructure, and enhancing driver training programs are essential. The inability to handle volume demand changes is a major supply risk. Strategies such as diversifying suppliers, maintaining safety stock, and improving demand forecasting can help mitigate these risks. Worker strikes and staff shortages are identified as significant organizational risks. Implementing fair labor practices, providing competitive wages, and investing in employee training and development can reduce these risks.
In conclusion, Sivas holds a strategic position in Turkey’s logistics network due to its central location and robust economic structure. The province’s logistical importance is further enhanced by its potential integration into the Belt and Road Initiative, which promises increased trade connectivity and infrastructure development. However, managing logistics risks effectively is crucial to fully leveraging these advantages. By addressing transportation, supply, and organizational risks through targeted strategies, Sivas can strengthen its role as a logistics hub and contribute significantly to Turkey’s economic growth.
5.3 Risks Analysis
In the previous section, a brief introduction to the logistics risks in the Sivas region is provided, and in this section, the risk analysis is detailed, examining the impact of various risk factors on the logistics network in depth. The analysis of logistics risks in Sivas, conducted through the BWM, provides a nuanced understanding of the varying degrees of impact that different risk factors have on the logistics network. The results indicate that “transportation risk criteria” hold the highest importance, while “organizational risk criteria” are considered the least significant. This prioritization offers valuable insights into the logistics dynamics of Sivas and guides risk management strategies.
-
Transportation Risk Criteria as the Most Critical: The prioritization of transport risk criteria, with “accidents during transportation” being the most significant sub-criterion, underscores the vital role of transportation in Sivas’s logistics network. Sivas’s strategic location at the crossroads of major trade routes increases the volume and frequency of transportation activities, inherently elevating the risk of accidents and disruptions. The high ranking of transport risks highlights the vulnerability of logistics operations to transportation-related issues, suggesting that any delays or disruptions in transport can have cascading effects on the entire supply chain. This finding indicates that efforts to improve transportation safety, infrastructure, and management in Sivas are crucial for enhancing the overall efficiency and reliability of the logistics network.
-
Supply Risks as a Key Concern: The analysis also identifies supply risk criteria as another significant concern, particularly the “inability to handle volume demand changes”. This reflects the dynamic nature of demand in logistics operations, where fluctuations in volume can pose substantial challenges. Sivas’s role as a logistics hub requires it to adapt quickly to changes in demand, and failure to do so can lead to delays, shortages, and inefficiencies. This result suggests that supply chain flexibility and responsiveness are essential for maintaining a smooth flow of goods. Mitigating these risks involves strategies such as diversifying suppliers, maintaining safety stock, and improving demand forecasting to ensure that supply chains are robust and adaptable to market changes.
-
Organizational Risks as the Least Significant: The finding that organizational risks, including worker strikes, lack of experience, and staff shortages, are the least important criteria may initially seem counterintuitive. However, this result can be interpreted within the specific context of Sivas’s logistics operations. Organizational risks generally have a more indirect and long-term impact compared to the immediate effects of transport or supply disruptions. In a region where the logistics network’s efficiency heavily depends on the uninterrupted movement of goods, the immediate operational risks take precedence. This does not imply that organizational risks are unimportant; rather, it suggests that, in the current context, their impact is perceived as less critical compared to other risk factors. It also points to a potentially well-managed organizational framework in Sivas, where such risks are either well-mitigated or have less direct influence on logistics outcomes.
-
Macro and Financial Risks: The moderate ranking of macro and financial risks further emphasizes the focus on operational efficiency in Sivas. While macro risks like natural disasters and geopolitical issues are important, their infrequency compared to day-to-day operational risks like transport and supply disruptions makes them relatively less significant in the eyes of decisionmakers. Similarly, financial risks such as price fluctuations and exchange rates, while influential, do not directly disrupt logistics operations in the short term. This suggests a risk management approach in Sivas that prioritizes operational continuity and immediate risk mitigation over more sporadic and long-term financial and macroeconomic concerns.
5.4 Implications for Management
The results of this analysis have important implications for both public and private stakeholders in Sivas’s logistics sector. The prioritization of transport and supply risks indicates that investments in infrastructure, safety measures, and supply chain flexibility are key to enhancing the resilience of Sivas’s logistics network. Addressing transport risks through improved road safety, infrastructure development, and enhanced driver training programs can significantly reduce the likelihood of disruptions. Additionally, enhancing the supply chain’s responsiveness to demand changes through strategic planning and supplier diversification can further stabilize logistics operations.
In summary, the results of this study provide a clear roadmap for mitigating logistics risks in Sivas by emphasizing the areas that require the most attention and resources. By focusing on transport and supply risks while maintaining a proactive approach to less critical risks, such as organizational and financial factors, Sivas can strengthen its position as a strategic logistics hub in Turkey.
6 CONCLUSION
Logistics risk can be defined as natural or human criteria that may occur at any stage of logistics activities and cause disruption of business processes or processes. The aim of the study is to determine the logistics risk factors that affect the logistics activities the most and least in the province of Sivas, which has geopolitical importance due to Turkey’s central location and is desired to be turned into a logistics center in order to evaluate this feature. The data used in the study were obtained by means of a questionnaire created by compiling the criteria used in similar studies in the literature with a team of 15 experts, consisting of experts from the private sector, public institutions, and logistics departments operating in Sivas. The data obtained from the questionnaires were adapted to BWM using the Lingo 20.0 program. The logistics risk factors of Sivas province were determined and ranked according to their importance (weights). Thus, it is aimed to provide a new contribution to the literature by obtaining different results on the most significant risk criteria, although there are similar studies and the possibility of taking precautions against the risks that may occur in the activities to be carried out in the logistics center to be established.
This article contributes to the state of the art by providing a comprehensive analysis of the logistics risks of Sivas having a strategic role in Turkey’s logistics network, particularly within the framework of the Belt and Road Initiative (BRI). The paper develops the logistics risk management discourse by identifying and categorizing the main risks facing Sivas, including transport, supply and organizational challenges. By prioritizing the logistics risks in Sivas, the paper suggests various public and private institutions to mitigate these risks in order of importance, as well as proposes a model that can be adapted to other regions with similar logistics and economic profiles. Hence, this study enriches the existing literature on regional logistics risk management and can provide valuable insights for policymakers, industry stakeholders, and researchers interested in optimizing logistics networks in emerging economies.
This article presents the results obtained through the BWM analysis within the context of Sivas’s role in the logistics network, focusing on the overall evaluation of these results. According to the main findings of the article, the most significant main risk criterion was identified as “transportation risk criteria” while the least significant was “organizational risk criteria”. To gain a deeper understanding of the reasons behind these outcomes, the following details should be examined:
-
Importance of Transportation Risk Criteria: Given Sivas’s critical role in Turkey’s logistics network, transport risks hold significant importance. As a key intersection point for major trade routes, the safety and efficiency of transportation operations in Sivas are vital. In the analysis, “accidents during transportation” were identified as the most critical sub-criterion under the “transportation risk criteria”. This indicates that any disruption in transportation activities, particularly accidents, can significantly impact the overall effectiveness of the supply chain. The success of the logistics network heavily relies on the smooth functioning of the transportation process; hence, risks such as accidents directly affect Sivas’s logistics performance. Consequently, transport risks are seen as the most critical factor in the overall risk assessment.
-
Relative Insignificance of Organizational Risks: Organizational risks include factors such as staff shortages, worker strikes, and lack of employee experience. In the context of Sivas, these risks are considered less critical compared to transport risks for several reasons. First, the impact of organizational risks on logistics operations is generally longer-term and indirect. For instance, while staff shortages or strikes can affect logistics activities, these effects are often not as immediate and severe as those caused by transport accidents or road disruptions. Second, in Sivas’s logistics activities, the effective management of transportation and supply chain operations emerges as a higher priority compared to organizational risks. As a result, such organizational risks are evaluated as having lower importance in the overall outcomes of the BWM analysis.
This analysis indicates that the logistics risk profile of Sivas needs to be optimized with a focus on transportation safety and efficiency. The prioritization of transport risks emphasizes the need to concentrate on this area to enhance the reliability of logistics activities in Sivas. Therefore, improving transportation infrastructure, preventing accidents, and ensuring the safety of the transportation process emerge as critical strategies to enhance Sivas’s effectiveness in the logistics network.
In the method applied based on the rating made by the decision makers participating in the study, considering the institutions/organizations they work for, it is seen that the most significant main criterion according to DM 1 is Macro Risk criteria, while the least significant criterion is production risk criteria. Again, according to DM 1, while the most significant sub-criteria is the risks arising from war and terrorism, it has been concluded that the least significant sub-criterion is capacity flexibility. According to DM 2, while the most significant main criterion is macro risk criteria, it is seen that the least significant criterion is technology risk criteria. Additionally, according to DM 2, it was concluded that the most significant sub-criteria was war and terrorism, and the least significant sub-criterion was the inability to keep up with the technology. According to DM 3, while the most significant main criterion is supply risk criteria, it is seen that the least significant criterion is macro risk criteria. Besides, according to DM 3, the most significant subcriterion was the risks arising from not being able to manage volume demand changes, while it was concluded that the least significant sub-criterion was caused by natural disasters. According to DM 4, while the most significant main criterion is transportation risk criteria, it is seen that the least significant criterion is macro risk criteria. Furthermore, according to DM 4, while the most significant sub-criteria is the risks arising from accidents occurring during transportation, it has been concluded that war and terrorism and foreign legal problems are less significant than other criteria. According to DM 5, the most significant main criterion is organizational risk criteria, while the least significant criterion is information risk criteria. Again, according to DM 5, it was concluded that the most significant sub-criteria was the risks arising from not being able to provide competitive pricing, while the least significant sub-criterion was caused by internet security. According to DM 6, the most significant main criterion is production risk criteria, while the least significant criterion is organizational risk criteria. Furthermore, according to DM 6, it was concluded that while the most significant sub-criteria was the risks arising from production efficiency, the sub-criterion with the least importance was caused by the lack of experience or education. According to DM 7, while the main criterion with the most significant criterion weight is production risk criteria, it is seen that the least significant criterion is macro risk criteria. Besides, according to DM 7, while the most significant sub-criteria is the risks arising from production efficiency, it has been concluded that the sub-criteria with the least importance degree and equal criterion weight are wars and terrorism and foreign legal problems. According to DM 8, while the most significant main criterion is macro risk criteria, it is seen that the least significant criterion is production risk criteria. Besides, according to DM 8, while the most significant sub-criteria is the risks from natural disasters, it was concluded that the least and equally significant sub-criteria are the risks arising from the capacity cost and capacity flexibility. According to DM 9, the most significant main criterion is supply risk criteria, while the least significant criterion is information risk criteria. Besides, according to DM 9, the most significant sub-criteria is the risks arising from not being able to provide competitive pricing, while the least-significant sub-criterion is seen to arise from the risk of system integration or covered system network. According to DM 10, the most significant main criterion is transportation risk criteria, while the least significant criterion is production risk criteria. Furthermore, according to DM 10, while the most significant sub-criteria is the accidents occurring during transportation, it is seen that the least significant sub-criterion is the risk criteria arising from production efficiency. According to DM 11, the most significant main criterion is production risk criteria, while the least significant criterion is inventory risk criteria. Besides, according to DM 11, the most significant sub-criteria is the risks arising from production efficiency, while the least significant sub-criterion is the risks arising from the product obsolescence rate. According to DM 12, the most significant main criterion is transportation risk criteria, while the least significant criterion is financial risk criteria. Besides, according to DM 12, the most significant sub-criterion is the accidents that occur during transportation, while the least significant sub-criterion is the risks arising from the low profit margin. According to DM 13, the most significant main criterion is transportation risk criteria, while the least significant criterion is inventory risk criteria. Besides, according to DM 13, while the most significant sub-criteria is the accidents occurring during transportation, it is seen that the least significant sub-criterion is the product obsolescence rate. According to DM 14, the most significant main criterion is supply risk criteria, while the least significant criterion is transportation risk criteria. Furthermore, according to DM 14, the most significant sub-criteria is the risks arising from the capacity and responsiveness of alternative suppliers, while the least-significant sub-criteria are the risks arising from the risk of deterioration on the road. According to DM 15, the most significant main criterion is transportation risk criteria, while the least significant criterion is the risk criteria arising from production efficiency. Besides, according to DM 15, it is seen that the most significant sub-criteria are the accidents that occur during transportation, while the least significant sub-criteria are the risks arising from production efficiency.
In addition, according to the combined criteria weights as a result of the study, the most significant main criterion affecting the logistics processes in Sivas province is transportation risk criteria, the least affecting risk factor is organizational risk criteria, the most significant subcriteria is accidents during transportation, the least significant sub-criteria is system integration, or it was found that there is a covered system network.
Among the significant reasons why this study gave different results from other studies, it can be said that the variety of criteria used, the difference of decision makers, and the difference in the logistics activity conditions and requirements of the city where the study was carried out. In future studies, fuzzy or gray method can be evaluated using the FUCOM method or the Entropy methods. They can also apply BWM to other MCDM problems, such as prioritizing supply chain management drivers, logistics risks, and purchasing risks.
References
- ABDEL-BASSET M, GUNASEKARAN M, MOHAMED M & CHILAMKURTI N. 2019. A framework for risk assessment, management and evaluation: Economic tool for quantifying risks in supply chain. Future Generation Computer Systems, 90(1): 489-502.
- ABDEL BASSET M & MOHAMED R. 2020. A novel plithogenic TOPSIS-CRITIC model for sustainable supply chain risk management. Journal of Cleaner Production, 247(119586): 1-15.
- AHMAD W, REZAEI J, SADAGHIANI S & TAVASSZY L. 2017. Evaluation of the external forces affecting the sustainability of oil and gas supply chain using Best Worst Method. Journal of Cleaner Production , 153: 242-252.
- AKSAKAL B, ULUTAŞ A, BALO F & KARABASEVIC D. 2022. A new hybrid MCDM model for insulation material evaluation for healthier environment. Buildings, 12(5).
- ALI A & RASHID T. 2021. Best-worst method for robot selection. Soft Computing, 25(1): 563-583.
- ALI S, MOKTADIR M, KABIR G, CHAKMA J, RUMI M & ISLAM M. 2019. Framework for evaluating risks in food supply chain: Implications in food wastage reduction. Journal of Cleaner Production , 228: 786-800.
- ARSLANHAN H & TOSUN O. 2021. Solving transport mode selection problem with integrated best-worst and WASPAS methods. Pamukkale Ü niversitesi Mühendislik Bilimleri Dergisi, 27(1).
- SKARIFAR K, MOTAFFEF Z & AAZAAMI S. 2018. An investment development framework in Iran’s seashores using TOPSIS and best-worst multi-criteria decision-making methods. Decision Science Letters, 7(1): 55-64.
- BADI I, PAMUČAR D, STEVIĆ Z & MUHAMMAD L. 2023. Wind farm site selection using BWM-AHP-MARCOS method: A case study of Libya. Scientific African, 19(e01511).
- BENABDALLAH C, EL-AMRAOUI A, DELMOTTE F & FRIKHA A. 2020. An integrated rough DEMATEL method for sustainability risk assessment in agro-food supply chain. In: 2020 5th International Conference on Logistics Operations Management. p. 1-9.
- BHALAJI R, SANKARANARAYANAN B, ALAM S, IBNE HOSSAIN N, ALI S & KARUPPIAH K. 2022. A decision support model for evaluating risks in a collaborative supply chain of the medical equipment manufacturing industry. Supply Chain Forum: An International Journal, 23(3): 227-251.
- ÇALIK A. 2021. Bulanık çok kriterli karar verme yöntemleri ile yeşil tedarik zincirindeki risklerin karşılaştırılması. Journal of Turkish Operations Management, 5(2): 822-838.
- CHAND M, RAJ T & SHANKAR R. 2015. A comparative study of multi criteria decision making approaches for risks assessment in supply chain. International Journal of Business Information Systems, 18(1): 67-84.
- CHATTERJEE K & KAR S. 2016. Multi-criteria analysis of supply chain risk management using interval valued fuzzy TOPSIS. Opsearch, 53: 474-499.
- CHOPRA S & SODHI M. 2004. Managing risk to avoid supply-chain breakdown. MIT Sloan Management Review, 46(1): 53-61.
- CHOWDHURY N, ALI S, MAHTAB Z, RAHMAN T, KABIR G & PAUL S. 2019. A structural model for investigating the driving and dependence power of supply chain risks in the readymade garment industry. Journal of Retailing and Consumer Services, 51: 102-113.
- CUCCHIELLA F & GASTALDI M. 2006. Risk management in supply chain: a real option approach. Journal of Manufacturing Technology Management, 17(6): 700-720.
- ÇIKMAK S, ÜSTÜNDAĞ A & UNGAN M. 2020. Savunma sanayindeki bir işletmede tedarik zinciri risk azaltma stratejilerinin bulanık DEMATEL yöntemiyle analizi. Düzce Ü niversitesi Bilim ve Teknoloji Dergisi, 8(3): 2005-2028.
- DANIŞMAN E. 2019. Tehlikeli madde lojistiğinde risk faktörlerinin değerlendirilerek depo yerinin seçimi.
- DAS S, MYLA A, BARVE A, KUMAR A, SAHU N, MUDULI K & LUTHRA S. 2023. A systematic assessment of multi-dimensional risk factors for sustainable development in food grain supply chains: A business strategic prospective analysis. Business Strategy and The Environment, 32(8): 5536-5562.
- DEMIR G & BIRCAN H. 2020. Kriter ağırlıklandırma yöntemlerinden BWM ve FUCOM yöntemlerinin karşılaştırılması ve bir uygulama. Cumhuriyet Üniversitesi İktisadi ve İdari Bilimler Dergisi, 21(2): 170-185.
- DEMIRKOL I. 2019. Tedarik zinciri yönetiminde risk. Bursa: Ekin Yayınları.
- EL MOKRINI A, KAFA N, DAFAOUI E, EL MHAMEDI A & BERRADO A. 2016. Evaluating outsourcing risks in the pharmaceutical supply chain: Case of a multi-criteria combined fuzzy AHP-PROMETHEE approach. IFAC-PapersOnLine, 49(28): 114-119.
- FAISAL M. 2009. Prioritization of risks in supply chains. Managing Supply Chain Risk and Vulnerability: Tools and Methods for Supply Chain Decision Makers, p. 41-66.
- GAUDENZI B & BORGHESI A. 2006. Managing risks in the supply chain using the AHP method. The International Journal of Logistics Management, 17(1): 114-136.
- GOVINDAN K & CHAUDHURI A. 2016. Interrelationships of risks faced by third party logistics service providers: A DEMATEL based approach. Transportation Research Part E: Logistics and Transportation Review, 90: 177-195.
- GOVINDAN K & JEPSEN M. 2016. Supplier risk assessment based on trapezoidal intuitionistic fuzzy numbers and ELECTRE TRI-C: a case illustration involving service suppliers. Journal of the Operational Research Society, 67(2): 339-376.
- HO W, ZHENG T, YILDIZ H & TALLURI S. 2015. Supply chain risk management: a literature review. International Journal of Production Research, 53(16): 5031-5069.
- HOSSEINPOUR M, AMIRKHAN M, REZAEIAN J & DOOSTIDEILAMI M. 2024. A risk assessment model for health supply chain based on hybrid fuzzy MCDM method. International Journal of Industrial Engineering: Theory, Applications and Practice, 31(1).
- JOVIC S. 2014. Gıda sektöründe tedarik zinciri risk faktörlerinin belirlenmesi.
- JÜTTNER U, PECK H & CHRISTOPHER M. 2003. Supply chain risk management: outlining an agenda for future research. International Journal of Logistics: Research and Applications, 6(4): 197-210.
- KABA N. 2013. Lojistik işletmesinde risk odaklı bir yönetim.
- KHAN M, ALAM M, TABASSUM N & KHAN N. 2022a. A Systematic review of the Delphi-AHP method in analyzing challenges to public-sector project procurement and the supply chain: A developing country’s perspective. Sustainability, 14(21).
- KHAN M, ALAM M, TABASSUM N, KHAN N & MCKENZIE A. 2023. Supply chain challenges and recommendations for international development agriculture projects: an application of the FGD-fuzzy Delphi approach. Humanities and Social Sciences Communications, 10(1): 1-15.
- KHAN M, TABASSUM N, KHAN N & ALAM M. 2022b. Procurement challenges in publicsector agricultural development projects in Bangladesh. Humanities and Social Sciences Communications , 9(1): 1-13.
- KHANMOHAMMADI E, ZANDIEH M & TAYEBI T. 2019. Drawing a strategy canvas using the fuzzy best-worst method. Global Journal of Flexible Systems Management, 20: 57-75.
- KHEMIRI R, ELBEDOUI-MAKTOUF K, GRABOT B & ZOUARI B. 2017. A fuzzy multi-criteria decision-making approach for managing performance and risk in integrated procurement-production planning. International Journal of Production Research , 55(18): 5305-5329.
- KORUCUK S & ERDAL H. 2018. AHP-VIKOR bütünleşik yaklaşımıyla lojistik risk faktörlerinin ve risk yönetimi araçlarının sıralanması: Samsun ili örneği. İşletme Araştırmaları Dergisi, 10(3): 282-305.
- KORUCUK S, TIRKOLAEE E, AYTEKIN A, KARABASEVIC D & KARAMAŞA Ç . 2023. Agile supply chain management based on critical success factors and most ideal risk reduction strategy in the era of industry 4.0: application to plastic industry. Operations Management Research, 16(4): 1698-1719.
- KRSTIĆ M, AGNUSDEI L, PALMI P & BALEŽENTIS T. 2024a. Enabling organizations to strategically manage risks in circular supply chains. Business Strategy and The Environment , 33(6): 5996-6009.
- KRSTIĆ M, ELIA V, AGNUSDEI G, LEO F, TADIĆ S & MIGLIETTA P. 2024b. Evaluation of the agri-food supply chain risks: the circular economy context. British Food Journal, 126(1): 113-133.
- KULL T & TALLURI S. 2008. A supply risk reduction model using integrated multicriteria decision making. IEEE Transactions on Engineering Management, 55(3): 409-419.
- KIRILMAZ O & EROL S. 2017. A proactive approach to supply chain risk management: Shifting orders among suppliers to mitigate the supply side risks. Journal of Purchasing and Supply Management, 23(1): 54-65.
- MALEK J & DESAI T. 2019. Prioritization of sustainable manufacturing barriers using Best Worst Method. Journal of Cleaner Production , 226: 589-600.
- MANGLA S, KUMAR P & BARUA M. 2015. Flexible decision modeling for evaluating the risks in green supply chain using fuzzy AHP and IRP methodologies. Global Journal of Flexible Systems Management , 16: 19-35.
- MANGLA S, KUMAR P & BARUA M. 2016. An integrated methodology of FTA and fuzzy AHP for risk assessment in green supply chain. International Journal of Operational Research, 25(1): 77-99.
- MITAL M, DEL GIUDICE M & PAPA A. 2018. Comparing supply chain risks for multiple product categories with cognitive mapping and Analytic Hierarchy Process. Technological Forecasting and Social Change, 131: 159-170.
- MOEINZADEH P & HAJFATHALIHA A. 2009. A combined fuzzy decision-making approach to supply chain risk assessment. International Journal of Industrial and Manufacturing Engineering, 3(12): 1631-1647.
- MOKTADIR M, DWIVEDI A, KHAN N, PAUL S, KHAN S, AHMED S & SULTANA R. 2021. Analysis of risk factors in sustainable supply chain management in an emerging economy of leather industry. Journal of Cleaner Production , 283(124641).
- MOKTADIR M, PAUL S, BAI C & SANTIBANEZ GONZALEZ E. 2024. The current and future states of MCDM methods in sustainable supply chain risk assessment. Environment, Development and Sustainability, pp. 1-46.
- MZOUGUI I, CARPITELLA S, CERTA A, EL FELSOUFI Z & IZQUIERDO J. 2020. Assessing supply chain risks in the automotive industry through a modified MCDM-based FMECA. Processes, 8(5).
- NOROUZI A & NAMIN H. 2019. A hybrid fuzzy TOPSIS-best worst method for risk prioritization in megaprojects. Civil Engineering Journal, 5(6): 1257-1272.
- PANJEHFOULADGARAN H & LIM S. 2020. Reverse logistics risk management: identification, clustering and risk mitigation strategies. Management Decision, 58(7): 1449-1474.
- POYRAZ P & ŞIMŞIR F. 2022. Tedarik zinciri risk yönetiminde bulanık çok kriterli karar verme yöntemleri ile süreç bazlı hata türleri analizi. Journal of Advanced Research in Natural and Applied Sciences, 8(1): 86-104.
- RAIAN S, ALI S, SARKER M, SANKARANARAYANAN B, KABIR G, PAUL S & CHAKRABORTTY R. 2022. Assessing sustainability risks in the supply chain of the textile industry under uncertainty. Resources, Conservation and Recycling, 177(105975).
- RAIHAN A, ALI S, ROY S, DAS M, KABIR G & PAUL S. 2022. Integrated model for soft drink industry supply chain risk assessment: implications for sustainability in emerging economies. International journal of fuzzy systems, p. 1-22.
- RAJESH R & RAVI V. 2015. Modeling enablers of supply chain risk mitigation in electronic supply chains: A Grey-DEMATEL approach. Computers & Industrial Engineering, 87: 126-139.
- REZAEI J. 2015. Best-worst multi-criteria decision-making method. Omega, 53: 49-57.
- REZAEI J. 2016. Best-worst multi-criteria decision-making method: Some properties and a linear model. Omega, 64: 126-130.
- REZAEI J, ROEKEL W & TAVASSZY L. 2018. Measuring the relative importance of the logistics performance index indicators using Best Worst Method. Transport policy, 68: 158-169.
- ROSTAMZADEH R, GHORABAEE M, GOVINDAN K, ESMAEILI A & NOBAR H. 2018. Evaluation of sustainable supply chain risk management using an integrated fuzzy TOPSIS-CRITIC approach. Journal of Cleaner Production , 175: 651-669.
- SALIMI N & REZAEI J. 2018. Evaluating firms’ R&D performance using best worst method. Evaluation and program planning, 66: 147-155.
- SAMVEDI A, JAIN V & CHAN F. 2013. Quantifying risks in a supply chain through integration of fuzzy AHP and fuzzy TOPSIS. International Journal of Production Research , 51(8): 2433-2442.
- SCHOENHERR T, TUMMALA V & HARRISON T. 2008. Assessing supply chain risks with the analytic hierarchy process: Providing decision support for the offshoring decision by a US manufacturing company. Journal of Purchasing and Supply Management , 14(2): 100-111.
- SHAHED K, AZEEM A, ALI S & MOKTADIR M. 2021. A supply chain disruption risk mitigation model to manage COVID-19 pandemic risk. Environmental Science and Pollution Research, p. 1-16.
- SILVA U, PAUL A, HASAN K, PAUL S, ALI S & CHAKRABORTTY R. 2023. Examining risks and strategies for the spice processing supply chain in the context of an emerging economy. International Journal of Emerging Markets, 18(5): 1124-1146.
- SODHI M, SON B & TANG C. 2012. Researchers’ perspectives on supply chain risk management. Production and operations management, 21(1): 1-13.
- SONG W, MING X & LIU H. 2017. Identifying critical risk factors of sustainable supply chain management: A rough strength-relation analysis method. Journal of Cleaner Production , 143: 100-115.
- SUN C, XIANG Y, JIANG S & CHE Q. 2015. A supply chain risk evaluation method based on fuzzy TOPSIS. International Journal of Safety and Security Engineering, 5(2): 150-161.
- SUTRISNO A & KUMAR V. 2023. Supply chain sustainability risk assessment model using integration of the preference selection index (PSI) and the Shannon entropy. International Journal of Quality & Reliability Management, 40(3): 674-708.
- TANG C. 2006. Perspectives in supply chain risk management. International Journal of Production Economics, 103(2): 451-488.
- THAKKAR J & THAKKAR J. 2021. An integrated DEMATEL-ANP (DANP) MCDM approach for quantifying the supply chain risk: A case of Indian petroleum supply chain. Multi-Criteria Decision Making, p. 349-365.
- TOPAL A, YÜRÜYEN A, ULUTAŞ A, KARABASEVIC D & KARAKÖY Ç. 2021. Criteria for selection of transportation vehicles according to cargo companies using fuzzy methods. In: Handbook of Research on Decision Sciences and Applications in the Transportation Sector. p. 214-231.
- TUNCEL G & ALPAN G. 2010. Risk assessment and management for supply chain networks: A case study. Computers in industry, 61(3): 250-259.
- ULUTAŞ A. 2020. The analysis of the importance of the criteria used in the selection of transport vehicle according to cargo companies by BWM. Equinox Journal of Economics Business and Political Studies, 7(2): 127-140.
- ULUTAŞ A. 2021. Supplier evaluation with BWM and fuzzy CODAS methods. In: Handbook of Research on Recent Perspectives on Management, International Trade, and Logistics. p. 335-351.
- VENKATESH V, RATHI S & PATWA S. 2015. Analysis on supply chain risks in Indian apparel retail chains and proposal of risk prioritization model using Interpretive structural modeling. Journal of Retailing and Consumer Services , 26: 153-167.
- WU T, BLACKHURST J & CHIDAMBARAM V. 2006. A model for inbound supply risk analysis. Computers in industry, 57(4): 350-365.
- YALÇINKAYA I & CEBI S. 2022. Using fuzzy set-based model for pharmaceutical supply chain risks assessment. In: International Conference on Intelligent and Fuzzy Systems. p. 252-260.
- YOLAÇ G, TUZCUOĞLU A & ŞAHIN M. 2019. Tedarik zincirinde risk yönetimi ve performans ilişkisi: Istanbul ilinde bir araştırma. EKOIST Journal of Econometrics and Statistics, 31: 95-106.
- YILDIRIM B. 2020. Güçlü zayıf yöntemi ile proje değerlendirme için alternatif bir ölçek önerisi: KOSGEB örneği. Yönetim Bilimleri Dergisi, 18(38): 747-765.
- YILMAZ E, USLU Y & GEDIKLI E. 2022. Hastanelerde lojistik yönetimi risk faktörlerinin dematel yöntemi ile değerlendirilmesi. Lojistik Dergisi, 56: 109-126.
- ZSIDISIN G & ELLRAM L. 2003. An agency theory investigation of supply risk management. Journal of Supply Chain Management, 39(2): 15-27.
- ZUBAYER M, MITHUN ALI S & KABIR G. 2019. Analysis of supply chain risk in the ceramic industry using the TOPSIS method under a fuzzy environment. Journal of Modelling in Management, 14(3): 792-815.