 Evaluation of Facial Soft Tissue Thickness in Different Orthodontic Malocclusions: An in Vitro Study
ABSTRACT
Objective: To evaluate facial soft tissue thickness in different orthodontic malocclusions.
Material and Methods: This was an observational study utilizing pre-existing cephalometric images of 540 subjects (270 females and 270 males). Cephalometric images were then classified sagittally based on the Wits appraisal analysis into skeletal Classes. One-way ANOVA was used to compare the means of facial soft tissue thickness between the skeletal groups, followed by Tukey's post hoc test for individual comparison. The significance level was set at p≤0.05.
Results: A statistically significant difference in both sagittal and vertical groups was observed (p≤0.05). Tukey's post hoc analysis showed that the skeletal Class III group has increased soft tissue thickness in the subnasal and upper lip compared to Class I and Class II subjects. Moreover, the hypodivergent group showed greater soft-tissue thickness at the pogonion landmarks compared with the other groups.
Conclusion: Vertical skeletal pattern exerts a more consistent and significant influence on facial soft tissue thickness (FSTT) than sagittal skeletal classification across different malocclusion classes. Specifically, hyperdivergent individuals consistently exhibited thinner soft-tissue measurements, particularly in the chin and perioral regions, whereas hypodivergent subjects showed thicker soft tissue. These findings highlight the importance of considering vertical skeletal patterns when evaluating facial soft tissue thickness, which may improve orthodontic diagnosis and treatment planning.
Keywords:
Malocclusion; Angle Class I; Cephalometry; Orthodontics; Facial Bones.
Introduction
The human face is the most characteristic and recognizable part of the human body. It is with the face that a range of human emotions is expressed. Humans judge attractiveness by facial appearance, and social acceptance depends to a great extent on it. An attractive face is associated with perceptions of beauty and health, as well as feelings of social accomplishment, intelligence, and happiness [1]. The face is of essential significance for interpersonal communication and social contact, and our first memory of a person is related to the image of their face [2].
A proportionate relationship among the different structures of a face is the key to its esthetic and pleasing appearance [3]. The facial profile is determined by facial soft-tissue thickness (FSTT) and dental and skeletal characteristics [4]. Face contours are traditionally considered to be a result of the position of basic hard (dental and skeletal) tissue, followed by the soft tissue. However, current trends indicate a shift in the paradigm from the conventional analysis of hard tissues to the inclusion of soft tissues [5]. Muscles, subcutaneous fat, soft tissue, and skin can develop proportionately and disproportionately in relation to corresponding skeletal structures [6]. There can be variations in the thickness, length, and tone of soft tissue, which all affect the facial esthetic [7].
Improvement in facial appearance has long been recognized as the most important motive for patients to accept orthodontic treatment. The essential determinant of facial esthetics is an understanding of the relationship between the facial bones and the soft tissues. It was previously thought that the configuration of the soft tissue profile was primarily related to the basic skeletal configuration. However, there have been reports to indicate that soft tissue acts independently of the basic dentoskeletal base, since soft tissue is very variable in thickness, and is the main factor in determining a patient’s final facial profile [8].
To plan successful orthodontic or orthognathic surgical treatment for patients, a cephalometric analysis of hard and soft tissues should be performed [9,10]. This analysis is used to a large degree for determining the diagnosis and planning of orthodontic or orthognathic surgical treatment. However, with advances in cephalometry, it has been established that FSTT differs across ethnic groups, suggesting that a single standard of facial esthetics may not apply to all ethnic groups. Therefore, researchers have compared the cephalometric characteristics of different races with the established standard of Caucasian Americans to establish specific cephalometric FSTT values for different ethnic groups [8,10,11]. Furthermore, age [3,12,13], sex, ethnicity [3,14], climate [15], activity, obesity, and body mass index (BMI) [16,17] of individuals significantly influence this relationship, along with other factors. Aside from jaw orthopedics, knowledge of the values of FSTT can help anthropologists determine the facial appearance of ancient civilizations and forensic anthropologists identify a victim through facial reconstruction when other methods of identification are not possible [4,18,19].
Standard values of FSTT and other rules based on anatomy are used for facial reconstruction, but FSTT values are usually used for determining the thickness of tissue that lies on predetermined landmarks of the skull [5]. Knowing the quantitative distribution of FSTT in different areas is a necessary factor for creating recognizable facial contours on an unknown skull [5,16,20,21].
Recent research has shown that soft tissue thickness closely corresponds to sagittal malocclusions [9,13,22,23]. There is still controversy over the influence of sex on FSTT, and most authors believe that there are significant differences between men and women in FSTT [24-27]. However, other authors refute these differences [15,18,28,29]. Recent studies have further emphasized the complex interaction between skeletal morphology and facial soft tissue characteristics, particularly highlighting the influence of vertical divergence patterns on facial soft tissue thickness and profile morphology [30].
While previous studies have highlighted the influence of vertical facial patterns on soft tissue morphology, the present study further examines the combined effects of sagittal skeletal classification and vertical skeletal pattern on facial soft tissue thickness at multiple cephalometric landmarks. This approach enables a more comprehensive evaluation of soft-tissue variations across different malocclusion classes and between sexes. Therefore, this study aimed to compare male and female characteristics of FSTT across different orthodontic malocclusions using cephalometric radiography, according to the presence of different sagittal and vertical dentoskeletal patterns in both sexes, and to compare these values within the same malocclusion classes.
Material and Methods
Study Design and Ethical Clearance
A retrospective cross-sectional study was conducted using archived lateral cephalometric radiographs obtained from the Department of Orthodontics, Faculty of Dentistry, Mansoura University, code number A01003024OR.
Sample
The sample size calculation was based on the mean facial soft-tissue thickness measured linearly across different orthodontic malocclusion groups in males and females, as reported in previous research [31]. Using the G*Power program, version 3.1.9.7, to calculate sample size based on effect size of 0.74, using a 2-tailed test, α error =0.05 and power = 80.0%, the sample size will be 30 in each group, then the total calculated sample size was 540 (270 males and 270 females), aged between 16 and 22 years.
Participants, Eligibility Criteria, and Settings
Lateral cephalometric radiographs obtained from patient archives of the Department of Orthodontics, Faculty of Dentistry, Mansoura University. Lateral cephalometric radiographs were used because they are routinely obtained diagnostic records in orthodontic practice and allow standardized evaluation of craniofacial skeletal relationships and the facial soft-tissue profile. Lateral cephalometric radiographs were obtained during routine diagnostic procedures for patients examined in the department. Subjects’ ages ranged between 16- and 22 years. Patients were excluded from the study if they had a history of trauma, craniofacial anomalies, cleft lip and palate, previous orthodontic, prosthetic and/or orthognathic surgical treatment.
All patients underwent cephalometric analysis based on lateral head radiographs taken before orthodontic treatment. All radiographs were taken with the Vatech PaX-i X-ray machine (Vatech Co., Ltd., Hwaseong-si, Republic of Korea). Each radiograph had been calibrated with a millimeter scale before the cephalometric analysis. The cephalometric analysis was performed using AudaxCeph software (Audax d.o.o., Ljubljana, Slovenia) (Figure.1). The cephalometric analysis was performed by the researcher, who was blinded to the patient’s clinical records and treatment.

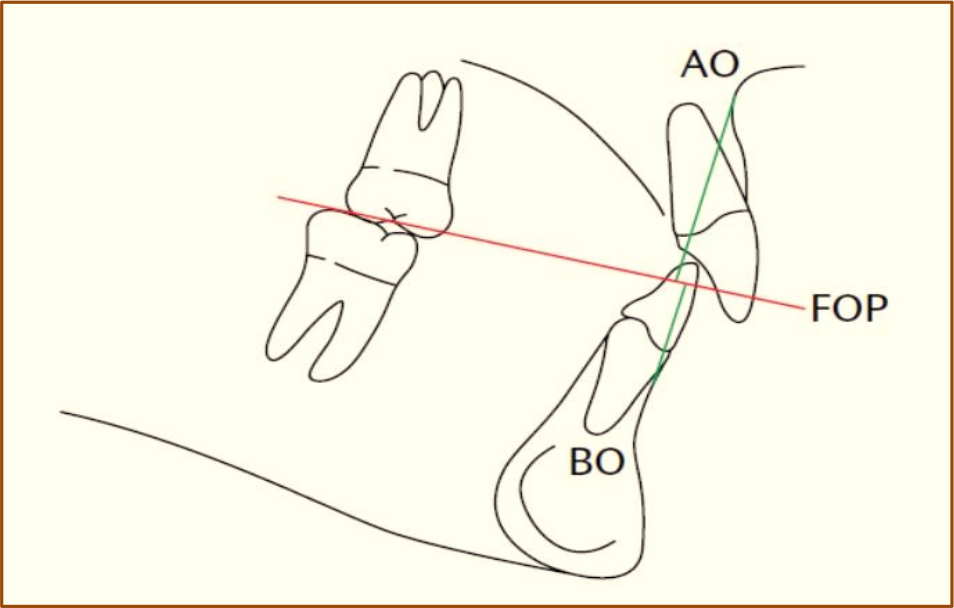
Eligible cephalometric images were then grouped by one examiner and divided into sagittal groups based on Wit's analysis: Group 1 was the skeletal Class I pattern; Group 2 was the skeletal Class II pattern, and Group 3 was the skeletal Class III pattern as described in Table 1 and Figure 2. Vertical skeletal pattern classification was based on the Frankfort-mandibular plane angle (FMA), a widely used cephalometric indicator of vertical facial growth pattern. Although slight overlap between categories may occur around threshold values, these criteria remain commonly applied in orthodontic research and clinical assessment for distinguishing hypodivergent, normodivergent, and hyperdivergent facial patterns (Figure 3): Group 1 was a hyperdivergent skeletal pattern (FMA>30); Group 2 was a hypodivergent skeletal pattern (FMA< 30); and Group 3 was a normodivergent skeletal pattern (20< FMA<30).

Therefore, the examiner was blinded to the groups by creating a new Excel spreadsheet (Microsoft Corp., Redmond, WA, USA) by another examiner, with subjects coded and lacking the skeletal groups. Then, the facial soft tissue thickness was assessed at seven landmarks, as described in Table 2 and Figure 4. To minimize measurement bias, the examiner performing the cephalometric tracing and landmark identification was blinded to the subjects’ demographic information and skeletal classification during the measurement process. All soft tissue thickness measurements were recorded in millimeters (mm).

Soft tissue cephalometric landmarks. Seven linear measurements (Burston) from top to bottom: G-G1; A-SN; PR-SLS; J-LS; I-LI; B-SLI; PGPG1.
Statistical Analysis
Data were analyzed using SPSS software, version 26 (SPSS Inc., Chicago, IL, USA). The normality of quantitative variables was assessed using the Kolmogorov-Smirnov test. Normally distributed data were presented as mean ± standard deviation, whereas non-normally distributed data were expressed as median with minimum and maximum values. For normally distributed variables, one-way analysis of variance (ANOVA) was used to compare differences among more than two independent groups, followed by Tukey’s post-hoc test for pairwise comparisons. For variables that did not meet the normality assumption, the Kruskal-Wallis test was applied for comparisons among multiple groups, followed by Mann-Whitney U tests for pairwise comparisons when appropriate. A p-value ≤ 0.05 was considered statistically significant.
Results
In Class I males, SNMP values differed significantly among the vertical skeletal patterns (p = 0.001). Hyperdivergent individuals demonstrated the highest SNMP values (40.01 ± 3.29), followed by normodivergent (32.14 ± 2.25) and hypodivergent (24.79 ± 2.76) subjects. Soft tissue thickness at the G-G1 landmark also showed significant variation (p = 0.016), with hypodivergent individuals presenting slightly greater thickness (6.41 ± 0.96) compared with normodivergent (5.87 ± 1.04) and hyperdivergent groups (5.64 ± 1.12). Witts’s appraisal also varied significantly between groups (p = 0.014) (Table 3). Among Class II, significant differences were observed in SNMP values across vertical skeletal patterns (p = 0.001), with hyperdivergent individuals showing the highest values (40.70 ± 3.78) and hypodivergent subjects the lowest (24.33 ± 3.19). Significant differences were also found for A-Sn (p = 0.04) and J-Ls (p = 0.001). Hypodivergent individuals demonstrated greater J-Ls thickness (12.85 ± 2.74) compared with normodivergent (10.68 ± 2.24) and hyperdivergent subjects (10.31 ± 2.35). For Class III, SNMP differed significantly between the vertical groups (p = 0.001), with hyperdivergent individuals showing the highest values (38.81 ± 2.09) and hypodivergent individuals the lowest (23.25 ± 4.09). Significant differences were also observed in J-Ls (p = 0.008) and Pg-Pg1 (p = 0.027), where hypodivergent subjects demonstrated greater soft tissue thickness compared with the other groups (Table 3).
In Class I females, SNMP values showed significant variation across vertical skeletal patterns (p = 0.001). Hyperdivergent individuals demonstrated the highest SNMP values (39.49 ± 2.58), followed by normodivergent (33.23 ± 2.32) and hypodivergent individuals (25.06 ± 2.53). No other soft tissue measurements showed statistically significant differences. Among Class II, SNMP values differed significantly between vertical groups (p = 0.001). In addition, J-Ls measurements showed significant variation (p = 0.03), with hypodivergent subjects presenting greater values (10.80 ± 3.0) compared with normodivergent (9.54 ± 1.75) and hyperdivergent individuals (9.14 ± 2.62). In Class III females, SNMP differed significantly across vertical skeletal patterns (p = 0.001). Significant differences were also observed in Pr-SLs (p = 0.001), J-Ls (p = 0.001), and B-Sli (p = 0.04). Hypodivergent subjects demonstrated the greatest soft tissue thickness at Pr-SLs (15.70 ± 2.97) and J-Ls (13.96 ± 2.87). Witt's appraisal also differed significantly between groups (p = 0.005) (Table 4).
When both sexes were analyzed together in Class I subjects, significant differences were observed in SNMP (p = 0.001), Witt's appraisal (p = 0.02), and G-G1 measurements (p = 0.007). Hyperdivergent individuals demonstrated the highest SNMP values (39.75 ± 2.95), while hypodivergent subjects showed greater G-G1 thickness (6.32 ± 1.03) (Table 5). Among Class II subjects, SNMP differed significantly between vertical skeletal patterns (p = 0.001). Significant variation was also observed in Pr-SLs (p = 0.035) and J-Ls (p = 0.001), with hypodivergent individuals demonstrating greater soft tissue thickness compared with the other groups. In Class III subjects, SNMP showed significant variation across vertical skeletal patterns (p = 0.001). Significant differences were also observed in Pr-SLs (p = 0.001), J-Ls (p = 0.001), B-Sli (p = 0.023), and Pg-Pg1 (p = 0.025), with hypodivergent individuals generally presenting greater soft tissue thickness.
When analyzed according to vertical skeletal pattern across the entire sample, hyperdivergent individuals showed the highest SN/MP values (40.07 ± 3.08), whereas hypodivergent individuals demonstrated lower values (24.59 ± 2.71). Hypodivergent subjects also tended to show greater soft tissue thickness at several landmarks, including G-G1 (6.12 ± 0.98), Pr-SLs (13.82 ± 2.81), and J-Ls (11.79 ± 3.14) (Table 6).
Comparison between sexes revealed no significant differences in SN/MP (p = 0.598), Witts (p = 0.067), G-G1 (p = 0.905), or Pg-Pg1 (p = 0.434). However, males demonstrated significantly greater soft tissue thickness than females at A-Sn (17.06 ± 3.24 vs. 15.42 ± 2.80), Pr-SLs (14.90 ± 2.72 vs. 13.18 ± 2.39), J-Ls (12.38 ± 3.21 vs. 10.81 ± 2.75), I-Li (13.75 ± 2.64 vs. 13.07 ± 2.05), and B-Sli (12.58 ± 2.00 vs. 12.02 ± 1.70), all with p < 0.001 (Table 7).
Significant differences were also observed across sagittal skeletal classes. Class III subjects demonstrated greater soft tissue thickness at several landmarks, including A-Sn (17.09 ± 3.23), Pr-SLs (15.21 ± 2.99), and J-Ls (13.10 ± 3.13), compared with Class I and Class II subjects (Table 8).
Discussion
Facial esthetics is the principal goal in orthodontic practice and the main motivation for patients seeking orthodontic treatment. Orthodontists can identify skeletal patterns associated with unpleasant soft tissue thickness and transform it into attractive facial thickness by means of orthodontic treatment, orthognathic surgery, or plastic surgery.
This study used cephalometric images to assess the facial soft tissue thickness in different sagittal and vertical skeletal patterns. A combined assessment of both vertical and sagittal skeletal patterns has not previously been undertaken in the Egyptian population. Recent investigations have also emphasized the complex interaction between skeletal morphology and facial soft tissue characteristics, particularly highlighting the significant role of vertical divergence in shaping facial soft tissue thickness and profile morphology [30]. Another previous study conducted on the population assessed facial soft tissue differences arising from different dental malocclusions instead of skeletal discrepancies [32].
The findings of the present study have important clinical implications for orthodontic diagnosis and treatment planning. Since facial soft tissue thickness plays a critical role in determining the final facial profile, understanding its relationship with vertical skeletal patterns may help clinicians better predict soft tissue response during orthodontic treatment. The greater influence of vertical skeletal pattern observed in this study may be explained by the effect of vertical facial growth on muscular tension and soft tissue adaptation around the chin and perioral regions, which may result in noticeable variations in soft tissue thickness.
Earlier studies have shown that changes in the skeletal structures are reflected in the overlying soft tissue. For example, maxillary and dental protrusion affects the soft tissue protrusion and upper lip position [33,34]. Moreover, alterations in facial soft tissue have been reported after orthognathic [35]. Hence, the present study excluded subjects with previous orthodontic treatment and orthognathic surgeries. In addition, subjects with previous plastic surgeries were excluded.
The findings of this study suggest that vertical skeletal pattern may exert a more consistent influence on facial soft tissue thickness (FSTT) than sagittal skeletal classification across different malocclusion classes and both genders. Specifically, hyperdivergent individuals consistently exhibited thinner, soft tissue measurements, particularly in the chin and perioral regions, while hypodivergent subjects showed thicker, soft tissue, likely contributing to a more convex facial profile.
Although certain soft tissue parameters, such as Pr-SLs, J-Ls, and Pg-Pg1, were also affected by sagittal skeletal class, the variation within each class was largely shaped by vertical divergence. These findings highlight the importance of considering vertical facial dimensions when assessing facial soft tissue thickness.
Recent studies have shown that not all areas of the soft tissue profile directly follow skeletal structures, and, in some areas, the contours of the facial tissue deviate from basic skeletal structures [7,20]. In everyday orthodontic practice, there are standard cephalometric measurements and analysis done on the basis of cephalometric radiography of facial profiles to determine relationships between contours of a facial skeleton, as well as FSTT measurements [4].
Lateral cephalometric radiography shows dental, skeletal, and soft tissue structures, and is used to determine dental and skeletal relationships, with the aim of planning orthodontic treatment [29]. More contemporary methods for determining FSTT have recently been developed 5, including computed tomography (CT) scanning [36], cone beam CT (CBCT) [16,17], ultrasonography [4], and magnetic resonance imaging (MRI) 20. In the present study, standard profile lateral cephalometric radiography was chosen as the method of measurement of FSTT, for several reasons, but mainly because it provides the opportunity to objectively measure important structures and relationships, and most previously published studies have used this method [37]. Also, lateral cephalometric radiography is used in routine clinical practice and is a standard diagnostic procedure in orthodontic therapy and is associated with minimal exposure to X radiation.
Significant differences in soft tissue thickness were noted among hypodivergent, normodivergent, and hyperdivergent individuals, particularly at the glabella (G-G1) regions. In Class I, hypodivergent patients exhibited significantly greater soft tissue thickness at G-G1 compared to hyperdivergent and normodivergent individuals. This is consistent with findings of Perović et al. [38], who reported thicker facial soft tissues in individuals with low-angle (hypodivergent) growth patterns, likely due to greater muscular strength and skeletal compactness.
The influence of the vertical skeletal pattern on facial soft tissue thickness has been reported previously in other populations [39,40]. In agreement with our results, Patil et al. [41] showed that the hypodivergent group had thicker soft tissue in PG-PG1. Previous studies found that hyperdivergent subjects had reduced soft tissue thickness in A-SN and J-LS, compared to hypodivergent subjects [23,40]. In concordance with previous literature, our findings highlight that the hyperdivergent group had reduced soft tissue thickness in G-G1, J-LS, and PG-PG1compared to the hypodivergent group. This finding may be explained by soft tissue compensation for skeletal vertical disharmony [32]. Another reason could be due to the increased stretching of the soft tissue in the hyperdivergent group, resulting in reduced thickness. On the other hand, the hypodivergent group had increased soft tissue thickness, probably due to the presence of hypertrophy of perioral musculature, which tends to occur as a way of compensating for vertical deficiency and maintaining lip competence [38].
The SN/MP showed statistically significant differences across all groups, confirming the validity of vertical skeletal classification and supporting the concept that vertical divergence affects soft tissue morphology. This finding aligns with previous studies, such as Abdulal et al. [42], who demonstrated that hyperdivergent individuals tend to have thinner, softer tissues over the chin and lips compared to normodivergent and hypodivergent subjects. These findings are consistent with previous research, including the studies by Macari et al. [30] and Macari and Hanna [43], which also reported a stronger influence of vertical facial pattern on soft tissue morphology.
Across the studied groups, hypodivergent individuals generally showed increased soft tissue thickness at several facial regions, particularly at the glabella (G-G1), upper lip (Pr-SLs, J-Ls), and chin (Pg-Pg1), compared to hyperdivergent counterparts.
In our study, GG1 and J-Ls measurements were lower in hyperdivergent individuals, especially in Class I and III groups, indicating reduced soft tissue prominence in the chin and midface regions. This finding supports Perović et al. [38], who suggested that vertical growers often have thinner, soft tissue profiles, potentially exaggerating skeletal discrepancies and negatively impacting facial esthetics.
Conversely, hypodivergent individuals showed significantly thicker tissues in the same regions, which may serve as a compensatory mechanism to camouflage mild skeletal imbalances. This agrees with research by Celebi et al. [44], who reported increased soft tissue thickness over the pogonion and B-point in hypodivergent subjects and Alhazmi et al. [36], who found significant differences in soft tissue thickness across vertical skeletal patterns, with hypodivergent individuals showing increased thickness at G-G1.
Yousefi et al. [45] study found no significant differences in subnasal profiles for sagittal groups, aligning with the current study. However, it highlighted that hyperdivergent patterns significantly impacted both general and subnasal profiles, indicating the vertical dimension's greater influence on facial aesthetics.
Farha et al. [46] found that while soft tissue thickness of the nose increased with age, it did not report significant differences in A-Sn values across subgroups, suggesting that gender-related variability may influence the assessment of soft tissue thickness. This partially aligns with our results, where A-Sn values showed no significant differences in many subgroups.
While the vertical growth pattern demonstrated stronger associations, certain sagittal changes were also linked to soft tissue variations. For instance, Class II individuals, typically characterized by maxillary protrusion or mandibular retrusion, displayed increased A-Sn and Pr-SLs values, particularly in hypodivergent types. This reflects the soft tissue compensation to maintain lip competence and facial balance. These observations are in line with Eröz Dilaver et al. [47], who noted that the soft tissue compensates for malrelation of the jaw, especially in Class II subjects, who had significantly thicker upper lip soft tissues.
In contrast, Class III individuals exhibited increased lower lip and chin soft tissue thickness, especially in normodivergent and hypodivergent patterns. These changes are thought to balance the skeletal mandibular protrusion typical in Class III, as described in Hashim et al. [48] study. However, some Class III hyperdivergent subjects showed thinner chin soft tissue (e.g., PgPg1 and B-Sli), supporting the view that vertical growth may exacerbate skeletal Class III appearance due to lack of soft tissue masking.
Interestingly, our data suggest that Witts’s appraisal was not significantly associated with soft tissue variation in most comparisons, despite being a key sagittal skeletal measurement. Bhullar et al. [49] suggest that Wit’s appraisal may not effectively account for soft tissue variations in these comparisons, despite its importance in skeletal measurements.
In Class III cases, significant thickening at Pr-SLs, J-Ls, and Pg-Pg1, especially in hypodivergent individuals. This could reflect compensatory soft tissue adaptation over a protruded skeletal basis. Previous studies reported thicker soft tissue in the maxilla in class III subjects [50-52]. The thicker, soft tissue in skeletal class III in our studied population can be explained by soft tissue compensation in skeletal regions with deficient skeletal development or positioned posteriorly. In addition, the upper incisors were proclined, and the lower incisors were retroclined in most class III individuals, and this could push the upper lip forward, leading to greater soft tissue thickness. Findings agreed with Aboobacker et al. [52], who reported thicker lower facial soft tissue structures in Class III patients, especially in males, likely due to the forward positioning of skeletal bases and stronger musculature in this group.
Although both genders were assessed, significant differences in soft tissue thickness between skeletal patterns were more prominent in male subjects. For instance, in Class III males, Pg-Pg1 and J-Ls thickness varied significantly across vertical patterns, with hypodivergent males consistently showing the greatest values.
This supports prior findings of Adnan et al. [53], who reported that males tend to have thicker soft tissues across nearly all cephalometric landmarks due to greater muscular development and skeletal mass. The pronounced variation in males emphasizes the need for sex-specific soft tissue norms in orthodontic diagnosis and facial esthetic analysis.
In agreement with Alhazmi et al. [36], the current study’s values for Pr-SLs and Pg-Pg1 were generally higher in Class III hypodivergent subjects, indicating a forward-projecting soft tissue profile. In contrast, values for A-Sn and J-Ls in Class II hyperdivergent patients were lower than the norms, suggesting a more retrusive soft tissue pattern. These findings have aesthetic implications, particularly in lip posture, smile design, and profile harmony.
Gender-related trends were noted. The results of this study demonstrate that while certain craniofacial soft tissue thickness measurements, such as SN/MP, Witts, G-G1, and Pg-Pg1, do not differ significantly between males and females, several key variables show marked sex-related differences. Specifically, A-Sn, Pr-SLs, J-Ls, I-Li, and B-Sli exhibit significantly greater soft tissue thickness in males compared to females (p < 0.05). This trend suggests that males may present relatively thicker soft tissue. Such differences are consistent with known biological dimorphism. Males had greater overall soft tissue thickness compared to females, consistent with previous findings by Adnan et al. [53] and Stephan et al. [54], which attributed such differences to hormonal and muscular development. Nonetheless, vertical skeletal remained a stronger predictor of FSTT than gender in most regions.
Because it may never be possible to describe and predict all the variations of the male and female human face and the relationship between the bone and soft tissue, the measurement of FSTT has multiple diagnostic, clinical, anthropological, and forensic applications, including craniofacial reconstruction, facial plastic surgery, reconstructive and orthognathic maxillofacial surgery, and evaluation of benign and malignant facial tumors [55]. Because soft tissues do not form a layer of equal thickness, which simply shapes the configuration of basic dental and skeletal structures, the variability of FSTT can reflect the facial profile and should be a factor in diagnosis and the planning of orthodontic treatment [10].
The findings of the present study may contribute to improving the diagnostic assessment of facial soft tissue characteristics in different skeletal patterns. Orthodontists and surgeons should be familiar with sex-specific variations in certain populations during therapeutic interventions. Recognizing the combined impact of vertical and sagittal patterns on soft tissue thickness can improve the accuracy of facial esthetic predictions, especially when planning orthodontic camouflage or orthognathic surgical treatments. Considering the studied population, the presence of facial soft tissue sexual dimorphism in adults has important implications in orthodontic treatment planning and outcome assessment.
These findings may have implications for orthodontic treatment planning, particularly when considering potential facial profile changes in male and female patients. Moreover, the present study indicates different clinical considerations for different skeletal patterns. Patients with skeletal class III and hypodivergent patterns might be less affected by orthodontic extraction treatment and incisor retraction compared to other skeletal patterns. Moreover, thinner, soft tissues in hyperdivergent Class II patients may necessitate more careful esthetic planning compared to thicker tissue hypodivergent Class III cases. To our knowledge, few studies have evaluated facial soft tissue thickness across both sagittal and vertical skeletal patterns within the same population.
The present study has several limitations that should be considered when interpreting the findings. First, the analysis was based on two-dimensional lateral cephalometric radiographs, which may not fully capture the three-dimensional characteristics of craniofacial structures compared with CBCT imaging. Second, cephalometric measurements are subject to potential measurement errors related to landmark identification and tracking. In addition, the study population was restricted to a specific age range and represented a single ethnic group, which may limit the generalizability of the findings. Finally, the retrospective study design using archived records may introduce inherent limitations related to data availability and control over confounding variables. Although CBCT provides a three-dimensional assessment of craniofacial structures, lateral cephalometric radiography remains widely used in orthodontic research and clinical practice due to its accessibility, standardized methodology, and lower radiation exposure.
Conclusion
Facial soft tissue thickness was found to vary across different skeletal malocclusion classes and vertical skeletal patterns. Vertical skeletal pattern demonstrated a more consistent influence on soft tissue thickness compared with sagittal skeletal classification, with hypodivergent individuals generally presenting greater soft tissue thickness than hyperdivergent subjects. These findings highlight the importance of considering vertical facial patterns and soft tissue characteristics during orthodontic diagnosis and treatment planning to improve the prediction of treatment outcomes and facial esthetic results.
-
Financial SupportNone.
Data Availability
The data used to support the findings of this study can be made available upon request to the corresponding author.
References
- [1] Sforza C, de Menezes M, Ferrario VF. Softand hard-tissue facial anthropometry in three dimensions: what's new. J Anthropol Sci 2013; 91:159-184.
- [2] Panenková P. Face approximation and information about facial soft tissue thickness. EAA Summer School eBook 2007; 1:233-239.
- [3] Jeelani W, Fida M, Shaikh A. Facial soft tissue analysis among various vertical facial patterns. J Ayub Med Coll Abbottabad 2016; 28(1):29-34.
-
[4] Hamid S, Abuaffan AH. Facial soft tissue thickness in a sample of Sudanese adults with different occlusions. Forensic Sci Int 2016; 266:209-214. https://doi.org/10.1016/j.forsciint.2016.05.018
» https://doi.org/10.1016/j.forsciint.2016.05.018 -
[5] Ramesh GR, Gadiputi Sreedhar N, Narayanappa M. Facial soft tissue thickness in forensic facial reconstruction: Is it enough if norms set? J Forensic Res 2015; 6(5):2-4. https://doi.org/10.4172/2157-7145.1000299
» https://doi.org/10.4172/2157-7145.1000299 - [6] Ozerovic´ B. Rendgen Craniometry and Rendgen Cephalometry. Belgrade: Med Kn; 1984.
-
[7] Somaiah S, Khan M, Muddaiah S, Shetty B, Reddy G, Siddegowda R. Comparison of soft tissue chin thickness in adult patients with various mandibular divergence patterns in Kodava population. Int J Orthod Rehabil 2017; 8(2):51. https://doi.org/10.4103/ijor.ijor_38_16
» https://doi.org/10.4103/ijor.ijor_38_16 - [8] AlBarakati SF. Soft tissue facial profile of adult Saudis: lateral cephalometric analysis. Saudi Med J 2011; 32(8):836-842.
- [9] Jabbar A, Zia AU, Shaikh IA, Channar KA, Memon AB, Jatoi N. Evaluation of soft tissue chin thickness in various skeletal malocclusions. Pakistan Orthod J 2016; 8(1):62-66.
- [10] Rehan A, Iqbal R, Ayub A, Ahmed I. Soft tissue analysis in Class I and Class II skeletal malocclusions. Pakistan Oral Dent J 2014; 34(1):87-90.
-
[11] Fernandes TMF, Pinzan A, Sathler R, Freitas MR, Janson G, Vieira FP. Comparative study of soft tissue of young Japanese-Brazilian, Caucasian and Mongoloid patients. Dental Press J Orthod 2013; 18(2):116-124. https://doi.org/10.1590/S2176-94512013000200023
» https://doi.org/10.1590/S2176-94512013000200023 -
[12] Kaur M, Garg RK, Singla S. Analysis of facial soft tissue changes with aging: a forensic perspective. Egypt J Forensic Sci 2015; 5(2):46-56. https://doi.org/10.1016/j.ejfs.2014.07.006
» https://doi.org/10.1016/j.ejfs.2014.07.006 -
[13] Utsuno H, Kageyama T, Uchida K, Yoshino M, Miyazawa H, Inoue K. Facial soft tissue thickness in Japanese children. Forensic Sci Int 2010; 199(1-3):109.e1-109.e6. https://doi.org/10.1016/j.forsciint.2010.02.016
» https://doi.org/10.1016/j.forsciint.2010.02.016 - [14] Yadav R, Gaharwar JS. Soft tissue cephalometric norms for central India population. Indian J Orthod Dentofac Res 2016; 2(2):83-86.
-
[15] Othman SA, Majawit LP, Hassan WNW, Wey MC, Razi RM. Anthropometric study of three-dimensional facial morphology in Malay adults. PLoS One 2016; 11(10):e0164180. https://doi.org/10.1371/journal.pone.0164180
» https://doi.org/10.1371/journal.pone.0164180 - [16] Masoume J, Farzad E, Mohaddeseh MM. Facial soft tissue thickness in North-West Iran. Adv Biosci Clin Med 2015; 3(1):29-34.
- [17] Haresh AD, Singh P, Song J. Soft tissue thickness determination using CBCT in diverse medical disciplines. J Pharm Biomed Sci 2015; 5(12):967-972.
-
[18] Drgáčová A, Dupej J, Velemínská J. Facial soft tissue thicknesses in the present Czech population. Forensic Sci Int 2016; 260:106.e1-106.e7. https://doi.org/10.1016/j.forsciint.2016.01.011
» https://doi.org/10.1016/j.forsciint.2016.01.011 -
[19] Suazo Galdames IC, Cantín López M, Zavando Matamala DA, Perez Rojas FJ, Torres Muñoz SR. Comparisons in soft-tissue thicknesses on fresh and embalmed corpses using needle puncture. Int J Morphol 2008; 26(1):165-169. https://doi.org/10.4067/S0717-95022008000100027
» https://doi.org/10.4067/S0717-95022008000100027 -
[20] Kaur K, Sehrawat JS, Bahadur R. Sex-dependent variations in craniofacial soft-tissue thicknesses from MRI and CT. Int J Diagn Imaging 2017; 4(2):47. https://doi.org/10.5430/ijdi.v4n2p47
» https://doi.org/10.5430/ijdi.v4n2p47 -
[21] Chen F, Chen Y, Yu Y, Qiang Y, Liu M, Fulton D, et al. Age and sex related measurement of craniofacial soft tissue thickness and nasal profile in the Chinese population. Forensic Sci Int 2011; 212(1-3):272-e1. https://doi.org/10.1016/j.forsciint.2011.05.027
» https://doi.org/10.1016/j.forsciint.2011.05.027 -
[22] Feres MFN, Hitos SF, Sousa HIP, Matsumoto MAN. Comparison of soft tissue dimensions among distinct facial patterns. Dental Press J Orthod 2010;1 5(4):84-93. https://doi.org/10.1590/S2176-94512010000400013
» https://doi.org/10.1590/S2176-94512010000400013 -
[23] Celikoglu M, Buyuk SK, Ekizer A, Sekerci AE, Sisman Y. Soft tissue thickness at the lower anterior face using CBCT in different vertical patterns. Angle Orthod 2015; 85(2):211-217. https://doi.org/10.2319/040114-237.1
» https://doi.org/10.2319/040114-237.1 -
[24] Tanic T, Blazej Z, Mitic V. Soft tissue thickness of face profile conditioned by dentoskeletal anomalies. Srp Arh Celok Lek 2011; 139(7-8):439-445. https://doi.org/10.2298/SARH1108439T
» https://doi.org/10.2298/SARH1108439T -
[25] Tanic T, Blazej Z, Mitic V. Analysis of soft tissue thickness in Class II division 1 and 2 malocclusions. Srp Arh Celok Lek 2012; 140(7-8):412-418. https://doi.org/10.2298/SARH1208412T
» https://doi.org/10.2298/SARH1208412T -
[26] Hwang H, Park M, Lee W, Cho J, Kim B, Wilkinson CM. Facial soft tissue thickness database for Korean adults. J Forensic Sci 2012; 57(6):1442-1447. https://doi.org/10.1111/j.1556-4029.2012.02192.x
» https://doi.org/10.1111/j.1556-4029.2012.02192.x - [27] Al-Mashhadany SM, Al-Chalabi HM, Nahidh M. Evaluation of facial soft tissue thickness in adults with vertical discrepancies. Int J Sci Res 2017; 6(2):938-942.
- [28] Stephan CN, Norris RM, Henneberg M. Does sexual dimorphism in facial soft tissue depths justify sex distinction in craniofacial identification?. J Forensic Sci 2005; 50(3):513-518.
-
[29] Briers N, Briers TM, Becker PJ, Steyn M. Soft tissue thickness values for South African children (6-13 years). Forensic Sci Int 2015; 252:188.e1-188.e10. https://doi.org/10.1016/j.forsciint.2015.04.015
» https://doi.org/10.1016/j.forsciint.2015.04.015 -
[30] Macari AT, Hanna AE, Chekie ME. Comparisons of facial soft tissue characteristics in adult patients with various mandibular divergence patterns. BMC Oral Health 2025; 25(1):660. https://doi.org/10.1186/s12903-025-06054-7
» https://doi.org/10.1186/s12903-025-06054-7 -
[31] Perović T, Blažej Z. Facial soft tissue thickness in different orthodontic malocclusions. Med Sci Monit 2018; 24:3415-3424. https://doi.org/10.12659/MSM.907485
» https://doi.org/10.12659/MSM.907485 -
[32] Ajwa N, Alkhars FA, AlMubarak FH, Aldajani H, AlAli NM, Alhanabbi AH, et al. Correlation between sex and facial soft tissue characteristics among young Saudi patients with various orthodontic skeletal malocclusions. Med Sci Monit 2020; 26:e919771. https://doi.org/10.12659/MSM.919771
» https://doi.org/10.12659/MSM.919771 -
[33] Booij JW, Serafin M, Fastuca R, Kuijpers-Jagtman AM, Caprioglio A. Cephalometric changes after orthodontic treatment of Class II malocclusion. J Clin Med 2022; 11(11):3170. https://doi.org/10.3390/jcm11113170
» https://doi.org/10.3390/jcm11113170 -
[34] Al-Taai N, Persson M, Ransjö M, Levring Jäghagen E, Westerlund A. Dentoskeletal and soft tissue changes after premolar extraction: 50-year follow-up. Eur J Orthod 2023; 45(1):79-87. https://doi.org/10.1093/ejo/cjac035
» https://doi.org/10.1093/ejo/cjac035 -
[35] Jeong SH, Yun JP, Yeom HG, Lim HJ, Lee J, Kim BC. Deep learning discrimination of soft tissue profiles. Sci Rep 2020; 10:16235. https://doi.org/10.1038/s41598-020-73287-7
» https://doi.org/10.1038/s41598-020-73287-7 -
[36] Alhazmi N, Alrasheed F, Alshayea K, et al. Facial soft tissue characteristics in sagittal and vertical patterns. Cureus 2023; 15(8):e44428. https://doi.org/10.7759/cureus.44428
» https://doi.org/10.7759/cureus.44428 -
[37] Aggarwal I, Singla A. Soft tissue cephalometric analysis applied to Himachali ethnic population. Indian J Dent Sci 2016; 8(3):124-130. https://doi.org/10.4103/0976-4003.191731
» https://doi.org/10.4103/0976-4003.191731 -
[38] Perović TM, Blažej M, Jovanović I. Influence of mandibular divergence on facial soft tissue thickness in Class I patients: A cephalometric study. Folia Morphol 2022; 81(2):472-480. https://doi.org/10.5603/FM.a2021.0029
» https://doi.org/10.5603/FM.a2021.0029 -
[39] Saadeh M, Fayyad-Kazan H, Haddad R, Ayoub F. Facial soft tissue thickness differences among vertical facial patterns. Forensic Sci Int 2020; 317:110468. https://doi.org/10.1016/j.forsciint.2020.110468
» https://doi.org/10.1016/j.forsciint.2020.110468 -
[40] Jeelani W, Fida M, Shaikh A. Facial soft tissue thickness among vertical facial patterns in adult Pakistani subjects. Forensic Sci Int 2015; 257:517.e1-517.e6. https://doi.org/10.1016/j.forsciint.2015.09.006
» https://doi.org/10.1016/j.forsciint.2015.09.006 -
[41] Patil HS, Golwalkar S, Chougule K, Kulkarni NR. Comparative evaluation of soft tissue chin thickness in adult Class II malocclusion patients with vertical growth patterns: a cephalometric study. Folia Med 2021; 63(1):74-80. https://doi.org/10.3897/folmed.63.e52165
» https://doi.org/10.3897/folmed.63.e52165 -
[42] Abdulal G, Osman A, Abyad A. Evaluation of facial soft-tissue morphology among different vertical skeletal profiles. Eur Sci J 2022; 18(11):117-134. https://doi.org/10.19044/esj.2022.v18n11p117
» https://doi.org/10.19044/esj.2022.v18n11p117 -
[43] Macari AT, Hanna AE. Comparisons of soft tissue chin thickness in adult patients with various mandibular divergence patterns. Angle Orthod 2014; 84(4):708-714. https://doi.org/10.2319/062613-474.1
» https://doi.org/10.2319/062613-474.1 -
[44] Celebi AA, Keklik H, Tan E, Ucar FI. Comparison of arch forms between Turkish and North American populations. Dental Press J Orthod 2016; 21(2):51-58. https://doi.org/10.1590/2177-6709.21.2.051-058.oar
» https://doi.org/10.1590/2177-6709.21.2.051-058.oar -
[45] Yousefi F, Oliaii F, Mollabashi V, Farhadian M. Cephalometric evaluation of facial soft tissue thickness in Class I patients with vertical growth patterns regarding age and gender. Avicenna J Clin Med 2021; 28(2):104-111. https://doi.org/10.52547/ajcm.28.2.104
» https://doi.org/10.52547/ajcm.28.2.104 -
[46] Farha P, Arqub SA, Ghoussoub MS. Correlation between cephalometric values and soft tissue profile in Class I and Class II adults based on vertical patterns. Turkish J Orthod 2024; 37(1):36-43. https://doi.org/10.4274/TurkJOrthod.2023.2022.20
» https://doi.org/10.4274/TurkJOrthod.2023.2022.20 -
[47] Eröz Dilaver B, Gündoğdu Ş, Kiki A. Effects of different vertical growth patterns on facial morphology in Class II cases. Curr Res Dent Sci 2022; 32(1):67-70. https://doi.org/10.17567/ataunidfd.1013064
» https://doi.org/10.17567/ataunidfd.1013064 -
[48] Hashim HA, Al-Sayed N, Al-Obaidli N, Hashim MH, Al Jawad FA. Impact of vertical growth on dental and soft tissue profile: A comparative study. Oral Health Dent Sci 2024; 8(1). https://doi.org/10.33425/2639-9490.1141
» https://doi.org/10.33425/2639-9490.1141 -
[49] Bhullar MK, Thakur AK, Mittal S, Aggarwal I, Palkit T, Goyal M. Evaluation and correlation of Beta angle with Wits appraisal and ANB angle in skeletal malocclusions. Dent J Adv Stud 2021; 9(2):96-100. https://doi.org/10.1055/s-0041-1731923
» https://doi.org/10.1055/s-0041-1731923 -
[50] Farias Gomes A, Moreira DD, Zanon MF, Groppo FC, Haiter-Neto F, Freitas DQ. Soft tissue thickness in Brazilian adults with different skeletal classes and facial types: A cone beam CT study. Legal Med 2020; 47:101743. https://doi.org/10.1016/j.legalmed.2020.101743
» https://doi.org/10.1016/j.legalmed.2020.101743 -
[51] Sarilita E, Rynn C, Mossey PA, Black S, Oscandar F. Facial soft tissue depth variation across skeletal classes in Indonesian adults: A lateral cephalometric study. Legal Med 2020; 43:101665. https://doi.org/10.1016/j.legalmed.2019.101665
» https://doi.org/10.1016/j.legalmed.2019.101665 -
[52] Aboobacker N, Shetty S, Umar D, Shetty S. Soft-tissue changes in growing Class III patients after maxillary advancement: A retrospective cephalometric study. Adv Hum Biol 2025; 15(1):93-98. https://doi.org/10.4103/aihb.aihb_102_24
» https://doi.org/10.4103/aihb.aihb_102_24 -
[53] Adnan N, Amin E, Nawaz R, Ijaz M, Shah TI, Janjua T. Cephalometric differences in male and female facial soft tissue thickness across orthodontic malocclusions. Pakistan Armed Forces Med J 2024; 74(2):410-414. https://doi.org/10.51253/pafmj.v74i2.8422
» https://doi.org/10.51253/pafmj.v74i2.8422 -
[54] Stephan CN, Preisler R, Bulut O, Bennett M. Why females possess thicker facial soft tissues than males: turning the tables in sex distinction for craniofacial identification. Am J Phys Anthropol 2016; 161(2):283-295. https://doi.org/10.1002/ajpa.23029
» https://doi.org/10.1002/ajpa.23029 -
[55] Švábová P, Matláková M, Beňuš R, Chovancová M, Masnicová S. Relationship between biological parameters and facial soft tissue thickness measured by ultrasound: Forensic implications. Med Sci Law 2024; 64(1):23-31. https://doi.org/10.1177/00258024231182360
» https://doi.org/10.1177/00258024231182360
Edited by
-
Academic Editor: Catarina Ribeiro Barros de Alencar