 Changes in physiological parameters of boldo plants under water deficit conditions1
Abstract
Water deficit is one of the main factors affecting the growth and development of boldo plants. This study aimed to evaluate the effects of water deficit on the growth and physiological parameters of Plectranthus barbatus. The experiment was conducted in pots, and the treatments were arranged in a completely randomized design, with five irrigation intervals (1 to 5 days) and four replicates. Plant height, leaf area, number of leaves, transpiration rate (E), stomatal conductance (gs), net photosynthetic rate (A), water- use efficiency (WUE), intrinsic water-use efficiency (iWUE), and leaf water potential (Ψw) were evaluated. Thermal time was also computed. The thermal requirement of the species was 3,253 ºC degree-days. Increasing the irrigation interval reduced the plant height, leaf area, number of leaves, and biomass production of both shoots and roots. Reductions in E, gs, A, WUE, and iWUE were also observed, along with a decrease in relative water content at the turgor loss point, as the irrigation interval was prolonged. No significant effect of irrigation interval was observed on the osmotic potential at full turgor, at turgor loss point, or on Ψw; however, the cell wall rigidity increased, as indicated by a higher volumetric elastic modulus. Water deficit induces water stress in boldo plants, impairing vegetative growth and gas exchange, with consequent changes in plant water status.
Keywords:
Plectranthus barbatus Andrews; gas exchange; water restriction
RESUMO
O déficit hídrico é um dos principais fatores que afetam o crescimento e desenvolvimento de plantas de boldo. Objetivou-se avaliar os efeitos do déficit hídrico sobre o crescimento e parâmetros fisiológicos de Plectranthus barbatus. O experimento foi conduzido em vasos e os tratamentos dispostos em delineamento inteiramente casualizado, com cinco intervalos de irrigação (1 a 5 dias) e quatro repetições. Foram avaliados a altura de planta, área foliar, número de folhas, taxa de transpiração (E), condutância estomática (gs), taxa fotossintética líquida (A), eficiência do uso da água (EUA), eficiência intrínseca do uso da água (EiUA) e potencial hídrico foliar (Ψw). O tempo térmico também foi calculado. A exigência térmica da espécie foi de 3.253 ºC graus-dia. O aumento do intervalo de irrigação reduziu a altura de planta, área foliar, número de folhas e a produção de biomassa da parte aérea e das raízes. Também foram observadas reduções em E, gs, A, EUA e EiUA, bem como diminuição do teor relativo de água no ponto de perda de turgescência, à medida que o intervalo de irrigação foi prolongado. Não foi observado efeito significativo do intervalo de irrigação sobre o potencial osmótico à plena turgescência, no ponto de perda de turgescência ou sobre Ψw; entretanto, a rigidez da parede celular aumentou, indicada por um maior módulo volumétrico de elasticidade. O déficit hídrico induz estresse hídrico em plantas de boldo, comprometendo o crescimento vegetativo e as trocas gasosas, com consequentes alterações no estado hídrico das plantas.
PALAVRAS-CHAVE:
Plectranthus barbatus Andrews; trocas gasosas; restrição hídrica
INTRODUCTION
Boldo (Plectranthus barbatus Andrews) is native to India and Africa, and is widely used as a medicinal plant because it contains compounds with anti-inflammatory, antitumoral, cardiovascular, and hypotensive activity (Costa 2006).
Water deficit in medicinal plants may affect the synthesis of secondary metabolites, including essential oils (Domingos et al. 2020); therefore, quantifying its effects is important to support research on secondary metabolite production (Borges & Amorim 2020). Such effects have been reported in the literature for craibeira [Tabebuia aurea (Silva Manso) Benth. & Hook. F. ex S. Moore] and basil (Ocimum basilicum var. Cinamon) species (Domingos et al. 2020, Ramos et al. 2020).
Water stress occurs when water availability is below or above the range tolerated by the plant, thereby affecting physiological processes (Sousa & Sousa 2017, Kulak 2020).
The greater the intensity of water deficit, the more these processes are affected, and, consequently, the more plant growth is impaired (Bianchi et al. 2016). As a result of water restriction, plants exhibit different physiological responses, such as reduced leaf water potential, regulation of stomatal closure, decreased photosynthesis, reduced shoot growth, accelerated senescence, and leaf abscission (Ferrari et al. 2015).
An aspect to be considered under conditions of low water availability is atmospheric evaporative demand, which reflects the combined effects of soil evaporation and plant transpiration. Because atmospheric demand is a major driver of plant water loss, water-deficit stress reduces leaf turgor, which, in turn, limits leaf expansion and leaf area, and contributes to lower transpiration (Araújo Júnior et al. 2019).
In this context, water deficit triggers a series of integrated physiological responses, including changes in water potential, relative water content, and the turgor loss point (Taiz & Zeiger 2017). The analysis of water relations using these parameters has been widely applied to characterize tolerance strategies to water stress, as it integrates mechanisms related to osmotic adjustment and the mechanical properties of the cell wall. Recent studies show that turgor maintenance under water limitation results from the interaction among these mechanisms, highlighting the importance of using physiological indicators to understand plant responses to water deficit (Ortega 2023, Yu et al. 2024).
Thus, this study aimed to evaluate the effects of water deficit on the physiological parameters of boldo plants (Plectranthus barbatus Andrews).
MATERIAL AND METHODS
To quantify water stress in the boldo plants, an experiment was conducted in pots at the experimental farm of the Universidade Federal de Mato Grosso, in Santo Antônio do Leverger, Mato Grosso state, Brazil (15º46’S, 56º04’W and altitude of 140 m), between August and November 2020.
Daily meteorological data on maximum, minimum, and mean air temperatures, relative air humidity, and global solar radiation were obtained from an automatic meteorological station located near the experimental area.
Boldo seedlings were produced from apical cuttings measuring 40-60 mm in length, with two leaves, and directly placed in plastic pots (0.230 m in height, 0.245 m in upper diameter, and 0.155 m in lower diameter) for rooting, with two cuttings per pot.
The soil used as substrate was collected from the 0-0.20 m soil layer, in an area at approximately 1,000 m from the experimental site, mixed with cattle manure at a 3:1 ratio, and sieved (5-mm mesh). The soil of the experimental area was classified as Planossolo Háplico Eutrófico gleissólico (Santos et al. 2018), corresponding to typic Eutrophic Albaqualf (Alfisol) (USDA 2022).
A disturbed soil sample was separated and sent to the laboratory for chemical and physical analyses. The proportions of sand, silt, and clay were 740, 72, and 188 g kg-1, respectively, and the results of the chemical analysis are described in Table 1.
Analytical results of the soil sample amended with cattle manure used for the cultivation of boldo.
The pots had a total capacity of 0.00750 m3, calculated based on a conical shape. A height of 0.03 m was subtracted from the total height, corresponding to the rim height above the soil surface, resulting in a usable volume of 0.00639 m3.
The experiment was conducted in a completely randomized design with five treatments and four replicates. The treatments consisted of irrigation intervals of 1, 2, 3, 4, and 5 days, with irrigation events applying 500 mL of water per application.
After 20 days of cultivation under morning sunlight and afternoon shade, the seedlings were acclimated to full sunlight for 10 days before the beginning of the experimental period.
At the beginning of treatment application, all pots were sealed at the surface with plastic film to prevent evaporation, allowing only plant transpiration.
To determine the soil moisture at field capacity, the pots were initially irrigated and left to rest until the following day, without irrigation on that day. The following day, water was applied to the pots under shade until drainage visually ceased. At that moment, all pots were weighed using a scale with capacity of 15 kg and precision of 100 g, obtaining an average mass of 6.45 kg, which was considered the wet soil mass at field capacity.
The permanent wilting point was determined using a WP4C Potential Meter psychrometer (Decagon Devices Inc., Pullman, WA, USA). For this purpose, soil samples with disturbed structure were collected with three replications, using five matric potential points to obtain the soil water retention curve and estimate the permanent wilting point at a matric potential of -1.5 MPa, namely: 0 to -0.5 MPa; -0.5 to -1 MPa; -1 to -1.5 MPa; -1.5 to -2 MPa; and -2 to -2.5 MPa.
Subsequently, the samples were dried in a forced-air oven at 105 ºC, for 24 hours (Teixeira et al. 2017), thus obtaining paired data of gravimetric water content and matric potential.
To quantify the current volumetric soil moisture, the gravimetric moisture was divided by the pot volume, and bulk density was calculated as the dry soil mass divided by the pot volume. Based on these data, the available water capacity of the pots could be calculated.
Morphophysiological evaluations of plant development were conducted every 12 days after the treatment initiation until 20 days before the end of the experiment, measuring plant height, leaf area, and number of leaves.
Plant height was measured from the insertion of the main stem to the insertion of the last leaf at the shoot apex, using a graduated ruler. The average height of the two plants per pot was then calculated.
The leaf area of each plant was determined using a non-destructive method, based on measurements of leaf length and width, and a correction factor, which was calculated by collecting a sample of 10 leaves of different sizes that best represented the whole plant, selecting first the largest leaf and then progressively smaller leaves. The leaves were placed individually on a square graduated wooden board with a smooth white surface, where leaf length and width were measured. Subsequently, the leaves were photographed and processed using the ImageJ software to obtain the leaf area.
The thermal time accumulation (degree-days) of the boldo plants was also estimated using the thermal summation method, considering a lower base temperature (Tb) of 10 ºC (Manfron et al. 1993) and an upper threshold (ceiling) temperature (TB) of 35 ºC (Nadal 1986). Degree-day calculations were performed according to Ometto (1981), based on daily maximum and minimum air temperatures obtained during the experimental period.
Fresh and dry leaf masses were determined by harvesting one replicate per treatment, and the leaf area of the harvested plants was related to their dry mass.
Root volume was determined by removing the plants from the pots at 90 days after the treatment implementation, washing the roots, and weighing them individually. A graduated cylinder was used, in which the fresh root system was immersed in a known volume of water, and the difference between the known water volume and the obtained displaced volume was the root volume. Subsequently, the roots were dried in a forced-air oven at 65 ºC, for 72 hours, to obtain the root dry mass.
In each treatment, the total plant transpiration was determined as the difference in total pot mass between the beginning and the end of each irrigation interval. Pots were weighed daily (treatment 1) and at every two (treatment 2), three (treatment 3), four (treatment 4), and five (treatment 5) days, using a scale with capacity of 15 kg and precision of 100 g. Variations in plant mass during weighing intervals were disregarded.
Based on this measurement, it was possible to evaluate the relationship between transpiration and the gain or loss of dry mass, fresh mass, and leaf area behavior under different irrigation intervals.
Gas exchange measurements were performed at the end of the experiment, between 07:00 and 11:00 a.m., using a portable photosynthesis system (LI-6400 XT, Li-Cor Biosciences, Lincoln, NE, USA) with fixed light source set at 1,000 µmol m-2 s-1, internal CO2 concentration of 400 µmol mol-1, and temperature of 30 ºC.
The transpiration rate (E; mmol m-2 s-1), stomatal conductance (gs; mol m-2 s-1), and net photosynthetic rate (A; µmol m-2 s-1) were measured on the third fully expanded and visually healthy leaf from the apex of each plant, for each treatment and replication. From the A, E, and gs measurements, the water-use efficiency (WUE; µmol mmol-1) was calculated as the ratio of A to E, and intrinsic water-use efficiency (iWUE; µmol mol-1) as the ratio of A to gs.
At the end of the experimental period, the leaf water potential (Ψw) was determined for each treatment at the end of each irrigation interval and immediately before water application, using a Scholander-type pressure chamber (PMS Instrument Company, USA), as described by Scholander et al. (1965). The same leaf used for gas exchange measurements was cut at the petiole insertion and immediately transferred to the pressure chamber to avoid dehydration.
Pressure readings inside the chamber were obtained using a manometer with resolution of 0.02 kgf cm-2, and values were subsequently converted to MPa.
Measurements were performed at two predefined times: post-stress (one day after irrigation) and peak stress (the last day without irrigation), between 07:00 and 11:00 a.m., to obtain the leaf water potential under full turgor and maximum water demand, respectively.
Three representative leaf water status intervals were classified as follows: Ψw < -1.5 MPa as high stress; Ψw between -1.5 and -0.8 MPa as moderate stress; and Ψw > -0.8 MPa as no stress (Bono et al. 2001).
To obtain the osmotic potential at full turgor (Ψπ100), osmotic potential at turgor loss point (Ψπ0), and volumetric elastic modulus (ε), pressure-volume curve adjustments were performed according to Ding et al. (2014).
The pressure-volume (p-v) curve describes the decline in leaf water potential (Ψw) as tissue water deficit increases (Taiz & Zeiger 2017) and was constructed based on the relationship between the inverse of the applied pressure (1/Ψ) and the relative water content at the turgor loss point (RWC).
The curves were obtained through successive Ψw measurements on one healthy leaf per treatment (Tyree & Jarvis 1982). On the day of irrigation, the leaf was wrapped in aluminum foil until the following day, to ensure full turgor. Subsequently, the leaf was removed, transported to the laboratory, weighed on an analytical scale to determine its fresh mass at maximum turgor, and then the Ψw was measured.
After each reading, the sample was depressurized and re-pressurized with gradual pressure increments until xylem sap exudation was observed at the cut end of the petiole. The exuded sap was collected using filter paper and immediately weighed, allowing estimation of the amount of water removed from the tissue and, consequently, the RWC corresponding to each pressure level. This procedure was repeated until further pressure increments produced no xylem sap exudation. Subsequently, the leaf was dried in a forced-air oven at 65 ºC, for 72 hours, to obtain the leaf dry mass (Md).
The relative water content at the turgor loss point (RWC) was determined from the p-v curve, according to the general equation: RWC (%) = [(Mtp - Md)/(Mt - Md)] x 100, where: Mtp is the leaf mass at the turgor loss point, estimated from the p-v curve; Mt is the leaf mass at full turgor; and Md is the leaf dry mass.
Data on the effects of treatments on physiological variables were analyzed using the bootstrap technique, with replicate resampling and a non-parametric 95 % confidence interval for mean comparisons. The analyses were performed in the RStudio statistical environment (R Core Team 2021), using the boot package (Canty & Ripley 2021).
The remaining variables were evaluated using linear regression analyses to estimate the coefficient of determination (R2) in Microsoft Excel spreadsheets.
RESULTS AND DISCUSSION
The soil moisture at field capacity and at the permanent wilting point were 0.595 and 0.200 kg kg-1, respectively (Figure 1).

Soil moisture characteristic curve for determining the water content at field capacity and permanent wilting point of pots cultivated with boldo.
During the experimental period, the daily mean temperature remained within the limits required for plant development, not falling below 10 ºC or exceeding 35 ºC. However, the daily maximum temperature exceeded the upper threshold (ceiling) during some periods (Figure 2), thereby increasing evapotranspiration rates due to higher plant water demand.

Maximum, minimum, and average air temperatures (T), relative air humidity (RH), and global solar radiation (Qg) during the experimental period (Santo Antônio do Leverger, Mato Grosso state, Brazil, 2020).
Considering water fluxes in the soil-plant- atmosphere system and the high temperatures recorded during the experiment, the results suggest a high plant water demand driven by atmospheric evaporative demand. This indicates that as water demand increases and irrigation intervals lengthen, soil water availability decreases, leading to plant water deficit.
A greater plant growth was observed under conditions without water restriction (Figure 3), indicating that the soil water deficiency progressively affected the plant height and leaf development. The thermal time accumulated by the plants during the experimental period was 3,253 ºC d-1 (degree-days). Under water-stress conditions, many plant species show reductions in leaf area expansion, plant height, and number of leaves during the stress period (Gatabazi et al. 2019, Jacinto Júnior et al. 2019). It is important to emphasize that, as water is the main component of biochemical reactions in plant cells, water deficiency tends to induce a series of adjustment responses that may cause morphophysiological changes, such as stomatal closure, reduced cell expansion, decreased number of leaves, reduced photosynthesis, and lower transpiration rates (Hsiao 1973).

Relationships among plant height (a), number of leaves per plant (b), and leaf area (c) of boldo as a function of accumulated degree-days under five irrigation interval treatments, corresponding to different irrigation management regimes.
Development and growth rates depend on temperature, and each species has a minimum, maximum, and optimum temperature range for development (Hatfield & Prueger 2015, Taiz & Zeiger 2017). Growth improves as temperature approaches the optimum and as thermal requirements are met throughout the crop cycle (Hatfield & Prueger 2015, Taiz & Zeiger 2017). In non-perennial species, this development is achieved more rapidly (Hatfield & Prueger 2015); however, as boldo is a perennial species, further studies are required to determine the extent to which thermal requirements favor its development.
The leaf dry mass, root dry mass, and root volume decreased significantly with increasing irrigation intervals (Figure 4).

Leaf dry mass (LDM), root dry mass (RDM), and root volume (RV) of boldo under five irrigation interval treatments.
Some plants extend their root systems to search for water in the soil under water-deficit conditions, as observed by Fasolin et al. (2019) in a study with peanut plants. The authors verified that root growth exhibited an inverse relationship with leaf area development and dry matter production, which were significantly reduced, whereas root expansion increased. These results demonstrate that different plant species exhibit distinct adaptive strategies of the root system in response to water restriction.
While some plants seek water resources through root extension, others exhibit similar responses in the shoot, reducing root volume (Scalon et al. 2011, Alhaithloul et al. 2020, Barros et al. 2021, Araujo 2022). Studies show that water restriction causes, in different species, reductions in vegetative growth, root growth, leaf dry mass accumulation, fresh mass, and root dry mass (Scalon et al. 2011, Alhaithloul et al. 2020, Barros et al. 2021, Araujo 2022). In contrast, greater water availability promotes a better development of these variables (Gatabazi et al. 2019, Jacinto Júnior et al. 2019, Ramos et al. 2020), as observed in the present study. It was also observed that water restriction in boldo reduced the leaf area, plant height, number of leaves, and root system development.
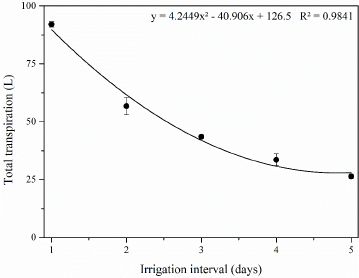
The total transpiration results under different irrigation intervals indicated that transpiration was lower at longer water replenishment intervals, evidencing a lower soil water availability under the 5-day irrigation interval (Figure 5).

Total transpiration of boldo plants under five irrigation interval treatments, representing different irrigation management regimes.
When the evaporative demand exceeds the water supply for transpiration, stomata close, preventing leaf water potential from falling below a critical level (Wesemael et al. 2019).
Linear relationships between leaf area, dry mass, and fresh mass as a function of total transpiration demonstrated that the increased transpiration was proportional to increases in leaf area and plant dry mass (Figure 6).

Relationships among leaf area (LA), fresh plant mass (FPM), and dry plant mass (DPM) of boldo plants according to the total transpiration.
The reduced soil water availability under water restriction decreased gs and, consequently, E and A. As CO2 assimilation is the primary source of structural and non-structural organic components in plants (Taiz & Zeiger 2017), the reduction in A led to decreases in leaf area and biomass, although plants rapidly recovered gas-exchange physiological conditions after irrigation (Figure 7).

Transpiration rate (E), stomatal conductance (gs), net photosynthetic rate (A), water-use efficiency (WUE), and intrinsic water-use efficiency (iWUE) of boldo plants measured at peak water stress and at one day after irrigation, under irrigation interval treatments, at a 5 % significance level.
Wesemael et al. (2019) reported that a lower stomatal conductance restricts the CO2 uptake for photosynthesis, resulting in reduced CO2 assimilation and relative water savings, while maintaining the growth potential. Jacinto Júnior et al. (2019) also observed that water deficit influences the behavior of these variables. Ferreira et al. (2024) reported differential responses among species, observing a more pronounced reduction in stomatal conductance in eggplant (C3) than in maize (C4), under varying levels of water restriction. The authors emphasized that maize, due to its C4 metabolism, exhibited a higher photosynthetic efficiency under water restriction.
Across all treatments, the mean photosynthetic activity under plant rehydration conditions was approximately 17.63 μmol m-2 s-1, decreasing to values as low as -0.039 μmol m-2 s-1 at the peak water deficit. After only one day without irrigation under pot cultivation, gas exchange became impaired. It was observed that E and gs followed the same pattern: under rehydration, plants favored stomatal opening, increasing stomatal conductance and transpiration rate, indicating that plants rapidly perceived soil water availability.
The leaf water potential (Ψw) values evaluated after irrigation and at peak water stress (absence of irrigation) remained practically constant, with no significant variation, ranging between -0.4 and -0.6 MPa. This behavior indicates that, even under water-deficit conditions, Ψw was maintained due to reduced stomatal conductance, which limited transpiration and helped to maintain the leaf water status (Figure 8).

Analyzing thyme plants under water stress, Moradi et al. (2014) observed a reduction in the leaf water potential as the soil water restriction intensified. For certain plants, Ψw is an indicator of water deficiency, as plant water flow is directly related to the soil-plant-atmosphere system (Taiz & Zeiger 2017, Araújo Júnior et al. 2019). Thus, when evaporative demand is high and soil water is unavailable, the leaf water potential decreases, impairing root water uptake (Taiz & Zeiger 2017, Wesemael et al. 2019). Consequently, the shoot signals stomatal closure, reducing stomatal conductance and gas exchange (Hsiao 1973, Ferrari et al. 2015, Wesemael et al. 2019).
The water status parameters of boldo plants obtained from the pressure-volume curve indicated that the relative water content at the turgor loss point (RWC) decreased by approximately 25 % in plants subjected to five days of water restriction, if compared with other treatments. In contrast, the osmotic potential at full turgor (Ψπ100) and at the turgor loss point (Ψπ0) remained less negative and were associated with higher values of volumetric elastic modulus (ε), reaching up to 8.25 MPa (Table 2).
Mean parameters of pressure-volume curves for boldo leaves under different irrigation intervals.
This behavior indicates that, under prolonged water deficit, the main physiological adjustment mechanism of the species consisted of increased cell wall elasticity, favoring the maintenance of leaf turgor and physiological activity at the expense of osmotic solute accumulation.
Conversely, more negative Ψπ100 and Ψπ0 values were observed in plants with higher elastic modulus, indicating that tissues with more rigid cell walls tend to intensify the solute accumulation as a strategy to maintain a positive turgor pressure and enhance drought tolerance. Similar results were reported by Maréchaux et al. (2015), who demonstrated that cell wall adjustment, particularly elasticity, is regulated by RWC and is directly related to osmotic potential.
According to Ortega (2023), turgor maintenance is associated not only with osmotic adjustment, but also with modifications in the mechanical properties of the cell wall, which may contribute to increased tolerance to water stress. In addition, methodological advances in determining the turgor loss point further strengthen the applicability of these parameters for interpreting plant physiological responses to water limitation (Martin et al. 2024, Yu et al. 2024).
CONCLUSIONS
-
The growth of Plectranthus barbatus Andrews is adversely affected by water restriction. The species exhibits reductions in leaf area, root volume, and shoot and root biomass;
-
Water deficit affects gas exchange, reducing transpiration rate, stomatal conductance, and net photosynthetic rate, as well as the relative water content at the turgor loss point; however, the leaf water potential remains relatively stable, despite changes in the elastic properties of the cell wall.
Data Availability Statement:
Research data are only made available by authors upon request.
REFERENCES
- ALHAITHLOUL, H. A.; SOLIMAN, M. H.; AMETA, K. L.; EL-ESAWI, M. A.; ELKELISH, A. Changes in ecophysiology, osmolytes, and secondary metabolites of the medicinal plants of Mentha piperita and Catharanthus roseus subjected to drought and heat stress. Biomolecules, v. 10, n. 1, e43, 2020.
- ARAÚJO JÚNIOR, G. N.; GOMES, F. T.; SILVA, M. J.; JARDIM, A. M. F. R.; SIMÕES, V. J. L. P.; IZIDRO, J. L. P. S.; LEITE, M. L. M. V.; TEIXEIRA, V. I.; SILVA, T. G. F. Estresse hídrico em plantas forrageiras: uma revisão. PUBVET, v. 13, n. 1, e241, 2019.
- ARAUJO, E. C. Efeito do estresse hídrico no desenvolvimento inicial de mudas de Anadenanthera colubrina (vell.) Brenan var. cebil (griseb) Altschul (Angico). Enciclopédia Biosfera, v. 19, n. 40, p. 192-200, 2022.
- BARROS, J. R. A.; GUIMARÃES, M. J. M.; SIMÕES, W. L.; MELO, N. F.; ANGELOTTI, F. Water restriction in different phenological stages and increased temperature affect cowpea production. Ciência e Agrotecnologia, v. 45, e022120, 2021.
- BIANCHI, L.; GERMINO, G. H.; SILVA, M. A. Adaptação das plantas ao déficit hídrico. Acta Iguazu, v. 5, n. 4, p. 15-32, 2016.
- BONO, L.; BERGAMASCHI, H.; ROSA, L. M. G.; FRANÇA, S.; RADIN, B.; SANTOS, A. O.; BERGONCI, J. I. Alterações no padrão de resposta à luz da condutância estomática do milho causadas pelo déficit hídrico. Revista Brasileira de Agrometeorologia, v. 9, n. 1, p. 27-34, 2001.
- BORGES, L. P.; AMORIM, V. A. Metabólitos secundários de plantas. Revista Agrotecnologia, v. 11, n. 1, p. 54-67, 2020.
-
CANTY, A.; RIPLEY, B. D. boot: Boostrap R (S-Plus) functions. R package version 1.3-28. 2021. Available at: https://cran.r-project.org/package=boot Access on: June 20, 2021.
» https://cran.r-project.org/package=boot - COSTA, M. C. C. D. Uso popular e ações farmacológicas de Plectranthus barbatus Andr. (Lamiaceae): revisão dos trabalhos publicados de 1970 a 2003. Revista Brasileira de Plantas Medicinais, v. 8, n. 2, p. 81-88, 2006.
- DING, Y.; ZHANG, Y.; ZHENG, Q.-S.; TYREE, M. T. Pressure-volume curves: revisiting the impact of negative turgor during cell collapse by literature review and simulations of cell micromechanics. New Phytologist, v. 203, n. 2, p. 378-387, 2014.
- DOMINGOS, A. L. R. S.; MARCO, C. A.; MACHADO, M. I. R.; FEITOSA, A. J. S.; PALMEIRA, I. A.; SILVA, J. H. Teor e identificação do óleo essencial de manjericão (Ocimum basilicum var. Cinamon) submetido ao estresse hídrico em ambientes distintos. Research, Society and Development, v. 9, n. 8, e919985247, 2020.
- FASOLIN, J. P.; ZUCARELI, V.; CARBONIERI, J.; NAGASHIMA, G. T.; MORAIS, H.; CARAMORI, P. H.; MEDRI, M. E. Variação anatômica e fisiológica do amendoim (cultivar IAPAR 25 Tição) cultivado sob diferentes regimes hídricos. Acta Iguazu, v. 8, n. 3, p. 92- 104, 2019.
- FERRARI, E.; PAZ, A.; SILVA, A. C. Déficit hídrico no metabolismo da soja em semeaduras antecipadas no Mato Grosso. Nativa, v. 3, n. 1, p. 67-77, 2015.
- FERREIRA, J. C. C.; CRUZ, J. F.; NEGREIROS, T. M. N.; BRITO, W. B. M.; LIMA, A. F. L.; SOUZA, A. E. D. Respostas morfofisiológicas de plantas de milho e jiló ao estresse hídrico induzido. Revista em Agronegócio e Meio Ambiente, v. 17, n. 1, e11639, 2024.
- GATABAZI, A.; MARAIS, D.; STEYN, M. J.; ARAYA, H. T.; MOFOKENG, M. M.; MOKGEHLE, S. N. Evaluating growth, yield, and water use efficiency of African and commercial ginger species in South Africa. Water, v. 11, n. 3, e548, 2019.
- HATFIELD, J. L.; PRUEGER, J. H. Temperature extremes: effect on plant growth and development. Weather and Climate Extremes, v. 10, n. 1, p. 4-10, 2015.
- HSIAO, T. C. Plant responses to water stress. Annual Review of Plant Physiology, v. 24, n. 1, p. 519-570, 1973.
- JACINTO JÚNIOR, S. G.; MORAES, J. G. L.; SILVA, F. D. B.; SILVA, B. N.; SOUSA, G. G.; OLIVEIRA, L. L. B.; MESQUITA, R. O. Respostas fisiológicas de genótipos de fava (Phaseolus lunatus L.) submetidas ao estresse hídrico cultivadas no estado do Ceará. Revista Brasileira de Meteorologia, v. 34, n. 3, p. 413-422, 2019.
- KULAK, M. Recurrent drought stress effects on essential oil profile of Lamiaceae plants: an approach regarding stress memory. Industrial Crops and Products, v. 154, n. 15, e112695, 2020.
- MANFRON, P. A.; LAZZAROTO, C.; MEDEIROS, S. L. P. Trigo: aspectos agrometeorológicos. Revista do Centro de Ciências Rurais, v. 23, n. 2, p. 237-239, 1993.
- MARÉCHAUX, I.; BARTLETT, M. K.; SACK, L.; BARALOTO, C.; ENGEL, J.; JOETZJER, E.; CHAVE, J. Drought tolerance as predicted by leaf water potential at turgor loss point varies strongly across species within an Amazonian forest. Functional Ecology, v. 29, n. 10, p. 1268-1277, 2015.
- MARTIN, A. R.; LI, G.; CUI, B.; MARIANI, R. O.; VICARIO, K.; CATHLINE, K. A.; FINDLAY, A.; ROBERTSON, G. A high-throughput approach for quantifying turgor loss point in grapevine. Plant Methods, v. 20, e180, 2024.
- MORADI, P.; FORD-LLOYD, B.; PRITCHARD, J. Plant-water responses of different medicinal plant thyme (Thymus spp.) species to drought stress condition. Australian Journal of Crop Science, v. 8, n. 5, p. 666-673, 2014.
- NADAL, R. Olericultura em Santa Catarina: aspectos térmicos e econômicos. Florianópolis: Empasc, 1986.
- OMETTO, J. C. Bioclimatologia vegetal São Paulo: Agronômica Ceres, 1981.
- ORTEGA, J. K. E. Theoretical analyses of turgor pressure during stress relaxation and water uptake, and after changes in expansive growth rate when water uptake is normal and reduced. Plants, v. 12, n. 9, e1891, 2023.
- R CORE TEAM. R: a language and environment for statistical computing. Vienna: R Foundation for Statistical Computing, 2021.
- RAMOS, F. R.; FREIRE, A. L. O.; FRANÇA, G. M. Crescimento e acúmulo de biomassa em mudas de craibeira (Tabebuia aurea (manso) Benth. & Hook. F. ex S. Moore) sob estresse hídrico e adubação potássica. Agropecuária Científica no Semiárido, v. 16, n. 4, p. 213-221, 2020.
- SANTOS, H. G.; JACOMINE, P. K. T.; ANJOS, L. H. C. dos; OLIVEIRA, V. A. de; LUMBRERAS, J. F.; COELHO, M. R.; CUNHA, T. J. F. Sistema brasileiro de classificação de solos Brasília, DF: Embrapa, 2018.
- SCALON, S. P. Q.; MUSSURY, R. M.; EUZÉBIO, V. L. M.; KODAMA, F. M.; KISSMANN, C. Estresse hídrico no metabolismo e crescimento inicial de mudas de mutambo (Guazuma ulmifolia Lam.). Ciência Florestal, v. 22, n. 4, p. 655-662, 2011.
- SCHOLANDER, P. F.; BRADSTREET, D. E.; HEMMINGSEN, E. A.; HAMMEL, H. T. Sap pressure in vascular plants: negative hydrostatic pressure can be measured in plants. Science, v. 148, n. 3668, p. 339-346, 1965.
- SOUSA, R. F.; SOUSA, J. A. Metabólicos secundários associados a estresse hídrico e suas funções nos tecidos vegetais. Revista Brasileira de Gestão Ambiental, v. 11, n. 1, p. 1-8, 2017.
- TAIZ, L.; ZEIGER, E. Fisiologia vegetal 6. ed. Porto Alegre: Artmed, 2017.
- TEIXEIRA, P. C.; DONAGEMMA, G. K.; FONTANA, A.; TEIXEIRA, W. G. Manual de métodos de análise de solo Brasília, DF: Embrapa, 2017.
- TYREE, M. T.; JARVIS, P. G. Water in tissues and cells. In: LANGE, O. L.; NOBEL, P. S.; OSMOND, C. B.; ZIEGLER, H. (ed.). Encyclopedia of plant physiology Berlin: Springer-Verlag, 1982. p. 35-77.
- UNITED STATES DEPARTMENT OF AGRICULTURE (USDA). Soil Survey Staff. Keys to soil taxonomy 13. ed. Washington, DC: USDA, 2022.
- WESEMAEL, J. V.; KISSEL, E.; EYLAND, D.; LAWSON, T.; SWENNEN, R.; CARPENTIER, S. Using growth and transpiration phenotyping under controlled conditions to select water efficient banana genotypes. Frontiers in Plant Science, v. 10, e352, 2019.
- YU, B.; CHA, D.-Y.; ZHAO, Y. How plants sense and respond to osmotic stress. Journal of Integrative Plant Biology, v. 66, n. 3, p. 394-423, 2024.
-
Editor:
Luis Carlos Cunha Junior