 Machine learning for unmanned aerial vehicles-based soybean phenotyping: limits of cross-environment transfer and opportunities to reduce field measurements1
ABSTRACT
High-throughput phenotyping using unmanned aerial vehicles (UAVs) and spectral vegetation indices has been proposed to overcome the cost and logistical constraints of manual measurements in multi-environment breeding trials. However, the reliability of models trained on spectral data to predict structural traits across genotypes and environments remains unclear. This study aimed to develop an approach for predicting soybean plant height (PH) and first pod insertion height (FPIH) using UAV-based vegetation indices acquired at the flowering stage, as well as to compare extreme gradient boosting (XGBoost), multilayer perceptron (MLP), random forest (RF), and multiple linear regression (MLR) models under realistic cross-validation scenarios. Trials were conducted across multiple seasons using UAV multispectral imagery, with PH and FPIH manually measured. The models were evaluated under five phenotyping scenarios: baseline calibration using all data; prediction in a completely unmeasured future season; estimation of missing genotypes within a partially sampled season; calibration using a small fraction of data from a new season; and prediction under absence of field records for specific genotypes across environments. When all data were used for calibration, non-linear models showed a high apparent accuracy. However, prediction in unseen seasons failed for all models, reflecting strong genotype × environment interactions. Under reduced phenotyping within the same environment network, the models maintained a robust accuracy for PH, whereas FPIH predictions declined to moderate levels. UAV-based models are reliable for interpolation, but limited for extrapolation without local calibration, enabling reductions of up to 80 % in manual measurements for PH and 20-30 % for FPIH.
KEYWORDS:
Glycine max; multispectral remote sensing; canopy architecture.
RESUMO
A fenotipagem de alto rendimento com veículos aéreos não tripulados (VANTs) e índices espectrais de vegetação tem sido proposta para superar os custos e limitações logísticas de medições manuais em ensaios multiambientes. No entanto, ainda é incerta a confiabilidade de modelos baseados em dados espectrais para predizer características estruturais em genótipos e ambientes. Objetivou-se desenvolver uma abordagem para predição da altura de plantas (AP) e altura de inserção da primeira vagem (AIPV) em soja, utilizando-se índices de vegetação obtidos por VANT no estágio de florescimento, bem como comparar os modelos extreme gradient boosting (XGBoost), perceptron multicamadas (PMC), florestas aleatórias (FA) e regressão linear múltipla (RLM) sob cenários realistas de validação cruzada. Ensaios foram conduzidos ao longo de múltiplas safras, com imagens multiespectrais obtidas por VANT, sendo AP e AIPV mensuradas manualmente. Os modelos foram avaliados em cinco cenários: calibração com todos os dados; predição em uma safra futura completamente não avaliada; estimação de genótipos ausentes em uma safra parcialmente amostrada; calibração com pequena fração de dados de uma nova safra; e predição na ausência de registros de campo para genótipos específicos em múltiplos ambientes. Quando todos os dados foram utilizados na calibração, modelos não lineares apresentaram alta acurácia aparente. Entretanto, a predição em safras não observadas falhou para todos os modelos, refletindo em fortes interações genótipo × ambiente. Sob redução de fenotipagem no mesmo conjunto de ambientes, a acurácia para AP permaneceu robusta, enquanto para AIPV foi moderada. Modelos baseados em VANT são confiáveis para interpolação, mas limitados para extrapolação sem calibração local, permitindo reduzir medições manuais em até 80 % para AP e 20-30 % para AIPV.
PALAVRAS-CHAVE:
Glycine max; sensoriamento remoto multiespectral; arquitetura do dossel.
INTRODUCTION
Soybean breeding [Glycine max (L.) Merr.] faces the ongoing challenge of developing cultivars with higher yield, greater resilience to biotic and abiotic stresses, and adaptability to diverse environmental conditions (Battisti et al. 2017, Fodor et al. 2017). In this scenario, accelerating genetic gain to meet these demands depends on the ability to accurately evaluate a large number of genotypes, a process traditionally constrained by the cost, time, and labor-intensive nature of manual phenotyping (Xie & Yang 2020, Yang et al. 2020).
High-throughput phenotyping using platforms such as unmanned aerial vehicles (UAVs) equipped with multispectral sensors has emerged as a transformative technology to overcome these bottlenecks (Xie & Yang 2020, Yang et al. 2020). Through high-throughput phenotyping, it is possible to extract a wide range of vegetation indices that serve as proxies for physiological and agronomic traits, enabling rapid and large-scale assessment of plant canopies (Gill et al. 2022, Tayade et al. 2022). Indices such as the normalized difference vegetation index are sensitive to green biomass (Xue & Su 2017), whereas others, such as the normalized difference red edge and the simplified canopy chlorophyll content index, are more closely correlated with chlorophyll content and plant nitrogen status (Li et al. 2014, Sumner et al. 2021).
The transition to high-throughput phenotyping, however, generates datasets with high dimensionality and complexity, requiring more advanced analytical methods than traditional statistical approaches. Machine learning has therefore become an indispensable tool in this context, offering algorithms capable of modeling the complex, nonlinear relationships between spectral data and target phenotypic traits. Algorithms such as artificial neural networks, particularly the multilayer perceptron (MLP) architecture, ensemble tree-based methods such as random forest (RF), and gradient boosting frameworks such as extreme gradient boosting (XGBoost) have been widely applied to predict traits such as yield, plant height, and stress tolerance (van Klompenburg et al. 2020). Among these methods, XGBoost is particularly well suited to such tasks. By implementing a regularized gradient boosting approach over decision trees, it combines high predictive accuracy with computational efficiency and the ability to handle the complex feature interactions typical of high-throughput phenotyping data (Chen & Guestrin 2016).
Despite their potential, machine learning models in plant breeding studies are often treated as “black boxes,” with little justification for the choice of model architecture or hyperparameters. The topology of an MLP network, including the number of hidden layers and neurons, as well as its training parameters have a major influence on the model’s ability to learn and generalize from the data (Kruse et al. 2022, Worden et al. 2023). Similarly, the configuration of ensemble tree-based methods such as RF and XGBoost, including the number and depth of trees, learning rate, and regularization parameters, strongly affects model performance and the risk of overfitting (Chen & Guestrin 2016). This limited understanding and the lack of systematic optimization hinder the full potential of machine learning to consistently accelerate genetic gain.
Among the various morphological traits evaluated in soybean breeding programs, plant height and first pod insertion height are of paramount importance for both crop performance and management.
Plant height is a critical architectural trait directly associated with biomass accumulation, canopy closure, and weed competitiveness (Moreira et al. 2019). However, plant height must be carefully balanced. Sufficient height is required to maximize light interception and yield potential (Sreekanta et al. 2024), whereas excessive height increases the crop’s susceptibility to lodging, which can severely compromise grain development and harvest operations (Hwang & Lee 2019).
Equally important is first pod insertion height, a primary determinant of mechanical harvest efficiency. Cultivars with pods positioned too close to the soil surface suffer significant harvesting losses, as the combine harvester’s cutter bar cannot reach them without collecting soil and debris (Kang et al. 2017, Kuzbakova et al. 2022). Selecting genotypes with an optimal first pod insertion height minimizes grain loss and improves operational efficiency.
Despite their clear agronomic relevance, evaluating these traits manually across thousands of plots remains highly labor-intensive, making them ideal candidates for high-throughput phenotyping-based predictive modeling. However, a major unresolved challenge in applying predictive models to breeding programs is their cross-environment transferability. Because canopy architecture and its spectral signatures are strongly influenced by seasonal variation (Singh-Bakala et al. 2025), a model that behaves as a poorly calibrated “black box” in one growing season may overfit local conditions and fail to generalize to new environments. Understanding the conditions under which these models can reliably extrapolate predictions across seasons remains, therefore, a critical knowledge gap.
In this context, this study aimed to provide a practical approach for evaluating soybean morphological traits, specifically plant height and first pod insertion height, using high-throughput phenotyping based on vegetation indices derived from UAV multispectral imagery across multi-environment trials; and to compare the performance of four predictive models: XGBoost, MLP, RF, and multiple linear regression (MLR). These algorithms were selected to represent a gradient of modeling complexity: MLR as the traditional, highly interpretable statistical baseline; RF and XGBoost as robust tree-based ensemble methods; and MLP as a deep learning architecture. By evaluating these methods under realistic cross-validation schemes, the aim was to determine their potential and reliability for reducing field phenotyping across different environments.
MATERIAL AND METHODS
Experiments were conducted at the experimental field of the Universidade Federal de Mato Grosso do Sul, in Chapadão do Sul, Mato Grosso do Sul state, Brazil (18º46′26″S, 52º37′28″W, and altitude of 810 m), using a conventional soil preparation system.
The same 32 soybean genotypes were evaluated in a randomized complete block design with four replications over three growing seasons: 2019/2020, 2020/2021, and 2021/2022, totaling 384 experimental plots (n = 384). Each growing season was considered a distinct environment. Experimental plots consisted of 3-m rows spaced 0.45 m apart, with a plant density of 15 plants m-1. The evaluated agronomic traits were: first pod insertion height (cm) and plant height (cm). These traits were measured on five randomly selected plants per plot using a measuring tape, and the mean value of the five plants was calculated to represent the agronomic response of the entire plot for subsequent analyses.
Spectral data were collected during the full flowering stage (R2). A fixed-wing UAV (SenseFly eBee RTK), equipped with a SenseFly Sequoia multispectral sensor and operating with a fixed base station, was used to acquire images in the green, red, red-edge, and near-infrared (NIR) spectral bands. Flights were conducted at approximately 09:00 a.m. (local time), at an altitude of 40 m, with 80 % forward overlap and 75 % side overlap, resulting in a ground sampling distance of approximately 7 cm. The UAV navigation was supported by RTK technology, providing positioning accuracy of up to 2.5 cm. Image processing was performed using the PIX4Dmapper software, where radiometric calibration and conversion of digital numbers to surface reflectance were applied to generate georeferenced orthomosaics for each trial (Figure 1). Seven vegetation indices (Table 1) were calculated from the orthomosaics, and the mean pixel value within each experimental plot was extracted to represent the spectral response of that plot. This whole-plot spectral average was then paired with the average agronomic values obtained from the five sampled plants.

1) Experimental design in which 32 genotypes were evaluated in a randomized block design, with four blocks, across three growing seasons. The SenseFly eBee RTK was used for UAV data acquisition; 2) the following vegetation indices were extracted: normalized difference vegetation index (NDVI); soil-adjusted vegetation index (SAVI); modified soil-adjusted vegetation index (MSAVI); green normalized difference vegetation index (GNDVI); enhanced vegetation index (EVI); normalized difference red edge (NDRE); and simplified canopy chlorophyll content index (SCCCI); 3) extreme gradient boosting (XGBoost), multilayer perceptron (MLP), random forest (RF), and multiple linear regression (MLR) were used as predictive models for the target traits in a five-fold cross-validation framework; 4) the target traits were first pod insertion height and plant height.
Categorical variables (growing season, genotype, and block) were treated as factors, whereas all vegetation indices were handled as numerical covariates. All models were conducted in Python (version 3.12), using the libraries: pandas, numpy, scikit-learn, TensorFlow/Keras, SciKeras, and xgboost (Pedregosa et al. 2011, Abadi et al. 2015, Chollet 2015, Chen & Guestrin 2016, Harris et al. 2020).
Within each modeling pipeline, data preprocessing was performed to ensure that the models could effectively handle the multi-environment dataset. First, categorical predictors (growing seasons, genotypes, and blocks) were transformed into binary numerical variables using one-hot encoding, preventing the algorithms from assuming arbitrary ordinal relationships between categories. Subsequently, numerical predictors (vegetation indices) were standardized to zero mean and unit variance using a StandardScaler. This step prevented indices with larger numerical ranges from disproportionately influencing model weights, ensuring that all spectral features contributed equally during the training process. All preprocessing steps were integrated into the cross-validation pipelines using the scikit-learn library framework to prevent data leakage from the training sets into the evaluation sets. The transformed predictors were then passed to the regression algorithms (XGBoost, MLP, RF, or MLR). All vegetation indices were included in the training and validation procedures, and no dimensionality reduction was applied.
Four regression models were evaluated for predicting plant height and first pod insertion height from vegetation indices: XGBoost, MLP, RF, and MLR. Hyperparameter optimization was performed for the MLP and RF models using a randomized search strategy within a cross-validation framework. Five-fold cross-validation was used as the internal validation scheme for hyperparameter tuning. RandomizedSearchCV sampled ten random combinations of hyperparameters for each model, using the coefficient of determination (R2) as the optimization criterion.
For the MLP, the randomized search explored the following parameters: number of neurons in the first hidden layer (16, 32, or 64); number of neurons in a second hidden layer (0, 16, or 32; 0 = no second layer); activation function (ReLU or tanh); batch size (16 or 32); number of training epochs (50 or 100); optimizer (Adam or RMSprop); and learning rate (0.01 or 0.001).
For RF, the randomized search explored the number of trees (100 or 200), maximum number of features considered at each split (sqrt or log2), maximum tree depth (10, 20, or unlimited), and minimum number of samples required to split an internal node (2 or 5).
XGBoost and MLR were used with their default configurations within the defined preprocessing pipelines. For each trait, the best hyperparameter combination (highest mean R2 across folds) was selected for MLP and RF and reused in the validation schemes subsequently described.
To assess predictive performance and robustness under different scenarios of data imbalance and extrapolation across growing seasons and genotypes, five validation strategies were implemented, as follows:
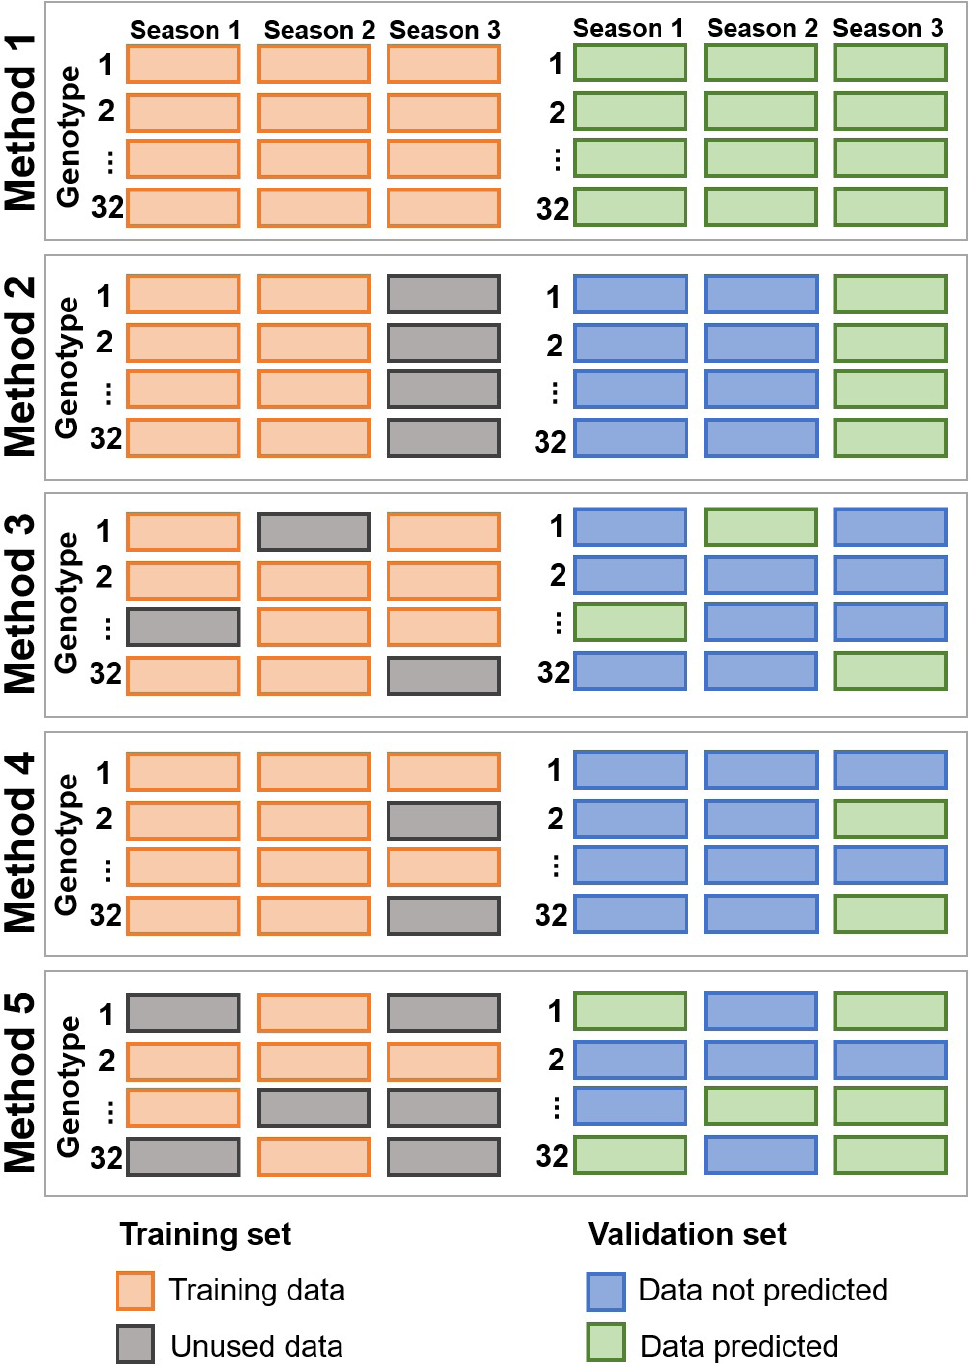
Method 1 (M1) - full training with season-wise evaluation: all available soybean records (N = 384 observations) were used to train each model (XGBoost, MLP, RF, and MLR) using the fully preprocessed dataset. After training, predictions were generated for all observations, and performance metrics were computed separately for each growing season (N = 128 observations per season). This strategy provides an estimate of the apparent predictive performance and season-specific fit when the model is trained on the complete dataset;
Method 2 (M2) - leave-one-season-out cross-validation: a leave-one-group-out scheme was employed, considering growing season as the grouping factor. In each fold, all observations from one season were held out as the test set (N = 128 observations), and the models were trained on the remaining seasons (N = 256 observations). This approach simulates prediction in a completely new season and evaluates the ability of the models to extrapolate across environments. Performance metrics were computed for each left-out season;
Method 3 (M3) - partial genotype removal (maximum of one removal per genotype): to simulate moderate imbalance in the representation of phenotyped genotypes across seasons, a resampling strategy was implemented, in which, for each scenario, a fixed proportion of genotypes per season was randomly removed from the dataset and used as a test set, under the constraint that each genotype could be removed at most once across all seasons. The evaluated proportions were 10 % (~3 removed genotypes per season; 348 training and 36 test observations), 15 % (~5 removed genotypes per season; 324 training and 60 test observations), and 20 % (~6 removed genotypes per season; 312 training and 72 test observations). Each genotype could be removed only once. For example, if genotype one was removed from season one, it could not be removed from season two and three. For each proportion and trait, 50 independent repetitions were performed using different random selections of genotypes. In each repetition, models were trained on the remaining data (training set) and evaluated on the removed genotype-season combinations (test set). Prediction metrics were averaged across repetitions for each proportion, yielding mean performance under moderate and controlled genotype imbalance;
Method 4 (M4) - partial inclusion of the target season in training: this strategy evaluates how much information from the target season is required in the training set to achieve accurate predictions for that same season. In each repetition, one season was randomly selected as the target season. A proportion of genotypes from this target season was randomly sampled and combined with all data from the other two seasons (N = 256 observations) to form the training set. The evaluated inclusion proportions and the resulting data splits were: 10 % (268 training and 116 test observations), 15 % (276 training and 108 test observations), 20 % (280 training and 104 test observations), 30 % (296 training and 88 test observations), 50 % (320 training and 64 test observations), and 80 % (360 training and 24 test observations). The test set consisted of the genotypes excluded from the training set for the target season. For each proportion and trait, 50 repetitions were performed using different random splits of the target season. This method quantifies the gain in predictive performance as the amount of target-season data used for calibration gradually increases;
Method 5 (M5) - strong genotype imbalance (maximum two removals per genotype): to simulate a severe lack of field-phenotyped information, an intensive imbalance scheme was implemented, considering both seasons and field replicates across the entire dataset. For each scenario, a proportion of the total 384 observations was randomly selected to form the test set. The evaluated removal proportions were: 20 % (307 training and 77 test observations), 30 % (269 training and 115 test observations), 50 % (192 training and 192 test observations), and 80 % (77 training and 307 test observations). A strict constraint was applied during this random sampling: no genotype could be completely eliminated from the training set. Specifically, each genotype could have all its records removed in at most two seasons, ensuring that at least one replicate of every genotype remained available for model training in at least one environment. For each proportion and trait, 50 repetitions were performed. This method stresses the models under strong imbalance conditions and repeated absence of field-phenotyped information for specific genotypes across environments.
Each strategy was applied independently to plant height and first pod insertion height (Figure 2). The complete dataset comprised 384 observations (32 genotypes × 4 blocks × 3 seasons).

Schematic representation of the training and validation methods. Method 1: full training with season-wise evaluation; method 2: leave-one-season-out cross-validation; method 3: partial genotype removal (maximum of one removal per genotype); method 4: partial inclusion of the target season in training; method 5: strong genotype imbalance (maximum two removals per genotype).
For each trait, model, validation strategy, and scenario, predictive performance was quantified using the mean absolute error (MAE), coefficient of determination (R2), and root mean square error (RMSE), calculated between observed and predicted values. These procedures and metric evaluations were implemented in Python (version 3.12), using the scikit-learn library (Pedregosa et al. 2011).
The metrics were calculated according to the following equations:
Mean absolute error (MAE):
Coefficient of determination (R2):
Root mean square error (RMSE):
where: yi is the actual observed value for the i-th observation; ŷi the predicted value for the i-th observation; ӯ the overall mean of the observed values; and n the total number of observations in the test set.
To evaluate the effects of genotype and environment on the studied traits, an analysis of variance (Anova) was performed using the R statistical software (version 4.5.2). The model considered genotype, season, and block within season as fixed effects, as well as the genotype x season interaction. The statistical model can be expressed as: Yijk = μ + Gi + Sj + Bk(j) + (GS)ij + ɛijk, where Yijk is the observed value of the trait for genotype i, in season j and block k, within season j; μ the overall mean; Gi the effect of genotype i; Sj the effect of season j; Bk(j) the effect of block k within season j; (GS)ij the genotype x season interaction; and ɛijk the experimental error.
To rigorously evaluate the statistical significance of performance differences among the predictive models (XGBoost, RF, MLP, and MLR), a pairwise Wilcoxon signed-rank test (Wilcoxon 1945, Demšar 2006) was applied to the absolute prediction errors. This non-parametric approach was selected because the residual errors of the machine learning algorithms did not assume a strict normal distribution. The test was conducted on the paired absolute errors generated by each model for the same test plots, strictly stratified by cross-validation methodology (M1 to M5) and phenotypic trait. Pairwise comparisons were performed at a significance level of 5 % (p < 0.05). Based on these tests, the models were statistically ranked and grouped, with models sharing the same letter indicating no significant difference in predictive accuracy within the respective scenario
RESULTS AND DISCUSSION
The analysis of variance (Anova) revealed highly significant effects (p < 0.01) for all sources of variation, genotype, season, block within season, and genotype × season interaction, for both plant height and first pod insertion height (Table 2). The significant main effects of genotype and season confirm the presence of substantial genetic variability among the evaluated soybean genotypes, as well as contrasting environmental conditions across the growing seasons. Notably, the significant genotype × season interaction indicates that the performance and architectural development of the genotypes were not consistent across seasons. This strong environmental influence and complex interaction underscore the inherent challenges in predicting these phenotypic traits across unseen environments, reinforcing the need for robust cross-validation strategies when deploying machine learning models based on remote sensing data.
Analysis of variance (Anova) for plant height and first pod insertion height, showing the effects of genotype, season, block within season, and genotype × season interaction, with their respective degrees of freedom (Df), sum of squares, mean squares, and F values.
Descriptive statistics further illustrate the magnitude of the environmental influence on canopy architecture (Table 3). The 2020/2021 season presented the highest means for both plant height (85.31 cm) and first pod insertion height (17.31 cm), as well as the highest maximum values, suggesting highly favorable environmental conditions for vegetative growth during that season. In contrast, the 2021/2022 season exhibited the lowest mean values, with plant height decreasing to 77.33 cm and first pod insertion height dropping sharply to 6.19 cm. This marked decrease in first pod insertion height is particularly noteworthy from an agronomic perspective, as pods inserted too close to the soil surface (e.g., minimum values ranging from 3.67 to 6.33 cm across seasons) substantially increase the risk of mechanical harvesting losses. Because human-induced variation was minimized through standardized field management, the generalized reduction observed in 2021/2022 likely reflects a severe environmental constraint that limited vegetative development and suppressed the genetic expression of the crop. The pronounced variation across seasons, especially for first pod insertion height, whose variance decrease from 27.50 in 2020/2021 to only 2.09 in 2021/2022, demonstrates the strong seasonal dependency of these morphological traits and the power influence of genotype x environment interactions. This naturally occurring environmental contrast provided a realistic testing scenario, highlighting the difficulty that algorithms face when attempting to extrapolate predictions without local calibration.
Descriptive statistics for plant height (PH) and first pod insertion height (FPIH) across the 2019/2020, 2020/2021, and 2021/2022 seasons, including variance, mean, minimum, and maximum values observed in each season.
The statistical ranking of the predictive algorithms, based on the pairwise Wilcoxon signed-rank test applied to their absolute errors (Table 4), systematically demonstrated the superiority of non-linear machine learning models over simple regression approaches when representative training data were available. For plant height, XGBoost consistently outperformed the other algorithms, achieving the highest accuracy rank (‘A’) across all five cross-validation methods (M1-M5). Random forest (RF) and multilayer perceptron (MLP) generally exhibited intermediate performance, whereas multiple linear regression (MLR) was frequently ranked lowest (‘D’). This consistent ranking highlights the advantage of flexible, tree-based ensemble algorithms in capturing the complex and often non-linear relationships between canopy reflectance indices and structural traits. A similar pattern was observed for first pod insertion height, in which XGBoost and RF shared the top rankings in most intra-environment prediction scenarios (M1, M3, M4, and M5).
Notably, in the extreme leave-one-season-out scenario (M2) for first pod insertion height, MLR achieved the lowest mean absolute error (rank ‘A’). This inversion in performance is characteristic of out-of-domain extrapolation. Highly complex algorithms such as MLP and ensemble models such as XGBoost are prone to overfitting and may generate highly inaccurate predictions when exposed to completely unseen data (van Klompenburg et al. 2020, Gill et al. 2022), which in this scenario corresponds to environmental conditions not represented in the training dataset. In contrast, the rigid structure of a linear model (MLR) constrains such extreme extrapolations, resulting in mathematically lower absolute errors, even though none of the models provide agronomically meaningful predictions under the M2 scenario. Overall, these statistical comparisons confirm that ensemble methods, particularly XGBoost, represent the most robust option for predicting soybean structural traits, provided that adequate local calibration data are available.
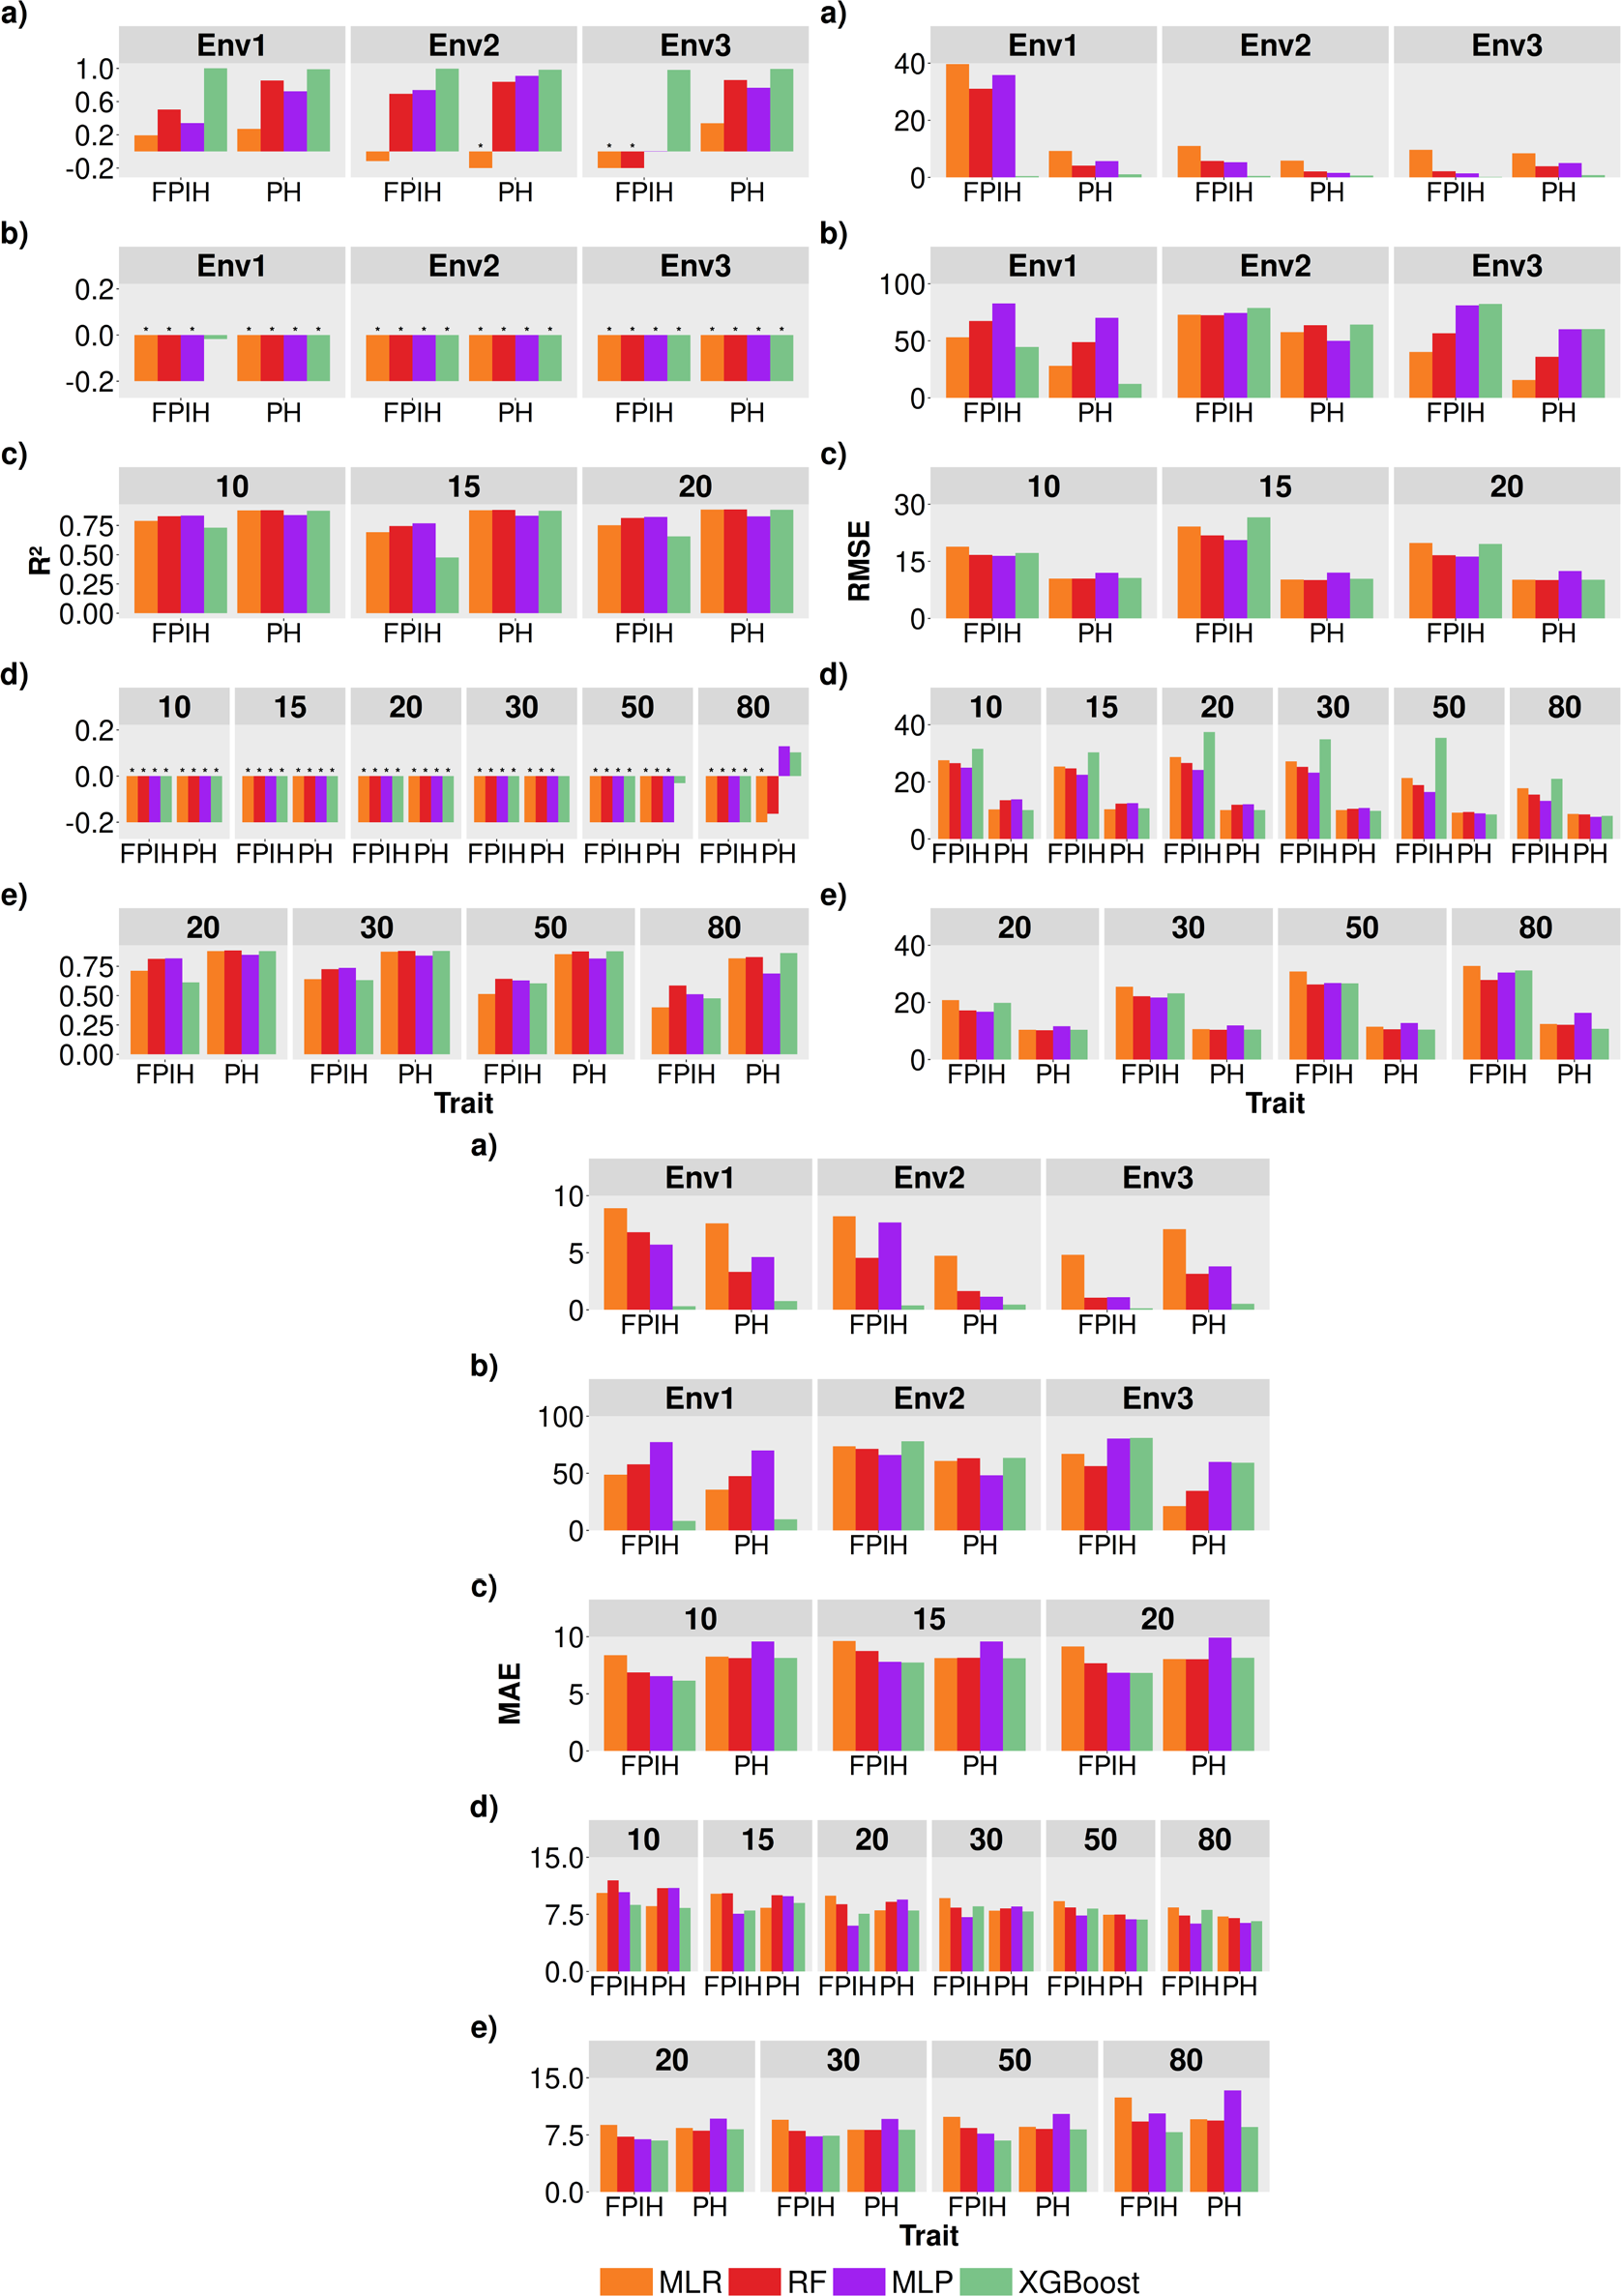
When all environments and genotypes were used simultaneously to fit M1 (Figure 3), predictive performance was outstanding for the non-linear machine learning models, particularly XGBoost, which achieved a mean R2 of 0.99 for both plant height and first pod insertion height, with remarkably low root mean square errors (RMSE) of 0.82 and 0.39 cm, respectively. Multilayer perceptron (MLP) and random forest (RF) also produced high predictive accuracies, whereas multiple linear regression (MLR) consistently showed a poorer performance (R2 = 0.11 and RMSE = 7.85 cm for plant height). This divergence in algorithm behavior highlights the nature of the data: simple linear regressions fail to capture the complex, non-linear interactions between spectral reflectance and structural traits across diverse genotypes. In contrast, flexible tree-based ensemble methods and neural networks are able to capture most of the structural variance. Similar high apparent accuracies have been reported in studies that calibrated machine learning and deep learning models for soybean and other crops. For instance, Osco et al. (2020) evaluated multiple algorithms for maize and achieved a correlation (r) of 0.86 for plant height using RF. In soybean, Teodoro et al. (2021) compared deep learning and shallow learners, and reported correlations of up to 0.77 for plant height. Furthermore, Carneiro et al. (2022) applied artificial neural networks in soybean and reported coefficients of determination (R2) of 0.89 for plant height. The RMSE values of less than 1 cm obtained here for XGBoost indicate an extremely tight fit, corroborating that highly flexible algorithms can effectively capture the variance of structural traits when fitted and evaluated within similar environmental contexts.

a) Full training and season-wide validation (method 1) across environments; b) leave-one-season-out validation (method 2) across environments; c) partial genotype removal validation (method 3) with 10, 15, and 20 % of genotype removal; d) partial target season inclusion validation (method 4) with 10, 15, 20, 30, 50, and 80 % inclusion of the target season; e) validation method 5 under strong genotype imbalance with 20, 30, 50, and 80 % imbalance. MLR: multiple linear regression; RF: random forest; MLP: multilayer perceptron; XGBoost: extreme gradient boosting; MAE: mean absolute error; RMSE: root mean squared error; R2: coefficient of determination; Env1, Env2, and Env3: 2019/2020, 2020/2021, and 2021/2022 seasons, respectively. * Values lower than -0.2.
The strong performance observed in M1 is biologically coherent. Structural traits such as plant height and first pod insertion height are closely linked to canopy biomass and architecture at the time of image acquisition, and vegetation indices such as normalized difference vegetation index, enhanced vegetation index and red-edge-based vegetation indices are well-established proxies for green biomass and canopy status (Xue & Su 2017, Tayade et al. 2022). Moreover, the experimental conditions in this study resemble classical multi-environment trials with relatively homogeneous management within each season. Under these conditions, relationships between traits and spectral indices tend to be smooth and largely monotonic. In practice, tree ensembles and shallow neural networks have been widely and successfully applied to model crop traits and yields from spectral and phenotyping data (van Klompenburg et al. 2020, Gill et al. 2022). However, from a breeding perspective, M1 represents an optimistic scenario that closely resembles resubstitution: all genotype-environment combinations used for prediction were already observed in the field. The real challenge in crop phenomics is not reproducing measured values, but predicting unmeasured plots, while simultaneously reducing phenotyping costs.
The leave-one-season-out scheme (M2), in which one season was completely excluded from training and used exclusively for testing, showed a drastic reduction in predictive performance. For both plant height and first pod insertion height, R2 values approached zero or became negative, whereas RMSE and MAE increased substantially regardless of the algorithm. In other words, models that appeared nearly perfect under M1 essentially failed when asked to predict a season for which no calibration data were available.
This severe loss of accuracy occurs because the relationship between vegetation indices and structural traits is strongly environment-specific and driven by complex genotype × environment interactions. As demonstrated by the Anova and descriptive statistics, environmental variation across seasons drastically altered canopy development, with the average first pod insertion height decreasing from 17.31 cm (2020/2021) to only 6.19 cm (2021/2022). Environmental conditions modify canopy architecture and spectral responses in ways that cannot be captured simply by encoding season as a categorical variable. Studies applying high-throughput phenotyping in multi-environment contexts have consistently highlighted the importance of genotype x environment interactions for the expression of canopy traits and the limited transferability of predictive models across environments (Rutkoski et al. 2016, Araus et al. 2018, Yang et al. 2020). For example, Teodoro et al. (2021) showed that predictive performance for soybean traits based on multispectral data varied across sites and seasons, highlighting the challenges of modeling across diverse environments. The results obtained under M2 are consistent with this evidence: even highly flexible algorithms such as XGBoost and MLP are unable to reconstruct the trait-index relationship in a completely new season without any local calibration data.
Methodologically, this finding highlights the limitations of cross-validation schemes based solely on random splits within environments (as in M1). Such approaches tend to overestimate predictive ability and mask the true difficulty of generalizing models across seasons, a concern also emphasized in recent reviews on machine learning and high-throughput phenotyping in agriculture (van Klompenburg et al. 2020, Gill et al. 2022).
Method 3 was designed to simulate a moderate reduction in field phenotyping within each season, by removing 10-20 % of the genotypes per environment under the constraint that each genotype could be absent from at most one season. Under this local scenario, predictive metrics differed considerably between the two traits. For plant height, coefficients of determination (R2) remained relatively high (ranging from 0.83 to 0.88), with RMSE between 10.22 and 12.15 cm. However, for first pod insertion height, the predictive ability decreased to moderate levels, with R2 values ranging from 0.62 to 0.81 and RMSE increasing from 17.76 to 21.13 cm. While plant height predictions remained relatively robust, the moderate accuracy obtained for first pod insertion height highlights the persistent challenge of indirectly estimating lower-canopy traits. Despite this reduction in accuracy for first pod insertion height, the performance differences among XGBoost, MLP, RF, and MLR remained small under this scenario.
The similar performance of all models, including MLR under M3, indicates that, once each environment is represented in the calibration set and only a fraction of genotype-environment combinations is missing, the trait-index relationship effectively behaves as a low-complexity function within the space defined by the vegetation indices and categorical factors.
From a practical standpoint, M3 corresponds to a scenario in which breeders deliberately avoid phenotyping a subset of plots in each environment and use model predictions to recover their plant height and first pod insertion height values. The obtained predictive metrics suggest that this strategy is highly feasible for plant height, where the models demonstrated robust accuracy and relatively low prediction errors. However, the moderate R2 and higher RMSE observed for first pod insertion height indicate that recovering this trait from spectral vegetation indices is more challenging, and, beyond a certain proportion of unmeasured genotypes, may not provide the precision required for rigorous fine-scale selection. Despite the limitations associated with lower-canopy traits, this interpretation aligns with the broader role of high-throughput phenotyping as a tool to increase phenotyping intensity while reducing the number of plots that require manual measurements, as proposed by Araus et al. (2018) and demonstrated by Rutkoski et al. (2016) for genomic selection augmented by canopy vegetation indices.
Method 4 evaluated whether including a fraction of the target season in the training set improves predictions for that same season when all historical seasons are also included. As the proportion of target-season data in the calibration set increased from 10 to 80 %, predictive metrics for plant height showed only a slight improvement (e.g., XGBoost RMSE decreased from 10.09 to 8.04 cm). However, R2 values remained close to zero or negative, failing to approach the high accuracies observed under M3 and M5. For first pod insertion height, predictive ability remained extremely poor across all inclusion levels, with strongly negative R2 values and uninformatively large errors (RMSE generally exceeding 13 cm), even when 80 % of the target season were included in the training set.
Two aspects of these results are noteworthy. First, when only a small fraction (≤ 30 %) of the target season is included in the training set, the large volume of historical data dominates the model fitting process. Under these conditions, the model tends to reproduce trait-index relationships learned from previous seasons, which, as demonstrated in M2, are not readily transferable due to strong genotype × environment interactions and shifts in canopy architecture. Similar concerns have been raised in multi-environment datasets, where authors emphasize that models calibrated on aggregated multi-environment data may fail to capture regionor environment-specific responses (Araus et al. 2018, Marcillo et al. 2021, Teodoro et al. 2021).
Second, even when 80 % of the target season were included in the training set, predictions for the remaining 20 % remained clearly inferior to those obtained under M3 and M5. This suggests that combining large volumes of heterogeneous historical data with a dominant, but not exclusive, target season may introduce conflicting signals in the trait-index relationship. Studies integrating phenomics with genomic selection have similarly reported that historical multi-environment data do not always improve predictions for new environments, particularly when background environmental conditions and canopy structures vary substantially (Rutkoski et al. 2016, Yang et al. 2020, Gill et al. 2022). The results obtained under M4, therefore, reinforce that, for plant height and especially first pod insertion height, historical seasons provide limited transferable information, and may even dilute the local signal required to properly calibrate predictions for the new season.
Method 5 simulated a more aggressive reduction in field phenotyping, allowing each genotype to remain unmeasured in up to two environments while progressively increasing the proportion of removed genotype-environment combinations from 20 to 80 %. Despite this strong imbalance, R2 values remained relatively high for both traits. For plant height, XGBoost, RF, and MLR values were 0.86, 0.82, 0.81, respectively, at 80 % of omission, and MLP values were only slightly lower (0.69). For first pod insertion height, predictions decreased with the removal proportion. At 20 % of removed genotype-environment combinations, R2 values ranged from 0.61 (XGBoost) to 0.81 (RF and MLP); whereas, at 80 %, the best result was 0.58 (RF).
The consistently lower predictive accuracy for first pod insertion height, if compared with plant height across validation schemes (e.g., higher RMSE and lower R2 under M3, M4, and M5), can largely be explained by the physical limitations of passive optical sensing. While plant height is a top-of-canopy structural trait that directly interacts with the sensor and influences surface reflectance, first pod insertion height is located in the lower third of the stem. Once the soybean canopy reaches closure, multispectral sensors capture the reflectance primarily from the uppermost leaf layers, frequently leading to spectral saturation (Groff et al. 2013, Zhu et al. 2025). As a result, predicting lower-canopy traits such as first pod insertion height becomes highly indirect. Rather than direct observation, these predictions rely on empirical correlations between top-canopy spectral responses and internal plant architecture (Groff et al. 2013, Farias et al. 2023). Therefore, atypical seasonal conditions, such as those observed during the 2021/2022 season, that alter this relationship, can degrade model performance for first pod insertion height more severely than for plant height.
These findings are particularly relevant, given the agronomic importance and environmental sensitivity of first pod insertion height. Kang et al. (2017) demonstrated that first pod height in soybean exhibits substantial genetic and environmental variation, and that inadequate values can increase harvesting losses. The ability to predict first pod insertion height with relatively good accuracy (R2 ~ 0.81) under 20 % of data removal suggests a practical opportunity to moderately reduce field phenotyping efforts without substantially compromising selection accuracy. Conversely, the poor performance observed at 80 % removal clearly defines the limits of this strategy, indicating that first pod insertion height requires a denser calibration set than plant height to maintain reliable predictions. While severe data reduction may be appropriate only for early-stage germplasm screening, maintaining a moderate proportion of phenotyped plots (e.g., 70-80 %) appears to be a viable strategy for optimizing field measurements.
Comparing M3 and M5 indicates that model choice is less critical than data structure for local prediction. Across both methods, all four algorithms delivered very similar predictive accuracy, particularly for plant height, with only small advantages for XGBoost or RF in some scenarios. This observation is consistent with recent reviews on high-throughput phenotyping and machine learning, which emphasize that data quality, experimental design, and adequate calibration coverage are often more important determinants of predictive performance than specific algorithm used (Gill et al. 2022).
Taken together, the five validation schemes demonstrate that the usefulness of UAV-based phenotyping for plant height and first pod insertion height depends critically on how and where the models are applied. When trained and evaluated within the same environments without proper cross-environment validation (M1), the models create an illusion of near-perfect predictive ability. However, when asked to extrapolate to a completely new season without local calibration data (M2), all algorithms fail, revealing a strong environment dependence of the trait-index relationship and limited transportability across seasons. These results are consistent with previous reports highlighting the importance of genotype x environment interactions in phenomic prediction (Rutkoski et al. 2016, Araus et al. 2018). In contrast, when field phenotyping is strategically reduced while maintaining representation of each environment in the calibration set (M3 and M5), predictions for unmeasured plots remain highly accurate, even under substantial levels of missing data for plant height. This finding reinforces the role of high-throughput phenotyping as a tool to improve phenotyping efficiency rather than to fully replace field measurements (Yang et al. 2020, Gill et al. 2022).
Furthermore, relying exclusively on spectral vegetation indices presents inherent limitations for estimating fine-scale structural traits. Spectral vegetation indices are prone to saturation under high biomass conditions and primarily capture two-dimensional physiological information. In contrast, advanced three-dimensional phenotyping approaches, such as light detection and ranging (LiDAR) or high-resolution RGB imagery combined with structure from motion (SfM) photogrammetry, offer substantial advantages for extracting structural traits. LiDAR systems emit active laser pulses capable of penetrating the canopy through small gaps and generating multiple returns, allowing direct measurement of both bare earth elevation and the internal vertical structure of plants (Lefsky et al. 2002). This capability could substantially improve the estimation of traits such as first pod insertion height (Yang et al. 2017, Pun Magar et al. 2025). Although RGB-SfM approaches remain constrained by canopy closure in a manner similar to multispectral sensor (Pun Magar et al. 2025), they generate dense three-dimensional point clouds that capture crop surface geometry with much greater precision than spectral indices alone (Chu et al. 2018). Future studies seeking to improve the prediction of complex structural traits across diverse environments should therefore consider integrating LiDAR data or high-density three-dimensional geometric features to overcome the canopy-penetration limitations of passive spectral vegetation indices.
From a breeding-program perspective, these findings suggest that the most effective application of UAV-based vegetation indices for plant height and first pod insertion height is to interpolate missing phenotypes within the same network of environments rather than to extrapolate predictions to completely new seasonal conditions. Designing multi-environment trials so that each environment includes at least a subset of fully phenotyped genotypes, while strategically distributing unmeasured plots according to schemes similar to M3 and M5, can enable a substantial reduction in field phenotyping costs while preserving accurate selection for these key structural traits.
CONCLUSIONS
-
1. Unmanned aerial vehicles (UAV)-based multispectral imagery and vegetation indices provide a feasible approach for estimating soybean morphological traits in multi-environment trials. However, the accurate prediction of plant height (PH) and first pod insertion height (FPIH) depend on the availability of local calibration data, due to genotype × environment interactions;
-
2. The comparison among models indicated that non-linear approaches (extreme gradient boosting, random forest, and multilayer perceptron) generally performed better than multiple linear regression, although differences among models were dependent on the evaluation scenario;
-
3. Model performance was strongly influenced by the validation strategy. All models showed high apparent accuracy when trained and tested within the same dataset, but failed to predict reliably in completely unseen seasons;
-
4. Under scenarios simulating reduced phenotyping within the same environment network, models were able to estimate missing observations with acceptable accuracy, particularly for PH, whereas the performance for FPIH was lower;
-
5. The use of UAV-based models may reduce the need for manual phenotyping within multi-environment trials. Reductions of up to 80 % for PH and 20-30 % for FPIH were observed while maintaining acceptable levels of predictive accuracy.
Data Availability Statement:
Research data are only made available by authors upon request.
REFERENCES
-
ABADI, M.; AGARWAL, A.; BARHAM, P.; BREVDO, E.; CHEN, Z.; CITRO, C.; CORRADO, G. S.; DAVIS, A.; DEAN, J.; DEVIN, M.; GHEMAWAT, S.; GOODFELLOW, I.; HARP, A.; IRVING, G.; ISARD, M.; JIA, Y.; JOZEFOWICZ, R.; KAISER, L.; KUDLUR, M.; LEVENBERG, J.; MANÉ, D.; MONGA, R.; MOORE, S.; MURRAY, D.; OLAH, C.; SCHUSTER, M.; SHLENS, J.; STEINER, B.; SUTSKEVER, I.; TALWAR, K.; TUCKER, P.; VANHOUCKE, V.; VASUDEVAN, V.; VIÉGAS, F.; VINYALS, O.; WARDEN, P.; WATTENBERG, M.; WICKE, M.; YU, Y.; ZHENG, X. TensorFlow: large-scale machine learning on heterogeneous systems. 2015. Available at: https://www.tensorflow.org/ Access on: Apr. 09, 2026.
» https://www.tensorflow.org/ - ARAUS, J. L.; KEFAUVER, S. C.; ZAMAN-ALLAH, M.; OLSEN, M. S.; CAIRNS, J. E. Translating high-throughput phenotyping into genetic gain. Trends in Plant Science, v. 23, n. 5, p. 451-466, 2018.
- BATTISTI, R.; SENTELHAS, P. C.; BOOTE, K. J.; CÂMARA, G. M. S.; FARIAS, J. R. B.; BASSO, C. J. Assessment of soybean yield with altered water-related genetic improvement traits under climate change in southern Brazil. European Journal of Agronomy, v. 83, n. 1, p. 1-14, 2017.
- CARNEIRO, F. M.; OLIVEIRA, M. F. de; ALMEIDA, S. L. H. de; BRITO FILHO, A. L. de; FURLANI, C. E. A.; ROLIM, G. de S.; FERRAUDO, A. S.; SILVA, R. P. da. Biophysical characteristics of soybean estimated by remote sensing associated with artificial intelligence. Bioscience Journal, v. 38, e38024, 2022.
- CHEN, T.; GUESTRIN, C. XGBoost: a scalable tree boosting system. In: ACM SIGKDD INTERNATIONAL CONFERENCE ON KNOWLEDGE DISCOVERY AND DATA MINING, 22., 2016, San Francisco. Proceedings… New York: Association for Computing Machinery, 2016. p. 785-794.
-
CHOLLET, F. Keras 2015. Available at: https://keras.io Access on: Apr. 09, 2026.
» https://keras.io - CHU, T.; STAREK, M. J.; BREWER, M. J.; MURRAY, S. C.; PRUTER, L. S. Characterizing canopy height with UAS structure-from-motion photogrammetry-results analysis of a maize field trial with respect to multiple factors. Remote Sensing Letters, v. 9, n. 8, p. 753-762, 2018.
- DEMŠAR, J. Statistical comparisons of classifiers over multiple data sets. Journal of Machine Learning Research, v. 7, n. 1, p. 1-30, 2006.
- FARIAS, G. D.; BREMM, C.; BREDEMEIER, C.; MENEZES, J. L.; ALVES, L. A.; TIECHER, T.; MARTINS, A. P.; FIORAVANÇO, G. P.; SILVA, G. P.; CARVALHO, P. C. F. Normalized difference vegetation index (NDVI) for soybean biomass and nutrient uptake estimation in response to production systems and fertilization strategies. Frontiers in Sustainable Food Systems, v. 6, e959681, 2023.
- FODOR, N.; CHALLINOR, A.; DROUTSAS, I.; RAMIREZ-VILLEGAS, J.; ZABEL, F.; KOEHLER, A.-K.; FOYER, C. H. Integrating plant science and crop modeling: assessment of the impact of climate change on soybean and maize production. Plant and Cell Physiology, v. 58, n. 11, p. 1833-1847, 2017.
- GILL, T.; GILL, S. K.; SAINI, D. K.; CHOPRA, Y.; KOFF, J. P. de; SANDHU, K. S. A comprehensive review of high-throughput phenotyping and machine learning for plant stress phenotyping. Phenomics, v. 2, n. 3, p. 156-183, 2022.
- GITELSON, A. A.; KAUFMAN, Y. J.; MERZLYAK, M. N. Use of a green channel in remote sensing of global vegetation from EOS-MODIS. Remote Sensing of Environment, v. 58, n. 3, p. 289-298, 1996.
- GROFF, E. C.; NANNI, M. R.; POVH, F. P.; CEZAR, E. Características agronômicas associadas com índices de vegetação medidos por sensores ativos de dossel na cultura da soja. Semina: Ciências Agrárias, v. 34, n. 2, p. 517-526, 2013.
- HARRIS, C. R.; MILLMAN, K. J.; VAN DER WALT, S. J.; GOMMERS, R.; VIRTANEN, P.; COURNAPEAU, D.; WIESER, E.; TAYLOR, J.; BERG, S.; SMITH, N. J.; KERN, R.; PICUS, M.; HOYER, S.; VAN KERKWIJK, M. H.; BRETT, M.; HALDANE, A.; FERNÁNDEZ DEL RÍO, J.; WIEBE, M.; PETERSON, P.; GÉRARD-MARCHANT, P.; SHEPPARD, K.; REDDY, T.; WECKESSER, W.; ABBASI, H.; GOHLKE, C.; OLIPHANT, T. E. Array programming with NumPy. Nature, v. 585, n. 7825, p. 357-362, 2020.
- HWANG, S.; LEE, T. G. Integration of lodging resistance QTL in soybean. Scientific Reports, v. 9, e6540, 2019.
- KANG, B.; KIM, H.-T.; CHOI, M.; KOO, S.-C.; SEO, J.-H.; KIM, H. S.; SHIN, S.-O.; YUN, H.-T.; OH, I.-S.; KULKARNI, K. P.; LEE, J.-D. Genetic and environmental variation of first pod height in soybean (Glycine max (L.) Merr.). Plant Breeding and Biotechnology, v. 5, n. 1, p. 36-44, 2017.
- KRUSE, R.; BORGELT, C.; BRAUNE, C.; MOSTAGHIM, S.; STEINBRECHER, M. Computational intelligence Cham: Springer, 2022.
- KUZBAKOVA, M.; TURUSPEKOV, Y.; ABUGALIEVA, S. Genetics and breeding of pod height in legumes. Frontiers in Plant Science, v. 13, e948099, 2022.
- LEFSKY, M. A.; COHEN, W. B.; PARKER, G. G.; HARDING, D. J. Lidar remote sensing for ecosystem studies. BioScience, v. 52, n. 1, p. 19-30, 2002.
- LI, F.; MIAO, Y.; FENG, G.; YUAN, F.; YUE, S.; GAO, X.; LIU, Y.; LIU, B.; USTIN, S. L.; CHEN, X. Improving estimation of summer maize nitrogen status with red edge-based spectral vegetation indices. Field Crops Research, v. 157, n. 1, p. 111-123, 2014.
- LIU, H. Q.; HUETE, A. A feedback-based modification of the NDVI to minimize canopy background and atmospheric noise. IEEE Transactions on Geoscience and Remote Sensing, v. 33, n. 2, p. 457-465, 1995.
- MARCILLO, G. S.; MARTIN, N. F.; DIERS, B. W.; SANTOS, M. da F.; LELES, E. P.; CHIGEZA, G.; FRANCISCHINI, J. H. Implementation of a generalized additive model (GAM) for soybean maturity prediction in African environments. Agronomy, v. 11, e1043, 2021.
- MOREIRA, F. F.; HEARST, A. A.; CHERKAUER, K. A.; RAINEY, K. M. Improving the efficiency of soybean breeding with high-throughput canopy phenotyping. Plant Methods, v. 15, e139, 2019.
- OSCO, L. P.; MARCATO JUNIOR, J.; RAMOS, A. P. M.; FURUYA, D. E. G.; SANTANA, D. C.; TEODORO, L. P. R.; GONÇALVES, W. N.; BAIO, F. H. R.; PISTORI, H.; SILVA JUNIOR, C. A. da; TEODORO, P. E. Leaf nitrogen concentration and plant height prediction for maize using UAV-based multispectral imagery and machine learning techniques. Remote Sensing, v. 12, n. 19, e3237, 2020.
- PEDREGOSA, F.; VAROQUAUX, G.; GRAMFORT, A.; MICHEL, V.; THIRION, B.; GRISEL, O.; BLONDEL, M.; PRETTENHOFER, P.; WEISS, R.; DUBOURG, V.; VANDERPLAS, J.; PASSOS, A.; COURNAPEAU, D.; BRUCHER, M.; PERROT, M.; DUCHESNAY, E. Scikit-learn: machine learning in Python. Journal of Machine Learning Research, v. 12, n. 1, p. 2825-2830, 2011.
- PUN MAGAR, L.; SANDIFER, J.; KHATRI, D.; POUDEL, S.; KC, S.; GYAWALI, B.; GEBREMEDHIN, M.; CHILUWAL, A. Plant height measurement using UAV-based aerial RGB and LiDAR images in soybean. Frontiers in Plant Science, v. 16, e1488760, 2025.
- RUTKOSKI, J.; POLAND, J.; MONDAL, S.; AUTRIQUE, E.; GONZÁLEZ PÉREZ, L.; CROSSA, J.; REYNOLDS, M.; SINGH, R. Canopy temperature and vegetation indices from high-throughput phenotyping improve accuracy of pedigree and genomic selection for grain yield in wheat. G3: Genes|Genomes|Genetics, v. 6, n. 9, p. 2799-2808, 2016.
- SINGH-BAKALA, H.; RAVELOMBOLA, F.; WASHBURN, J. D.; SHANNON, G.; ZHANG, R.; LIN, F. Photosynthetic and canopy trait characterization in soybean (Glycine max L.) using chlorophyll fluorescence and UAV imaging. Agriculture, v. 15, n. 24, e2576, 2025.
- SREEKANTA, S.; HAANING, A.; DOBBELS, A.; O’NEILL, R.; HOFSTAD, A.; VIRDI, K.; KATAGIRI, F.; STUPAR, R. M.; MUEHLBAUER, G. J.; LORENZ, A. J. Variation in shoot architecture traits and their relationship to canopy coverage and light interception in soybean (Glycine max). BMC Plant Biology, v. 24, e194, 2024.
- SUMNER, Z.; VARCO, J. J.; DHILLON, J. S.; FOX, A. A. A.; CZARNECKI, J.; HENRY, W. B. Ground versus aerial canopy reflectance of corn: red-edge and non-red edge vegetation indices. Agronomy Journal, v. 113, n. 3, p. 2782-2797, 2021.
- TAYADE, R.; YOON, J.; LAY, L.; KHAN, A. L.; YOON, Y.; KIM, Y. Utilization of spectral indices for high-throughput phenotyping. Plants, v. 11, e1712, 2022.
- TEODORO, P. E.; TEODORO, L. P. R.; BAIO, F. H. R.; SILVA JUNIOR, C. A. da; SANTOS, R. G. dos; RAMOS, A. P. M.; PINHEIRO, M. M. F.; OSCO, L. P.; GONÇALVES, W. N.; CARNEIRO, A. M.; MARCATO JUNIOR, J.; PISTORI, H.; SHIRATSUCHI, L. S. Predicting days to maturity, plant height, and grain yield in soybean: a machine and deep learning approach using multispectral data. Remote Sensing, v. 13, e4632, 2021.
- VAN KLOMPENBURG, T.; KASSAHUN, A.; CATAL, C. Crop yield prediction using machine learning: a systematic literature review. Computers and Electronics in Agriculture, v. 177, e105709, 2020.
- WILCOXON, F. Individual comparisons by ranking methods. Biometrics Bulletin, v. 1, n. 6, p. 80-83, 1945.
- WORDEN, K.; TSIALIAMANIS, G.; CROSS, E. J.; ROGERS, T. J. Artificial neural networks. In: RABCZUK, T.; BATHE, K. J. (ed.). Machine learning in modeling and simulation: computational methods in engineering & the sciences. Cham: Springer, 2023. p. 85-119.
- XIE, C.; YANG, C. A review on plant high-throughput phenotyping traits using UAV-based sensors. Computers and Electronics in Agriculture, v. 178, e105731, 2020.
- XUE, J.; SU, B. Significant remote sensing vegetation indices: a review of developments and applications. Journal of Sensors, v. 2017, e1353691, 2017.
- YANG, G.; LIU, J.; ZHAO, C.; LI, Z.; HUANG, Y.; YU, H.; XU, B.; YANG, X.; ZHU, D.; ZHANG, X.; ZHANG, R.; FENG, H.; ZHAO, X.; LI, Z.; LI, H.; YANG, H. Unmanned aerial vehicle remote sensing for field-based crop phenotyping: current status and perspectives. Frontiers in Plant Science, v. 8, e1111, 2017.
- YANG, W.; FENG, H.; ZHANG, X.; ZHANG, J.; DOONAN, J. H.; BATCHELOR, W. D.; XIONG, L.; YAN, J. Crop phenomics and high-throughput phenotyping: past decades, current challenges, and future perspectives. Molecular Plant, v. 13, n. 2, p. 187-214, 2020.
- ZHAO, H.; LI, Y.; LIU, F. Monitoring monthly soil moisture conditions in China with temperature vegetation dryness indexes based on an enhanced vegetation index and normalized difference vegetation index. Theoretical and Applied Climatology, v. 143, n. 1-2, p. 159-176, 2021.
- ZHU, Y.; FAN, F.; ZHANG, Z.; YU, X.; JIANG, T.; LI, L.; LIU, Y.; BAI, Y.; TANG, Z.; LIU, S.; YIN, D.; JIN, X. How to better use canopy height in soybean biomass estimation. Agriculture, v. 15, e1024, 2025.
-
Editor:
Luis Carlos Cunha Junior