 Remote sensing assessment of drought effects on maize yields in Jequitinhonha Valley
Abstract
The objective of this work was to analyze agricultural drought using both precipitation data and the Vegetation Condition Index (VCI) based on remote sensing, to evaluate the effect of these conditions on maize yields in the semiarid region of Jequitinhonha Valley, Brazil, from 2001 to 2021. Pearson’s correlation assessed the relationships between precipitation, VCI anomalies, and corn yields. Remote sensing methods can be used to assess agricultural drought at the sub-regional scale in the Jequitinhonha Valley. The methods proposed by the present study allow for the identification of risk areas susceptible to agricultural drought. For future research, it is recommended that yield data be categorized in terms of water source, distinguishing between irrigated and rainfed crops.
Index terms:
agricultural drought; precipitation; spatial analysis; water scarcity
Resumo
O objetivo deste trabalho foi analisar a seca agrícola utilizando dados de precipitação e o Índice de Condição da Vegetação (ICV) com base em sensoriamento remoto, para avaliar o efeito dessas condições nas produtividades de milho na região semiárida do Vale do Jequitinhonha, Brasil, de 2001 a 2021. A correlação de Pearson avaliou as relações entre precipitação, anomalias do ICV e produtividades de milho. Os métodos de sensoriamento remoto podem ser utilizados para avaliar a seca agrícola na escala sub-regional no Vale do Jequitinhonha. Os métodos propostos por este estudo permitem a identificação de áreas de risco suscetíveis à seca agrícola. Para pesquisas futuras, recomenda-se que os dados de produtividade sejam categorizados em termos de fonte de água, distinguindo entre cultivos irrigados e de sequeiro.
Termos para indexação:
seca agrícola; precipitação; análise espacial; escassez hídrica
Introduction
Drought has severe and long-lasting impacts on the economy, food security, and agriculture (Silva et al., 2020; Shalishe et al., 2023; Chere & Debalke, 2024; Pacheco & Andrade, 2024; Liu et al., 2025). Global maize production has been severely affected by drought, leading to crop failures in the largest producing countries, such as the United States, China, and Brazil. For instance, in the Southwestern region of the United States, maize yield reduced 42.7% between 1979 and 2019, due to drought (Nguyen et al., 2023). Similarly, between 1961 and 2017, Northeastern China suffered 14% losses in maize yield attributable to severe drought (Wang et al., 2020).
Brazil is the third-largest maize producer in the world, contributing approximately 10% of global production in the 2023/2024 crop year (USDA, 2024). During this period, the country produced 115.7 million Mg of maize across a cultivated area of 21 million hectares. This output represented a yield reduction of 12% compared to previous crop year, primarily due to drought conditions (CONAB, 2024).
Rainfed agriculture constitutes one of the main sources of income in the Brazilian Semiarid region, where approximately 90% of agricultural production is managed by family farming (Rossato et al., 2017). Maize is one of the primary subsistence crops in this region, valued not only for to its high productivity but also because it serves as a primary food source for the local population and is essential as animal feed (Martins et al., 2018).
The Brazilian Semiarid region faces challenges in drought monitoring due to the uneven distribution and low density of weather stations. Furthermore, estimates based solely on ground sensors do not provide robust temporal data for accurate drought detection (Dutta et al., 2015; Santos et al., 2019). The high costs associated with collecting meteorological data also pose a barrier to obtaining high-quality data required for comprehensive drought assessment (Dutta et al., 2015; Santos et al., 2019). Consequently, the use of information based on orbital data is expanding due to its reduced costs, high reliability, greater temporal frequency, and availability (Aghakouchak et al., 2015; Dutta et al., 2015; Liang et al., 2016).
With research focusing on the Brazilian Semiarid region, Marengo et al. (2017) identified drought events in 2012 and 2015 using the Standardized Precipitation Index (SPI), while Zeri et al. (2018) used the Soil Moisture Index (SMI) to detect drought events in the same region in 2015 and 2016. However, continuous use of remote sensing is recommended to monitor climatic conditions and vegetation, allowing for early detection of droughts and, consequently, the adoption of preventive measures.
Among the various remote sensing indices, the Vegetation Condition Index (VCI), derived from the Normalized Difference Vegetation Index (NDVI), is widely used to monitor drought across different geographic regions (Kogan, 1995; Dutta et al., 2015; Ghafarian Malamiri et al., 2018; Kloos et al., 2021; Barbosa, 2023). The VCI can estimate the state of vegetation over long periods in extensive and heterogeneous areas that experience meteorological variations (Kogan, 1995; Du et al., 2013). The VCI based on data from the Moderate Resolution Imaging Spectroradiometer (MODIS) has shown strong performance and wide acceptance in assessing the onset, duration, and severity of drought (Kogan, 1995; Jiao et al., 2016; Winkler et al., 2017; Kloos et al., 2021; Xie & Fan, 2021).
The objective of this work was to analyze agricultural drought using both accumulated precipitation data and the Vegetation Condition Index (VCI) based on remote sensing, to evaluate the effect of these conditions on maize yields in the semiarid region of Jequitinhonha Valley, Brazil, from 2001 to 2021.
Materials and Methods
Jequitinhonha Valley, with a total area of 50,147 km² (IBGE, 2019), is located in the Southeast region of Brazil, specifically in the northeast of the state of Minas Gerais. Approximately 60% of its territory is part of the Brazilian Semiarid region, although the entire area experiences climatic variability and drought. Due to its climatic and topographic characteristics, the region is conventionally divided into three sub-regions: Alto, Médio, and Baixo Jequitinhonha (High, Middle, and Low Jequitinhonha). This territory comprises 51 municipalities and has a population of 668,279 inhabitants (IBGE, 2022).
The density of meteorological stations in the Jequitinhonha Valley is very low, covering only seven municipalities: Diamantina, Itamarandiba, Capelinha, Araçuaí, Itaobim, Pedra Azul, and Almenara (INMET, 2021), which account for 13% of the entire area. Precipitation varies across the region: the average annual precipitation reaches about 1,400 mm in the southern part of High Jequitinhonha, but decreases toward Middle and Low Jequitinhonha, where the annual mean drops to 600 mm. The rainy season occurs from October to March, with precipitation ranging from 200 mm in October to 160 mm in March. Conversely, the dry season spans from April to September, characterized by precipitation ranging from 75 mm in April to 65 mm in September (Alvares et al., 2013).
The topography of the Jequitinhonha Valley varies significantly. In the southern part of High Jequitinhonha, elevations reach considerable values, reaching up to 1,800 m, while in the northeastern part of Low Jequitinhonha, elevations are significantly lower, around 60 m. The average annual temperatures ranges from 18°C in the extreme south of High Jequitinhonha up to 24°C in the central part of Middle Jequitinhonha and in the northeastern part of Low Jequitinhonha (Alvares et al., 2013). The hottest month is generally February, with a mean temperature of 23°C in High Jequitinhonha and 24°C in Middle and Low Jequitinhonha. The coldest period differs slightly by region: in High Jequitinhonha, the coldest month is June, with a mean temperature of 18°C, while in Middle and Low Jequitinhonha, the coldest month is July, with a mean temperature of 19°C (Alvares et al., 2013). The predominant soils across all sub-regions are Argisols and Latosols (IBGE, 2019).
The main temporary crops cultivated in Jequitinhonha Valley are maize, beans, cassava, and sugarcane. In 2021, maize was the predominant crop, covering 16,997 hectares, which accounted for 46% of the total area dedicated to these four crops (IBGE, 2024). Beans occupied the second position with 11,022 hectares (33%), followed by cassava with 4,825 hectares (15%), and sugarcane with 4,093 hectares (11%). (IBGE, 2024).
The main planting season for maize occurs primarily from October to December (CONAB, 2022), coinciding with the onset of the rainy season and characterized by the highest maize yields in the region. Farmers utilize various management practices to maintain productivity, such as drought-resistant cultivars, irrigation systems, and crop rotation to improve soil fertility and reduce pest risks (Tigges et al., 2016).
Agricultural drought conditions in the Jequitinhonha Valley were assessed and correlated with maize yields over the period from 2001 to 2021 using precipitation data and the Vegetation Condition Index (VCI) derived from remote sensing. Due to the scarcity of terrestrial weather stations in Jequitinhonha Valley, the study relied on precipitation records from the Climate Hazards Group InfraRed Precipitation with Station data (CHIRPS). These records, available since 1982, are estimated from high-resolution satellite imagery with spatial resolution of 5 km. CHIRPS data have shown satisfactory performance and good applicability in drought studies across Brazilian regions (Paredes-Trejo et al., 2017; Nogueira et al., 2018). A precipitation dataset encompassing the maize growing season (October to December) was used, covering a total of 63 months. From these data, annual means were calculated for the 2001 to 2021 period.
To calculate the Vegetation Condition Index (VCI), data were sourced from the NDVI/MODIS product (MOD13Q1, version 6), which has a temporal resolution of 16 days and a spatial resolution of 250 m. A total of 105 NDVI products were collected. The mean annual VCI data were then calculated for the maize growing months of October to December, from 2001 to 2021.
Annual maize yield data spanning from 2001 to 2021 were obtained from the IBGE/SIDRA database (BGE, 2024). This information was available by geographical microregions. To calculate the yield data by the three sub-regions of the Jequitinhonha Valley, it was necessary to sum the annual yields of the microregions included in each sub-region: the microregions of Diamantina and Capelinha for High Jequitinhonha; the microregions of Araçuaí and Pedra Azul for Middle Jequitinhonha; and the microregion of Almenara for Low Jequitinhonha. All collected data were subsequently organized into spreadsheets to perform the statistical analysis.
The Vegetation Condition Index (VCI), developed by Kogan (1995), has been specifically applied to assess the effects of weather conditions on vegetation. It reflects plant health and offers advantages for comparison with crop yields (Kogan, 1995; Dutta et al., 2015). The VCI has been extensively used to monitor drought and vegetation conditions (Dutta et al., 2015; Winkler et al., 2017; Demisse et al., 2018). As demonstrated in the following equation (Kogan, 1995), the VCI normalizes the Normalized Difference Vegetation Index (NDVI) on a pixel-by-pixel basis, adjusting the values between the maximum and minimum NDVI recorded over a specific period (Liou and Mulualem, 2019). (1), where: VCI is Vegetation Condition Index; NDVI is mean Normalized Difference Vegetation Index; NDVImax is maximum NDVI in the long-term; and NDVImin is minimum NDVI in the long-term.
The Vegetation Condition Index (VCI) is expressed as a percentage ranging from 0 to 100%. It serves as an indicator of variations in vegetation condition, where values > 60% represent healthier vegetation, and values ≤ 60% indicate drought conditions (Liu & Kogan, 1996). For detailed drought classification, VCI values were grouped into five levels according to the established criteria: no drought (VCI > 60), mild drought (50 < VCI ≤ 60), moderate drought (35 ≤ VCI ≤ 50), severe drought (20 ≤ VCI ≤ 35), and extreme drought (VCI < 20) (Kogan, 1995; Bhuiyan & Kogan, 2010).
The Vegetation Condition Index anomaly (VCIA) is used to analyze variations in the VCI time series. It is calculated according to the equation by Fentaw et al. (2023): , where: VCIA is VCI anomaly; VCIi is VCI value in the “i” period; VCIav is mean VCI in the research period.
A positive VCIA denotes vegetative conditions above the long-term mean, indicating a wetter period or a period more conducive to plant growth. In contrast, a negative VCIA points to a VCI below the long-term mean, signaling drier or unfavorable conditions. This monitoring capability enables the rapid identification of both dry and rainy periods, which is essential for assessing plant health and detecting anomalous climatic patterns (Fentaw et al., 2023).
The data of the present study were first checked for outliers through inspection of the interquartile ranges. Subsequently, the data were submitted to assumptions checking of normality using Shapiro-Wilk’s test (α = 0.05), homoscedasticity using Breusch-Pagan’s test, linearity verified by visual inspection of dispersions, and independence of residuals using Durbin-Watson’s test. All necessary assumptions were met. Pearson’s correlation coefficient (r) at 5% significance level was then employed to verify the correlation between annual accumulated precipitation and annual maize yield, and between annual VCIA during the growing season (October to December) and the annual maize yield. These correlations were performed for the period of 2001 to 2021 across the three sub-regions of the Jequitinhonha Valley, utilizing the statistical software BioEstat (Ayres et al., 2007) for the analyses.
Results and Discussion
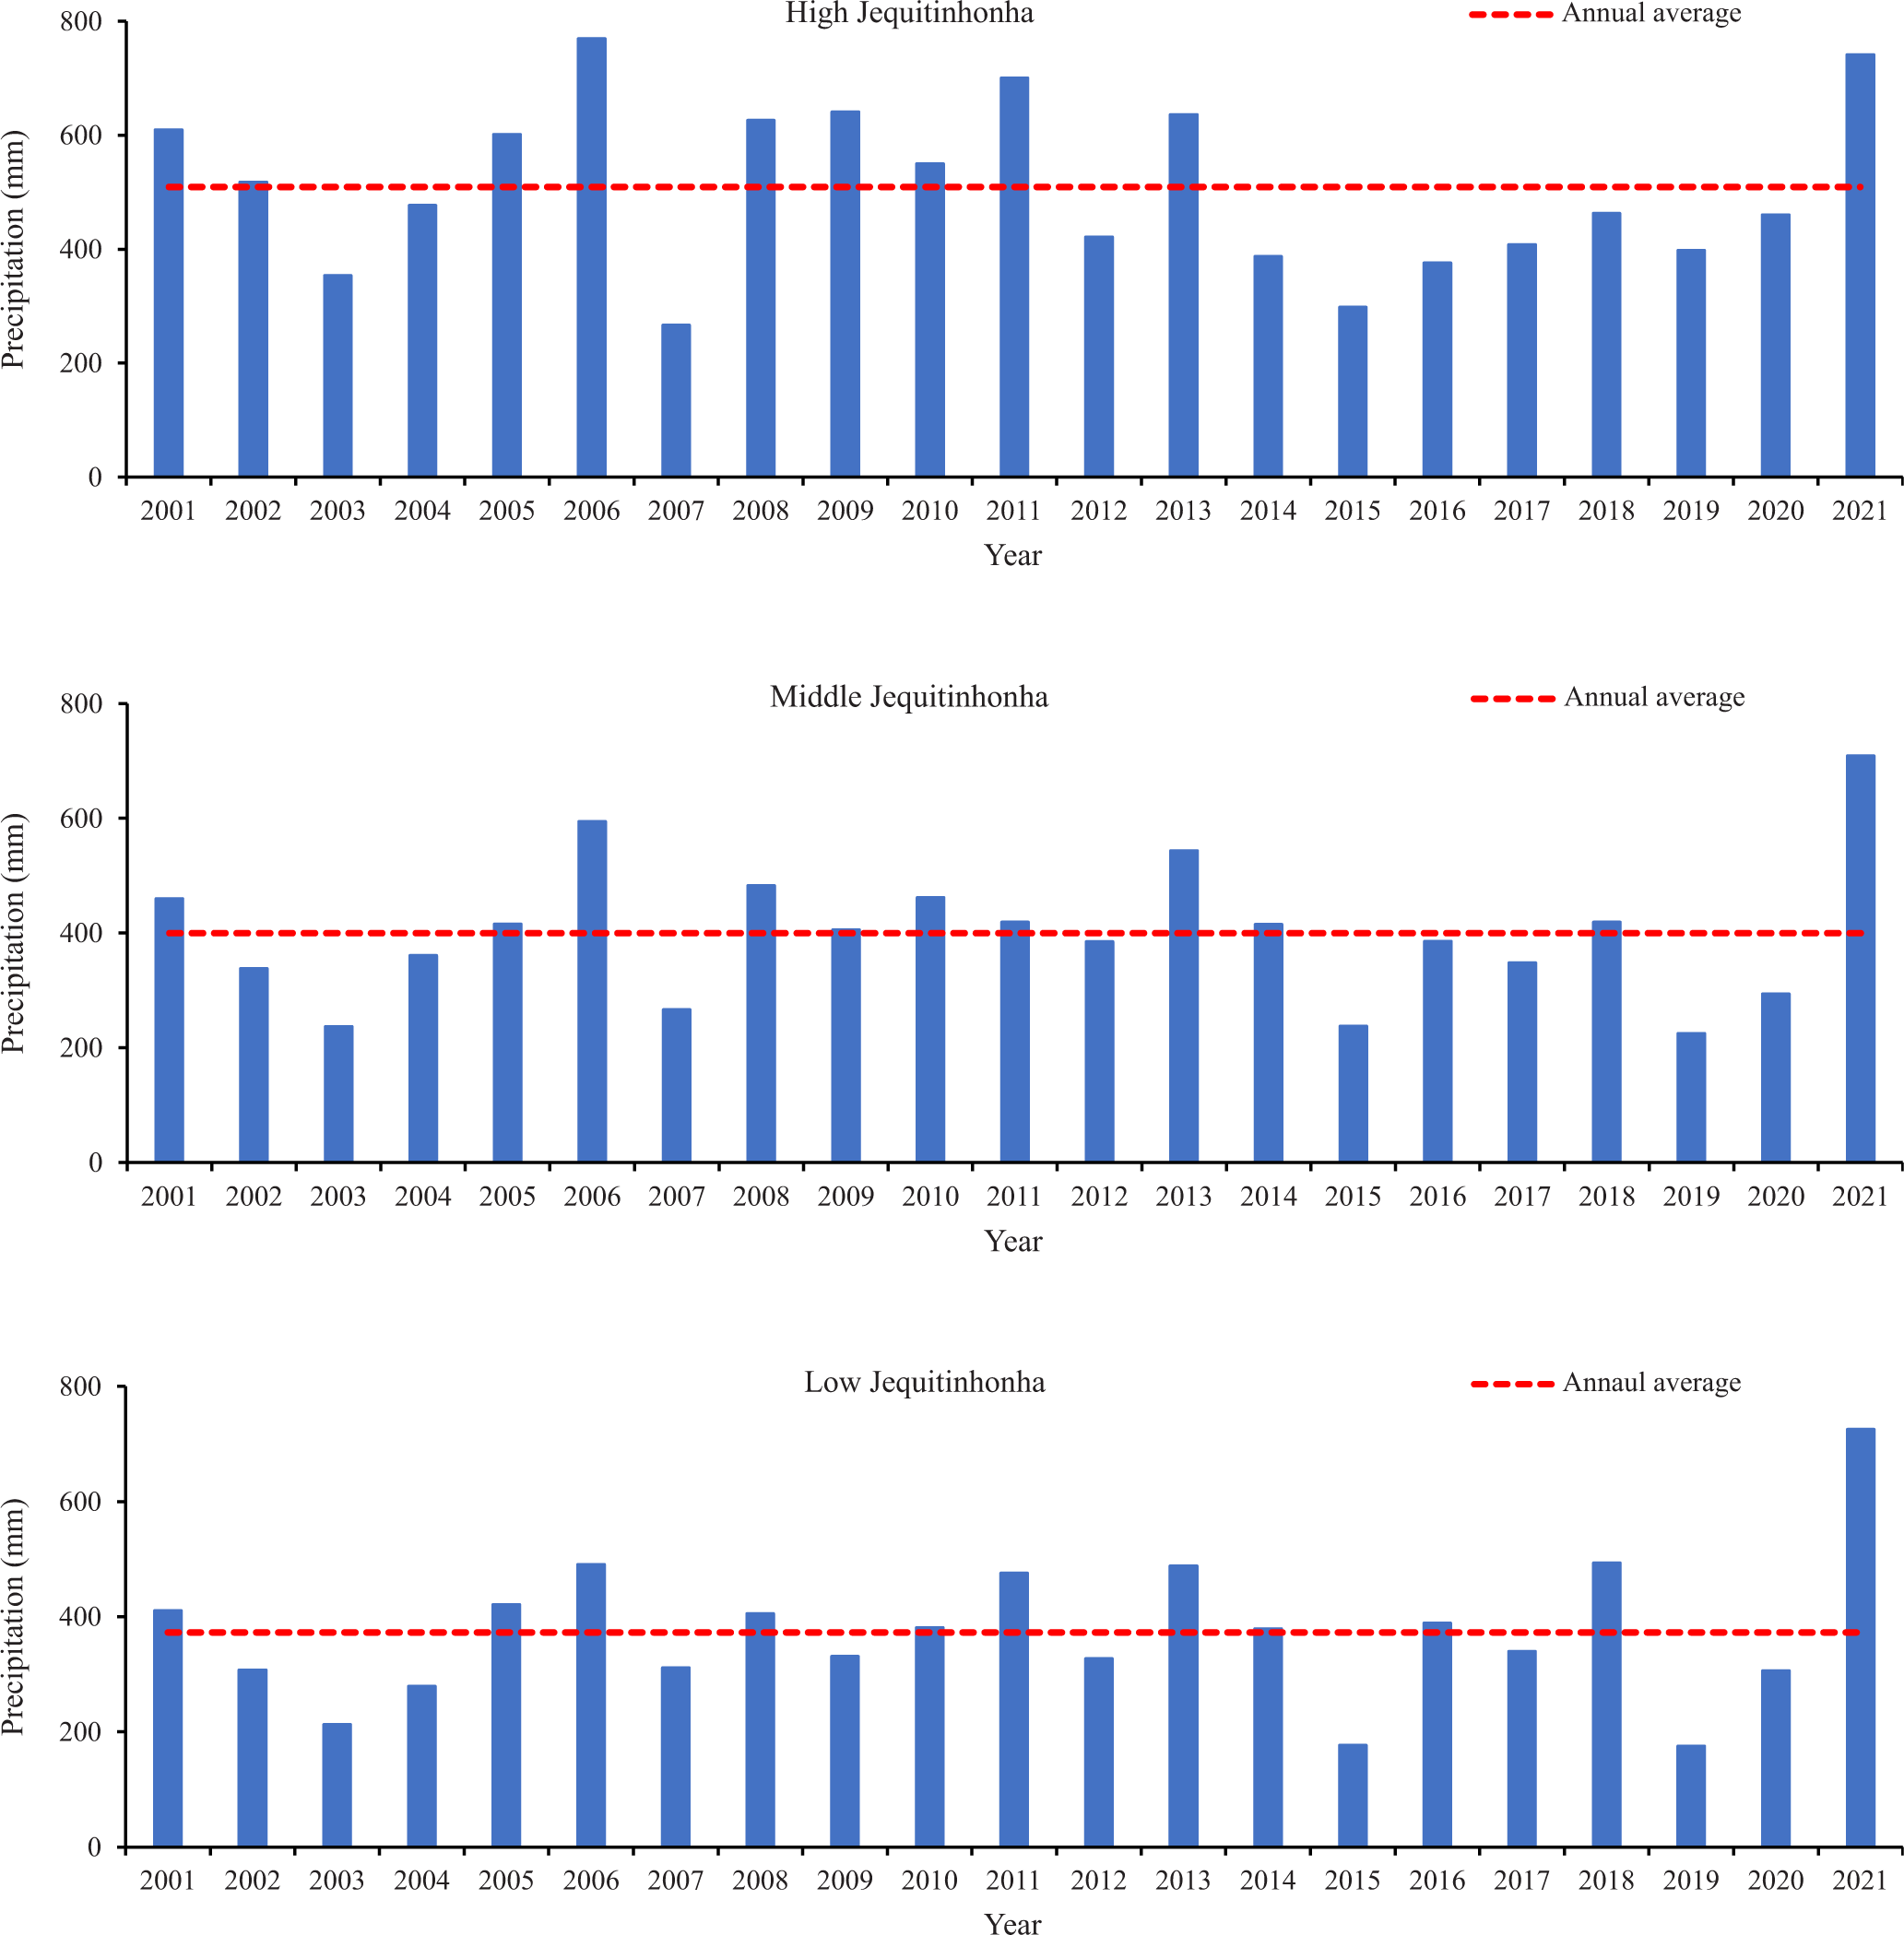
The analysis of annual accumulated precipitation data showed a gradient, with means decreasing from High Jequitinhonha to Low Jequitinhonha (Figure 1). In High Jequitinhonha, the mean annual precipitation of the studied period was 509.0 mm. The lowest recorded mean was 266.3 mm in 2007, and 11 years showed precipitation below-mean: 2003, 2004, 2007, 2012, and 2014–2020. In the Middle Jequitinhonha, the mean annual precipitation was 400.0 mm. The lowest precipitation, of 225.1 mm, was recorded in 2019, which was 44% lower than mean annual precipitation. This sub-region recorded ten years below average: 2002–2004, 2007, 2012, 2015–2017, 2019, and 2020. Finally, in Low Jequitinhonha, the mean annual precipitation was 372.0 mm. The year 2019 showed the lowest precipitation, at 175.2 mm, representing a significant drop of 53% below the mean. Ten years recorded below-mean precipitation: 2002–2004, 2007, 2009, 2012, 2015–2017, 2019, and 2020.
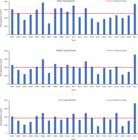
Mean annual accumulated precipitation (October to December) in the Jequitinhonha Valley sub-regions (high, middle, and low) from 2001 to 2021. The red dashed lines represent the long-term mean annual precipitation, from 2001 to 2021.
In the years when the annual precipitation fell below-mean in their respective sub-regions, and considering that water demands for maize is substantial, ranging between 400 mm to 700 mm during the growth cycle (Andrade et al., 2006), the maize yields were compromised. Water deficit in maize typically results in productivity reductions of 40% to 50%. Furthermore, if the deficit occurs during the early stages, yield losses can reach 20% to 30% (Andrade et al., 2006).
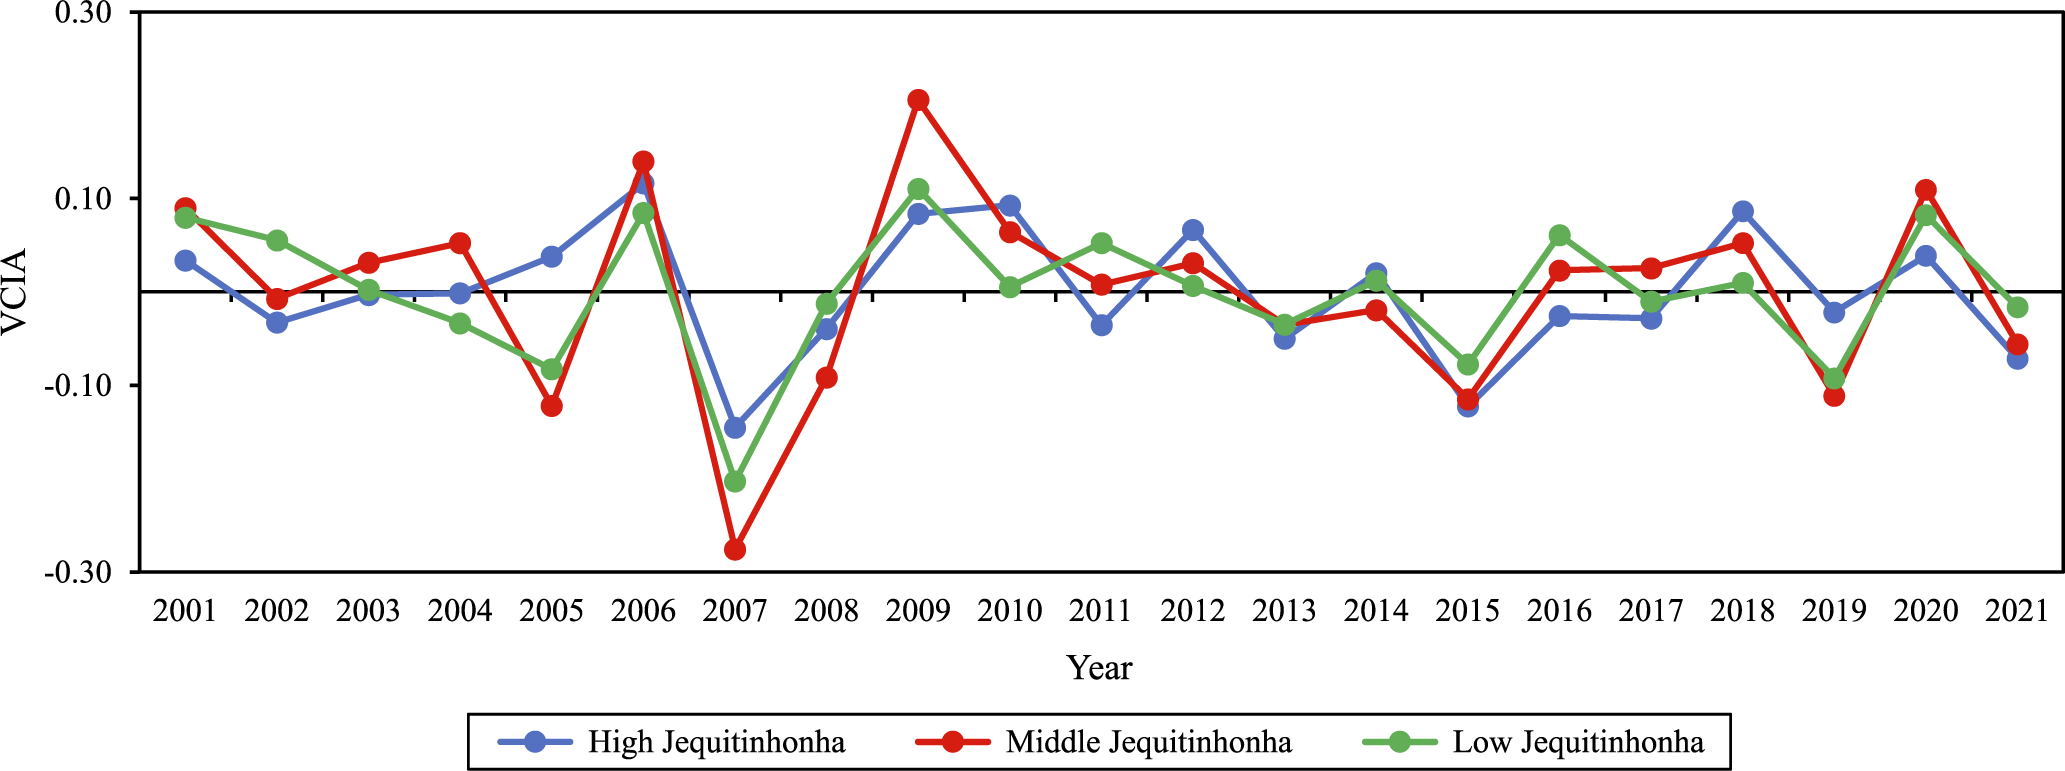
Vegetation Condition Index Anomaly (VCIA) data (Figure 2) revealed distinct periods of vegetative stress and vigor across the sub-regions. In High Jequitinhonha, VCIA ranged between +12%, in 2006, and -15%, in 2007, with the longest dry period and negative VCIA values observed from 2015 to 2017. Middle Jequitinhonha experienced the highest vegetative vigor in the studied period in 2009, with a VCIA of +21%, contrasting with the lowest recorded VCIA of -28% in 2007. Between 2013 and 2015, VCIA was negative, representing the longest dry period. In Low Jequitinhonha, the highest VCIA was 11% in 2009, while the lowest point occurred in 2007, reaching -20%. Consecutive dry years were recorded in 2004 and 2005, as well as in 2007 and 2008.
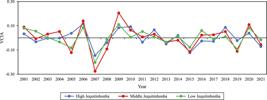
Annual Vegetation Condition Index anomalies (VCIA) for maize during the growing season (October to December) across the Jequitinhonha Valley sub-regions, from 2001 to 2021.
The frequent occurrence of negative VCIA values across all study sub-regions indicated that droughts are frequent phenomenon in Jequitinhonha Valley. The driest year was 2007. These climatic anomalies can be attributed to the influence of climatic phenomena such as El Niño, as previously observed by Vale et al. (2020). The findings of this study align with results obtained by other researchers (Marengo et al., 2017; Silva et al., 2020), who analyzed drought events using remote sensing data in other semiarid regions of Brazil.
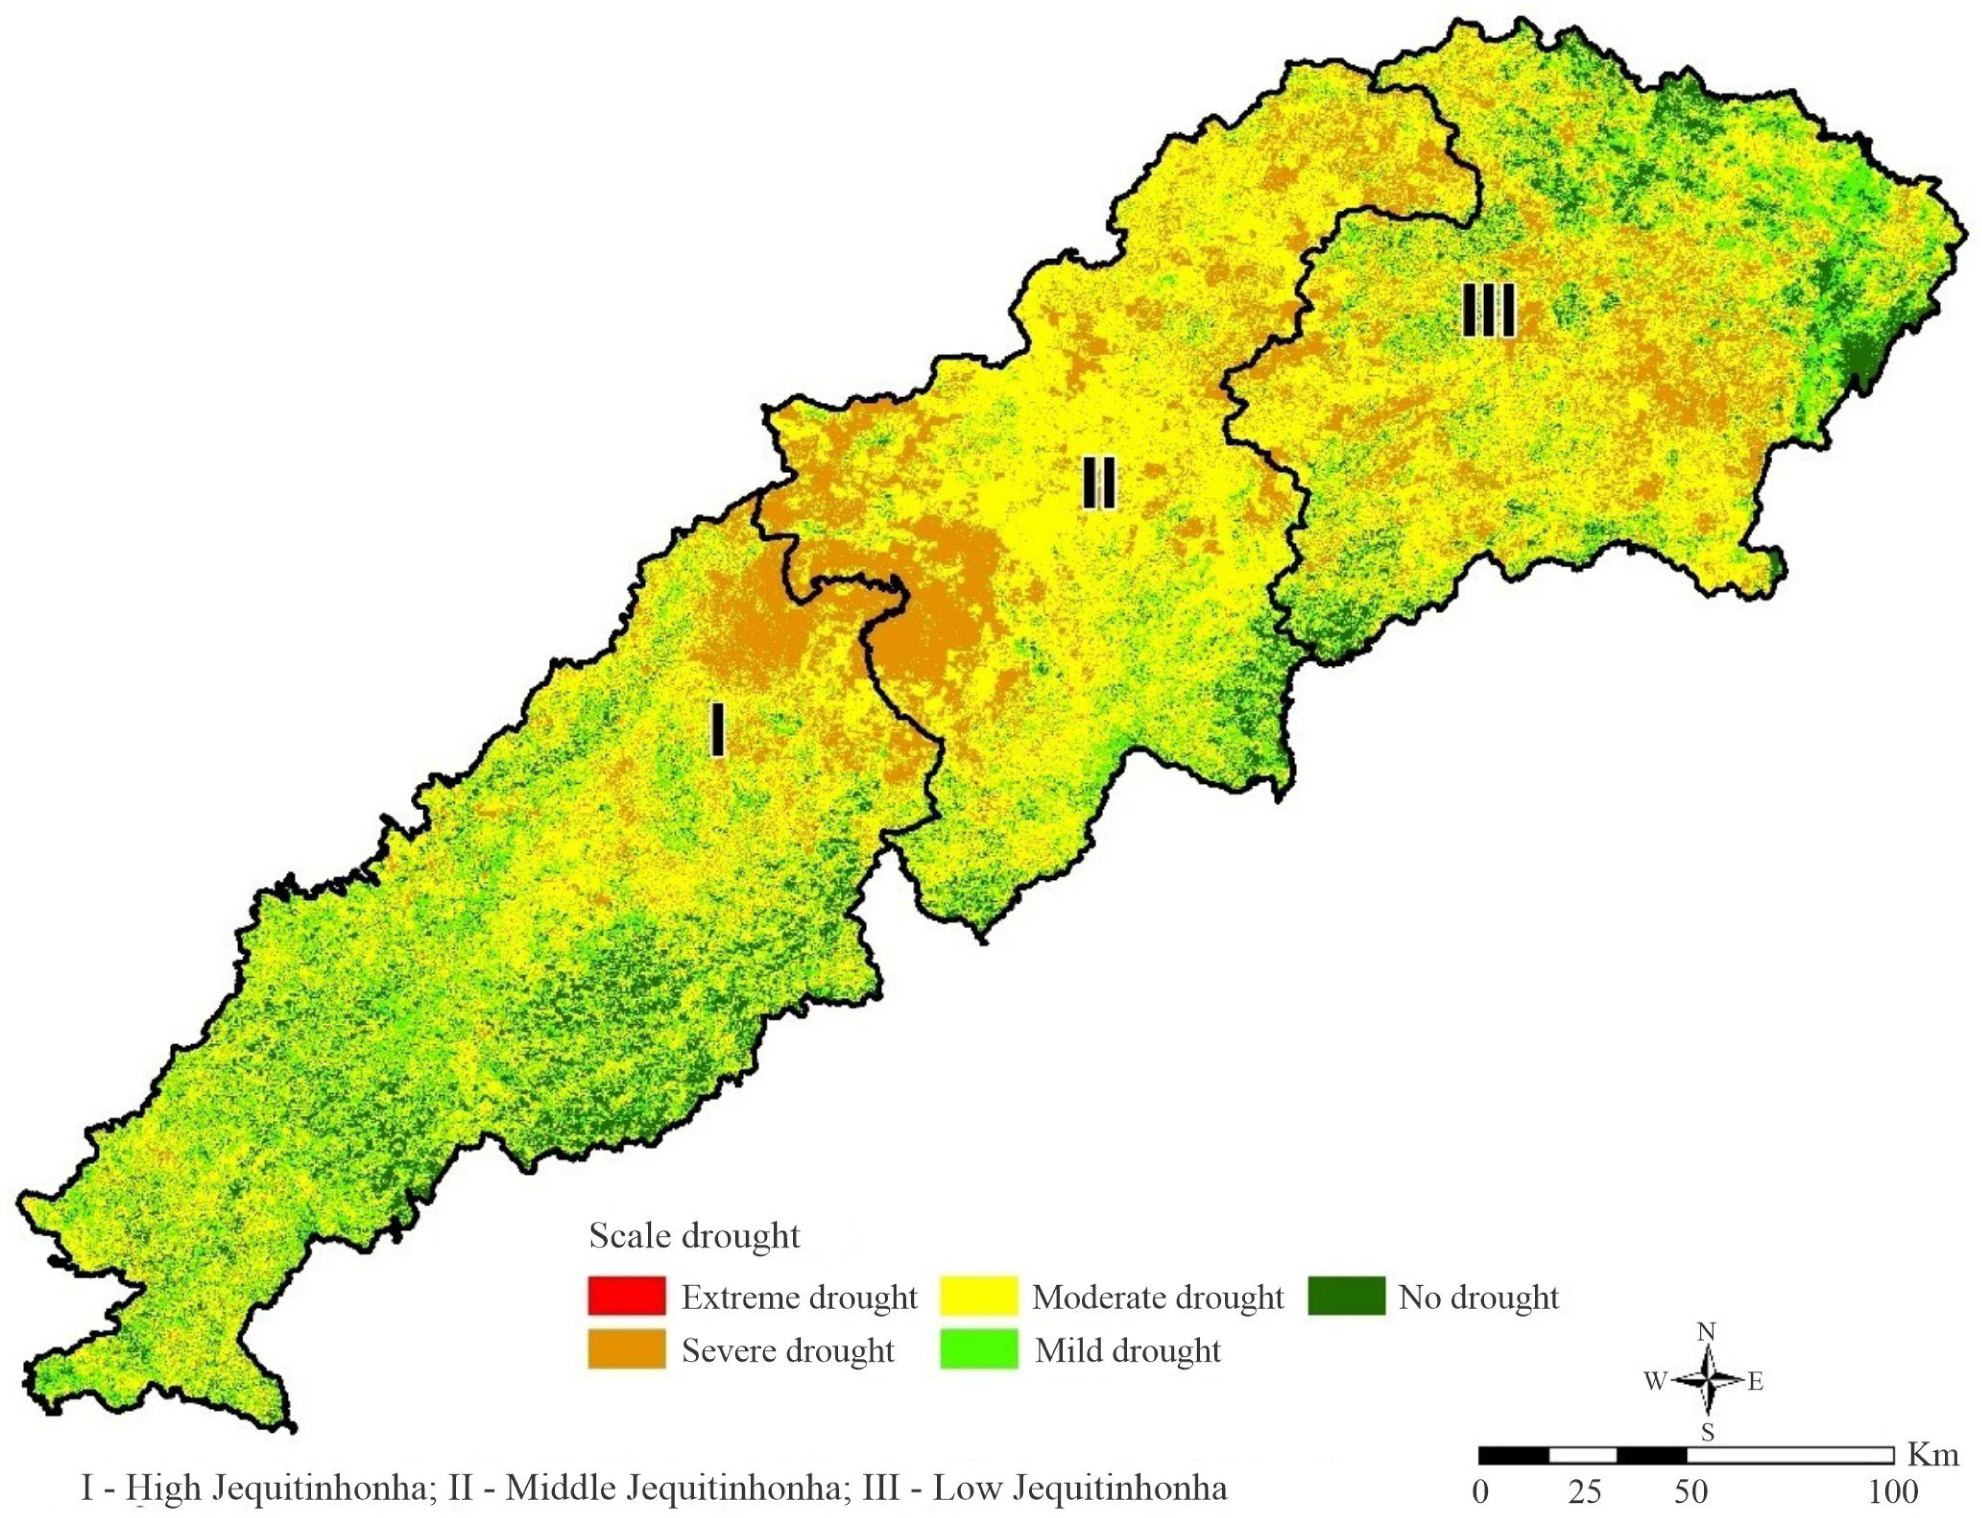
Given the precipitation data, the dry year of 2007 was selected to analyze the spatial pattern of agricultural drought using the Vegetation Condition Index (VCI) (Figure 3). The results show similar characteristics in precipitation volumes and vegetation vigor among the sub-regions of Jequitinhonha Valley. In 2007, the regions affected by drought covered approximately 85.15% of the area in High Jequitinhonha, 96.27% in Middle Jequitinhonha, and 89.62% in Low Jequitinhonha. Across all sub-regions, moderate-intensity drought was predominant and occupied the broadest spatial extent (Figure 3 and Table 1). In High Jequitinhonha, severe drought affected 13.36% of the area, while moderate drought covered 49.20%. In Middle Jequitinhonha, severe drought reached 26.81%, with moderate drought achieving the highest percentage, encompassing 61.30% of the area. In Low Jequitinhonha, severe drought comprised 21.31%, while moderate drought affected 52.21% of the area.
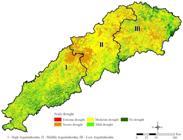
Spatial pattern of Vegetation Condition Index (VCI) across the Jequitinhonha Valley sub-regions during the maize growing season (October to December) in the dry year of 2007.
Percentage of area affected by agricultural drought intensity in the Jequitinhonha Valley sub-regions during 2007.
The findings of this study align with those of Cunha et al. (2019) who utilized the Integrated Drought Index (IDI) to analyze the period between 2011 and 2019. They also identified the occurrence of mild and moderate droughts in the Brazilian Semiarid region, similarly associating these drought events with the El Niño climatic phenomenon.
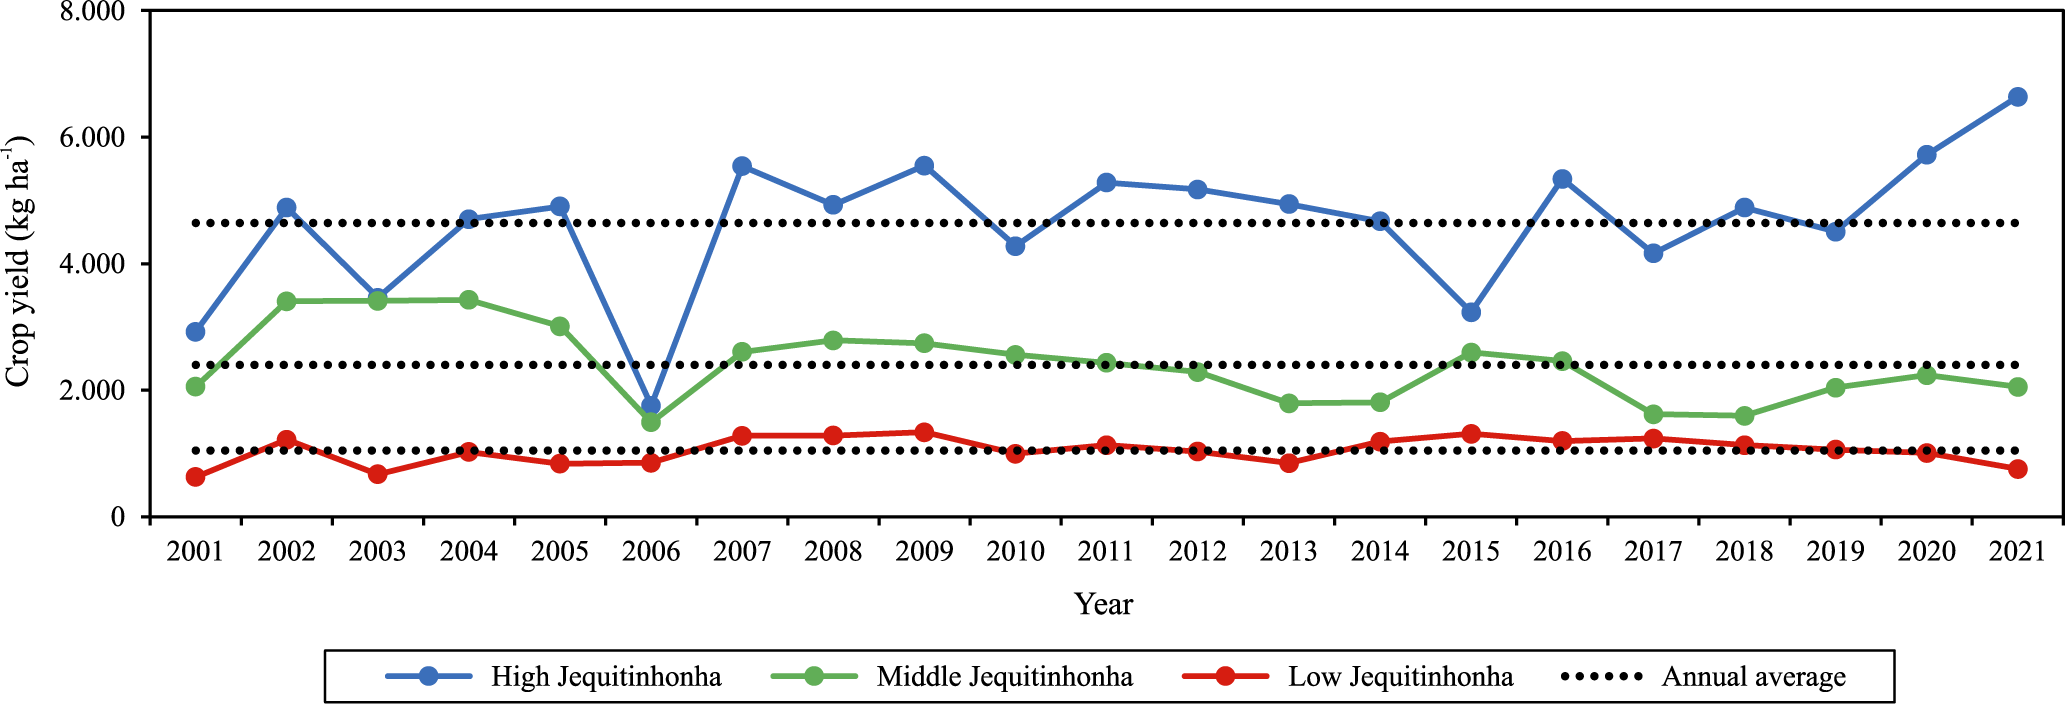
The maize yields for each sub-region of Jequitinhonha Valley were analyzed for the studied period (Figure 4). The High Jequitinhonha recorded the highest mean annual maize yield in the Valley, reaching 4,641 kg ha-1 (IBGE, 2024). The maize yield showed a linear upward trend, increasing at a rate of 74.57 kg ha-1 year-1 between 2001 and 2021, with the highest yield in 2021 (6,638 kg ha-1), and the lowest in 2006 (1,754 kg ha-1). Middle Jequitinhonha had the second highest mean annual yield of 2,400 kg ha-1, but displayed a contrasting linear downward trend of -55.80 kg ha-1 year-1 over the studied period. Its highest yield was in 2004 (3,427 kg ha-1), and the lowest in 2006 (1,493 kg ha-1). Low Jequitinhonha presented the lowest mean annual yield of 1,048 kg ha-1, despite showing an increase rate of 8.19 kg ha-1 year-1. The highest yield was in 2009 (1,334 kg ha-1), and the lowest in 2001 (626 kg ha-1).
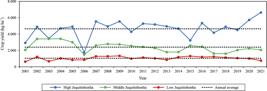
Mean annual maize yield (kg ha-1) time series for the Jequitinhonha Valley sub-regions, from 2001 to 2021. The black dotted lines represent the long-term mean annual yield, from 2001 to 2021.
The lowest maize yields observed during the study period revealed significant losses across the sub-regions: High Jequitinhonha and Middle Jequitinhonha both recorded their lowest yields in 2006, representing losses of 62% and 38%, respectively, compared to their period means. These low yields, despite the high rainfall recorded that year, suggested that other factors were limiting. Potential explanations include high temperatures, inadequate agricultural management, and the occurrence of pests or diseases that negatively impacted crop yields (Martins et al., 2018). In the case of Low Jequitinhonha, the greatest reduction, a 40% loss, occurred in 2001. This reduction is explained by the low precipitation recorded that year, which was below the mean for the period, given that rainfall is the main factor influencing crop yields in the region (Rossato et al., 2017).
The Pearson’s correlations between accumulated precipitation and maize yield, and between VCIA and maize yields, are shown in Table 2. Notably, neither correlation showed statistical significance in any of the analyzed sub-regions. Some factors may have influenced this lack of a relationship correlation. During the study period, there were records of the occurrence of pests and diseases, which impacted yield independent of climate. Additionally, local farmers employ specific agricultural practices, such as irrigation systems relying on water stored in cisterns, wells, or dams during dry periods, which may have interfered in the results. According to the National Water Agency (ANA, 2021), the total irrigated area in the Jequitinhonha Valley was 19,344 hectares in 2019.
Analysis of Pearson’s correlations(1) between accumulated precipitation and maize yield (r1), and between Vegetation Condition Index Anomaly (VCIA) and maize yield (r2) in the Jequitinhonha Valley sub-regions, from 2001 to 2021.
The lack of statistical significance in the correlations observed is consistent with findings from other studies in the region. Lopes et al. (2019), who investigated the relationship between precipitation and maize productivity in the Brazilian Semiarid region from 1990 to 2014, also highlighted weak correlations. They attributed this to the adoption of agricultural practices such as irrigation, fertilization, and the use of drought-tolerant cultivars. These practices can modify soil conditions, thereby impacting the interpretation of VCI and precipitation when correlating them directly with maize productivity.
The weak correlations found in the present study are consistent with international and regional research. Tanguy et al. (2023), examining the effects of drought using VCI in relation to maize yields in Thai provinces from 2000 to 2015, also revealed weak negative correlations. The authors suggested that factors such as land cover and crop diversity in agricultural areas likely contributed to these lower correlations. Vian et al. (2021) identified a lack of significant correlation between NDVI and maize productivity during the 2015/2016 harvest in the state of Rio Grande do Sul, Brazil. The authors emphasized the complexity and sensitivity of this relationship, suggesting that environmental factors and specific cultivation seasons can influence the results, leading to weaker correlations. This observation highlights the importance of considering the complexity of the agricultural environment when interpreting precipitation and VCI data in relation to maize productivity.
A significant limitation of this study stems from the maize yield data provided by IBGE, which does not differentiate between irrigated and rainfed crops. This lack of categorization affects the accurate assessment of drought impacts on each type of cultivation, as their respective water availability and management conditions vary. This limitation underscores the need for future studies with more detailed and segmented data, which would enable a more comprehensive understanding of drought impacts on different agricultural systems in the region. Collecting information that considers the specific characteristics of each crop type would contribute to the development of more effective management and mitigation strategies for drought effects.
Conclusions
-
Remote sensing methods can be used to assess agricultural drought at the sub-regional scale in Jequitinhonha Valley.
-
The methods proposed by the present study allow for the identification of risk areas susceptible to agricultural drought.
-
For future research, it is recommended that yield data be categorized in terms of water source, distinguishing between irrigated and rainfed crops.
Data availability statement
Data available upon request: research data are only available upon reasonable request to the corresponding author.
-
Declaration of use of AI technologies
During the preparation of this work, the authors used ChatGPT exclusively as a writing support tool for linguistic revision, text reformulation, and translation. After this use, the authors reviewed and edited the content as needed and take(s) full responsibility for it.
Acknowledgments
To Coordenação de Aperfeiçoamento de Pessoal de Nível Superior (CAPES) for financing, in part, this study (Financial Code 001).
-
Disclaimer/Publisher’s note:
The statements, opinions, and data contained in all texts published in Pesquisa Agropecuária Brasileira (PAB) are solely those of the individual author(s) and not of the journal’s publisher, editor, and editorial team, who disclaim responsibility for any injury to people or property resulting from any referred ideas, methods, instructions, or products.The mention of specific chemical products, machines, and commercial equipment in the texts published in this journal does not imply their recommendation by the publisher.
References
-
AGHAKOUCHAK, A.; FARAHMAND, A.; MELTON, F.S.; TEIXEIRA, J.; ANDERSON, M.C.; WARDLOW, B.D.; HAIN, C.R. Remote sensing of drought: progress, challenges and opportunities. Reviews of Geophysics, v.53, p.452-480, 2015. DOI: https://doi.org/10.1002/2014RG000456
» https://doi.org/10.1002/2014RG000456 -
ALVARES, C.A.; STAPE, J.L.; SENTELHAS, P.C.; GONÇALVES, J.L. de M.; SPAROVEK, G. Köppen’s climate classification map for Brazil. Meteorologische Zeitschrift, v.22, p.711-728, 2013. DOI: https://doi.org/10.1127/0941-2948/2013/0507
» https://doi.org/10.1127/0941-2948/2013/0507 -
ANA. Agência Nacional de Águas e Saneamento Básico. Atlas Irrigação: uso da água na agricultura irrigada. 2.ed. Brasília, 2021. Available at: <https://portal1.snirh.gov.br/ana/apps/storymaps/stories/a874e62f27544c6a986da1702a911c6b>. Accessed on: Dec. 15 2023.
» https://portal1.snirh.gov.br/ana/apps/storymaps/stories/a874e62f27544c6a986da1702a911c6b -
ANDRADE, C. de L.T.; ALBUQUERQUE, P.E.P.; BRITO, R.A.L.; RESENDE, M. Viabilidade e manejo da irrigação da cultura do milho Sete Lagoas: Embrapa Milho e Sorgo, 2006. (Embrapa Milho e Sorgo. Circular técnica, 85). Available at: <https://www.infoteca.cnptia.embrapa.br/infoteca/bitstream/doc/490417/1/Circ85.pdf>. Accessed on: June 8 2023.
» https://www.infoteca.cnptia.embrapa.br/infoteca/bitstream/doc/490417/1/Circ85.pdf - AYRES, M.; AYRES JR., M.; AYRES, D.L.; SANTOS, A. de A.S. dos. BioEstat 5.0: aplicações estatísticas nas áreas das ciências bio-médicas. Belém: Sociedade Civil Mamirauá, 2007. 364p.
-
BARBOSA, H.A. Flash drought and its characteristics in Northeastern South America during 2004–2022 using satellite-based products. Atmosphere, v.14, art.1629, 2023. DOI: https://doi.org/10.3390/atmos14111629
» https://doi.org/10.3390/atmos14111629 -
BHUIYAN, C.; KOGAN, F.N. Monsoon variation and vegetative drought patterns in the Luni Basin in the rain-shadow zone. International Journal of Remote Sensing, v.31, p.3223-3242, 2010. DOI: https://doi.org/10.1080/01431160903159332
» https://doi.org/10.1080/01431160903159332 -
CHERE, Z.; DEBALKE, D.B. Modeling agricultural drought based on the earth observation-derived standardized precipitation evapotranspiration index and vegetation health index in the northeastern highlands of Ethiopia. Natural Hazards, v.120, p.3127-3151, 2024. DOI: https://doi.org/10.1007/s11069-023-06320-3
» https://doi.org/10.1007/s11069-023-06320-3 -
CONAB. Companhia Nacional de Abastecimento. Calendário de plantio e colheita de grãos no Brasil 2022. Available at: <https://www.conab.gov.br/outras-publicacoes/item/download/45710_77f0a5ee35e765e2248999f4c61e70c8>. Accessed on: Oct. 10 2023.
» https://www.conab.gov.br/outras-publicacoes/item/download/45710_77f0a5ee35e765e2248999f4c61e70c8 -
CONAB. Companhia Nacional de Abastecimento. Séries Históricas Available at: <https://www.conab.gov.br/info-agro/safras/serie-historica-das-safras>. Accessed on: Sept. 23 2024.
» https://www.conab.gov.br/info-agro/safras/serie-historica-das-safras -
CUNHA, A.P.M.A.; ZERI, M.; LEAL, K.D.; COSTA, L.; CUARTAS, L.A.; MARENGO, J.A.; TOMASELLA, J.; VIEIRA, R.M.; BARBOSA, A.A.; CUNNINGHAM, C.; GARCIA, J.V.C.; BROEDEL, E.; ALVALÁ, R.; RIBEIRO-NETO, G. Extreme drought events over Brazil from 2011 to 2019. Atmosphere, v.10, art.642, 2019. DOI: https://doi.org/10.3390/atmos10110642
» https://doi.org/10.3390/atmos10110642 -
DEMISSE, G.B.; TADESSE, T.; BAYISSA, Y.; ATNAFU, S.; ARGAW, M.; NEDAW, D. Vegetation condition prediction for drought monitoring in pastoralist areas: a case study in Ethiopia. International Journal of Remote Sensing, v.39, p.4599-4615, 2018. DOI: https://doi.org/10.1080/01431161.2017.1421797
» https://doi.org/10.1080/01431161.2017.1421797 -
DU, L.; TIAN, Q.; YU, T.; MENG, Q.; JANCSO, T.; UDVARDY, P.; HUANG, Y. A comprehensive drought monitoring method integrating MODIS and TRMM data. International Journal of Applied Earth Observation and Geoinformation, v.23, p.245-253, 2013. DOI: https://doi.org/10.1016/j.jag.2012.09.010
» https://doi.org/10.1016/j.jag.2012.09.010 -
DUTTA, D.; KUNDU, A.; PATEL, N.R.; SAHA, S.K.; SIDDIQUI, A.R. Assessment of agricultural drought in Rajasthan (India) using remote sensing derived Vegetation Condition Index (VCI) and Standardized Precipitation Index (SPI). The Egyptian Journal of Remote Sensing and Space Science, v.18, p.53-63, 2015. DOI: https://doi.org/10.1016/j.ejrs.2015.03.006
» https://doi.org/10.1016/j.ejrs.2015.03.006 -
FENTAW, A.E.; YIMER, A.A.; ZELEKE, G.A. Monitoring spatio-temporal drought dynamics using multiple indices in the dry land of the upper Tekeze Basin, Ethiopia. Environmental Challenges, v.13, art.100781, 2023. DOI: https://doi.org/10.1016/j.envc.2023.100781
» https://doi.org/10.1016/j.envc.2023.100781 -
GHAFARIAN MALAMIRI, H.R.; ROUSTA, I.; OLAFSSON, H.; ZARE, H.; ZHANG, H. Gap-Filling of MODIS Time Series Land Surface Temperature (LST) Products Using Singular Spectrum Analysis (SSA). Atmosphere, v.9, art.334, 2018. DOI: https://doi.org/10.3390/atmos9090334
» https://doi.org/10.3390/atmos9090334 -
IBGE. Instituto Brasileiro de Geografia e Estatística. Biomas e sistema costeiro-marinho do Brasil: compatível com a escala 1:250.000. Rio de Janeiro, 2019. (Relatórios Metodológicos, v.45). Available at: <https://biblioteca.ibge.gov.br/index.php/biblioteca-catalogo?view=detalhes&id=2101676>. Accessed on: Mar. 20 2023.
» https://biblioteca.ibge.gov.br/index.php/biblioteca-catalogo?view=detalhes&id=2101676 -
IBGE. Instituto Brasileiro de Geografia e Estatística. Censo Demográfico 2022. Available at: <https://www.ibge.gov.br/estatisticas/downloads-estatisticas.html>. Accessed on: July 14 2025.
» https://www.ibge.gov.br/estatisticas/downloads-estatisticas.html -
IBGE. Instituto Brasileiro de Geografia e Estatística. Produção Agrícola Municipal: Tabela 1612: Área plantada, área colhida, quantidade produzida, rendimento médio e valor da produção das lavouras temporárias. Available at: <https://sidra.ibge.gov.br/tabela/1612>. Accessed on: July 19 2024.
» https://sidra.ibge.gov.br/tabela/1612 -
INMET. Instituto Nacional de Meteorologia. Estações meteorológicas Available at: <http://www.inmet.gov.br>. Accessed on: Apr. 15 2021.
» http://www.inmet.gov.br -
JIAO, W.; ZHANG, L.; CHANG, Q.; FU, D.; CEN, Y.; TONG, Q. Evaluating an enhanced Vegetation Condition Index (VCI) based on VIUPD for drought monitoring in the Continental United States. Remote Sensing, v.8, art.224, 2016. DOI: https://doi.org/10.3390/rs8030224
» https://doi.org/10.3390/rs8030224 -
KLOOS, S.; YUAN, Y.; CASTELLI, M.; MENZEL, A. Agricultural drought detection with MODIS based vegetation health indices in Southeast Germany. Remote Sensing, v.13, art.3907, 2021. DOI: https://doi.org/10.3390/rs13193907
» https://doi.org/10.3390/rs13193907 -
KOGAN, F.N. Droughts of the late 1980s in the United States as derived from NOAA polar-orbiting satellite data. Bulletin of the American Meteorological Society, v.76, p.655-668, 1995. DOI: https://doi.org/10.1175/1520-0477(1995)076<0655:DOTLIT>2.0.CO;2
» https://doi.org/10.1175/1520-0477(1995)076<0655:DOTLIT>2.0.CO;2 -
LIANG, L.; QIN, Z.; ZHAO, S.; DI, L.; ZHANG, C.; DENG, M.; LIN, H.; ZHANG, L.; WANG, L.; LIU, Z. Estimating crop chlorophyll content with hyperspectral vegetation indices and the hybrid inversion method. International Journal of Remote Sensing, v.37, p.2923-2949, 2016. DOI: https://doi.org/10.1080/01431161.2016.1186850
» https://doi.org/10.1080/01431161.2016.1186850 -
LIOU, Y.-A.; MULUALEM, G.M. Spatio-temporal assessment of drought in Ethiopia and the impact of recent intense droughts. Remote Sensing, v.11, art.1828, 2019. DOI: https://doi.org/10.3390/rs11151828
» https://doi.org/10.3390/rs11151828 -
LIU, E.; ZHOU, G.; ZHOU, H. The nonlinear drought response and its critical threshold of Stipa krylovii Roshev. typical steppe phenology. International Journal of Biometeorology, v.69, p.2209-2224, 2025. DOI: https://doi.org/10.1007/s00484-025-02958-9
» https://doi.org/10.1007/s00484-025-02958-9 -
LIU, W.T.; KOGAN, F.N. Monitoring regional drought using the Vegetation Condition Index. International Journal of Remote Sensing, v.17, p.2761-2782, 1996. DOI: https://doi.org/10.1080/01431169608949106
» https://doi.org/10.1080/01431169608949106 -
LOPES, J.R.F.; DANTAS, M.P.; FERREIRA, F.E.P. Variabilidade da precipitação pluvial e produtividade do milho no semiárido brasileiro através da análise multivariada. Nativa, v.7, p.77-83, 2019. DOI: https://doi.org/10.31413/nativa.v7i1.6243
» https://doi.org/10.31413/nativa.v7i1.6243 -
MARENGO, J.A.; TORRES, R.R.; ALVES, L.M. Drought in Northeast Brazil: past, present, and future. Theoretical and Applied Climatology, v.129, p.1189-1200, 2017. DOI: https://doi.org/10.1007/s00704-016-1840-8
» https://doi.org/10.1007/s00704-016-1840-8 -
MARTINS, M.A.; TOMASELLA, J.; RODRIGUEZ, D.A.; ALVALÁ, R.C.S.; GIAROLLA, A.; GAROFALO, L.L.; SIQUEIRA JÚNIOR, J.L.; PAOLICCHI, L.T.L.C.; PINTO, G.L.N. Improving drought management in the Brazilian semiarid through crop forecasting. Agricultural Systems, v.160, p.21-30, 2018. DOI: https://doi.org/10.1016/j.agsy.2017.11.002
» https://doi.org/10.1016/j.agsy.2017.11.002 -
NGUYEN, H.; THOMPSON, A.; COSTELLO, C. Impacts of historical droughts on maize and soybean production in the Southeastern United States. Agricultural Water Management, v.281, art.108237, 2023. DOI: https://doi.org/10.1016/j.agwat.2023.108237
» https://doi.org/10.1016/j.agwat.2023.108237 -
NOGUEIRA, S.M.C.; MOREIRA, M.A.; VOLPATO, M.M.L. Evaluating precipitation estimates from Eta, TRMM and CHRIPS data in the South-Southeast region of Minas Gerais state - Brazil. Remote Sensing, v.10, art.313, 2018. DOI: https://doi.org/10.3390/rs10020313
» https://doi.org/10.3390/rs10020313 -
PACHECO, D.G.; ANDRADE, A.M. de. Monitoring agricultural drought using different indices based on remote sensing data in the Brazilian biomes of Cerrado and Atlantic Forest. International Journal of Biometeorology, v.68, p.2069-2082, 2024. DOI: https://doi.org/10.1007/s00484-024-02731-4
» https://doi.org/10.1007/s00484-024-02731-4 -
PAREDES-TREJO, F.J.; BARBOSA, H.A.; KUMAR, T.V.L. Validating CHIRPS-based satellite precipitation estimates in Northeast Brazil. Journal of Arid Environments, v.139, p.26-40, 2017. DOI: https://doi.org/10.1016/j.jaridenv.2016.12.009
» https://doi.org/10.1016/j.jaridenv.2016.12.009 -
ROSSATO, L.; ALVALÁ, R.C. dos S.; MARENGO, J.A.; ZERI, M.; CUNHA, A.P.M. do A.; PIRES, L.B.M.; BARBOSA, H.A. Impact of soil moisture on crop yields over Brazilian Semiarid. Frontiers in Environmental Science, v.5, art.73, 2017. DOI: https://doi.org/10.3389/fenvs.2017.00073
» https://doi.org/10.3389/fenvs.2017.00073 -
SANTOS, C.A.G.; BRASIL NETO, R.M.; SILVA, R.M. da; SANTOS, D.C. dos. Innovative approach for geospatial drought severity classification: a case study of Paraíba state, Brazil. Stochastic Environmental Research and Risk Assessment, v.33, p.545-562, 2019. DOI: https://doi.org/10.1007/s00477-018-1619-9
» https://doi.org/10.1007/s00477-018-1619-9 -
SHALISHE, A.; BHOWMICK, A.; ELIAS, K. Agricultural drought analysis and its association among land surface temperature, soil moisture and precipitation in Gamo Zone, Southern Ethiopia: a remote sensing approach. Natural Hazards, v.117, p.57-70, 2023. DOI: https://doi.org/10.1007/s11069-023-05849-7
» https://doi.org/10.1007/s11069-023-05849-7 -
SILVA, G.J.F. da; OLIVEIRA, N.M. de; SANTOS, C.A.G.; SILVA, R.M. da. Spatiotemporal variability of vegetation due to drought dynamics (2012–2017): a case study of the upper Paraíba River basin, Brazil. Natural Hazards, v.102, p.939-964, 2020. DOI: https://doi.org/10.1007/s11069-020-03940-x
» https://doi.org/10.1007/s11069-020-03940-x -
TANGUY, M.; EASTMAN, M.; MAGEE, E.; BARKER, L.J.; CHITSON, T.; EKKAWATPANIT, C.; GOODWIN, D.; HANNAFORD, J.; HOLMAN, I.; PARDTHAISONG, L.; PARRY, S.; REY VICARIO, D.; VISESSRI, S. Indicator-to-impact links to help improve agricultural drought preparedness in Thailand. Natural Hazards and Earth System Sciences, v.23, p.2419-2441, 2023. DOI: https://doi.org/10.5194/nhess-23-2419-2023
» https://doi.org/10.5194/nhess-23-2419-2023 -
TIGGES, C.H.P.; ANDRADE, C. de L.T. de; MELO, B.F. de; AMARAL, T.A. Épocas de semeadura de milho em plantios de sequeiro e irrigado em Minas Gerais Embrapa Milho e Sorgo: Sete Lagoas, 2016. (Embrapa Milho e Sorgo. Circular técnica, 225). Available at: <https://ainfo.cnptia.embrapa.br/digital/bitstream/item/161250/1/circ-225.pdf>. Accessed on: June 8 2023.
» https://ainfo.cnptia.embrapa.br/digital/bitstream/item/161250/1/circ-225.pdf -
USDA. United States Department of Agriculture. World Agricultural Production: crop explorer: corn. 2024. Available at: <https://ipad.fas.usda.gov/cropexplorer/cropview/commodityView.aspx?cropid=0440000&sel_year=2023&rankby=Production>. Accessed on: Oct. 10 2024.
» https://ipad.fas.usda.gov/cropexplorer/cropview/commodityView.aspx?cropid=0440000&sel_year=2023&rankby=Production -
VALE, T.M.C. do; SPYRIDES, M.H.C.; ANDRADE, L. de M.B.; BEZERRA, B.G.; SILVA, P.E. da. Subsistence agriculture productivity and climate extreme events. Atmosphere, v.11, art.1287, 2020. DOI: https://doi.org/10.3390/atmos11121287
» https://doi.org/10.3390/atmos11121287 -
VIAN, A.L.; BREDEMEIER, C.; DRUM, M.A.; PIRES, J.L.F.; FOCHESTTO, E. Vegetation sensors as a tool for plant population identification and corn grain yield estimation. Pesquisa Agropecuária Tropical, v.51, e66926, 2021. DOI: https://doi.org/10.1590/1983-40632021v5166926
» https://doi.org/10.1590/1983-40632021v5166926 -
WANG, C.; LINDERHOLM, H.W.; SONG, Y.; WANG, F.; LIU, Y.; TIAN, J.; XU, J.; SONG, Y.; REN, G. Impacts of drought on maize and soybean production in Northeast China during the past five decades. International Journal of Environmental Research and Public Health, v.17, art.2459, 2020. DOI: https://doi.org/10.3390/ijerph17072459
» https://doi.org/10.3390/ijerph17072459 -
WINKLER, K.; GESSNER, U.; HOCHSCHILD, V. Identifying droughts affecting agriculture in Africa based on remote sensing time series between 2000–2016: rainfall anomalies and vegetation condition in the context of ENSO. Remote Sensing, v.9, art.831, 2017. DOI: https://doi.org/10.3390/rs9080831
» https://doi.org/10.3390/rs9080831 -
XIE, F.; FAN, H. Deriving drought indices from MODIS vegetation indices (NDVI/EVI) and Land Surface Temperature (LST): Is data reconstruction necessary? International Journal of Applied Earth Observation and Geoinformation, v.101, art.102352, 2021. DOI: https://doi.org/10.1016/j.jag.2021.102352
» https://doi.org/10.1016/j.jag.2021.102352 -
ZERI, M.; ALVALÁ, R.C.S.; CARNEIRO, R.; CUNHA-ZERI, G.; COSTA, J.M.; SPATAFORA, L.R.; URBANO, D.; VALL-LLOSSERA, M.; MARENCO, J. Tools for communicating agricultural drought over the Brazilian Semiarid using the Soil Moisture Index. Water, v.10, art.1421, 2018. DOI: https://doi.org/10.3390/w10101421
» https://doi.org/10.3390/w10101421
Edited by
-
Chief editor:
Edemar Corazza
-
Edited by:
Daniel Kinpara