 Proposal for soybean genotype selection based on the agronomic and environmental resilience index
Abstract
The objective of this work was to propose a selection index based on the agronomic and environmental resilience of soybean. The experiment was carried out at the research farm of Universidade Regional do Noroeste do Estado do Rio Grande do Sul. The user experimental design was that of augmented blocks with interspersed controls, arranged in three replicates. The regular treatments corresponded to 89 F8 lineages (99.218% homozygosity), and the common treatments were represented by four commercial controls (BRS 284, BMX Valente 6968 RSF RR, BMX Raio 50I52 RSF IPRO, and M 5710 I2X45). The following agronomic variables were measured based on five plants per experimental unit: number of seeds per plant and seed weight per plant. The agronomic and environmental resilience index (GSIR∆) was proposed in order to combine the attributes of seed number and weight with meteorological data. Selection based on the GSIR∆ allows selecting 13 lineages (122F8, 176F8, 165F8, 232F8, 109F8, 99F8, 166F8, 93F8, 154F8, 85F8, 121F8, 152F8 and 169F8) with a high agronomic potential for productivity and resilience to abiotic stresses, such as high temperatures and low precipitation volumes.
Index terms:
genetic breeding; meteorological factors; progeny testing; selection index.
Resumo
O objetivo deste trabalho foi propor um índice de seleção baseado na resiliência agronômica e ambiental da soja. O experimento foi realizado na Escola Fazenda da Universidade Regional do Noroeste do Estado do Rio Grande do Sul. O delineamento utilizado foi o de blocos aumentados com testemunhas intercaladas, dispostas em três repetições. Os tratamentos regulares corresponderam a 89 linhagens F8 (99,218% de homozigose), e os tratamentos comuns foram representados por quatro testemunhas comerciais (BRS 284, BMX Valente 6968 RSF RR, BMX Raio 50I52 RSF IPRO e M 5710 I2X45). As seguintes variáveis agronômicas foram mensuradas com base em cinco plantas por unidade experimental: número de sementes por planta e peso de sementes por planta. O índice de resiliência agronômica e ambiental (GSIR∆) foi proposto com o objetivo de combinar os atributos de número e peso de sementes com dados meteorológicos. A seleção baseada no GSIR∆ permite selecionar 13 linhagens (122F8, 176F8, 165F8, 232F8, 109F8, 99F8, 166F8, 93F8, 154F8, 85F8, 121F8, 152F8 e 169F8) com alto potencial agronômico para produtividade e resiliência a estresses abióticos, como altas temperaturas e baixos volumes de precipitação.
Termos para indexação:
melhoramento genético; fatores meteorológicos; testes de progênie; índice de seleção.
Introduction
Soybean [Glycine max (L.) Merr.] is considered one of the main agricultural commodities because it is the most widely cultivated oilseed in the world, being an important part of people’s diet and a raw material for the industry (Ferreira et al., 2021). Ferreira et al. (2022) highlighted that the crop has grown in the last three decades, projecting a favorable scenario for producers and investors. The increase of productive potential of soybean genotypes is challenging. One of those challenges is a result of the impact of climate change, with temperature change in some farming areas and water restrictions due to the lack of rain in specific periods (Wang et al., 2023; Thomasz et al., 2024).
Considering this scenario, genetic breeding programs face the challenge of developing genotypes with high production potential, high resilience, and capable of broad adaptation to the environmental changes (Pradebon et al., 2023). Carvalho et al. (2021) stated that selecting superior and promising genotypes is an arduous process since important characteristics, such as number of seeds per plant and seed weight per plant, have low heritability. Low heritability happens because these characteristics are controlled by many genes that are greatly affected by the environment.
In the search for promising genotypes, different methodologies are used, such as genetic parameter analyses, genetic and phenotypic correlations, selection gains, and the use of selection indices (Vasconcelos et al., 2012). The latter is an alternative that allows grouping independent variables that, together, improve selection strategies (Cruz et al., 2020). According to Bizari et al. (2017), due to their speed and efficiency, the selection indices are more successful in selecting genotypes.
Several indices assist in selecting genotypes for stress conditions, such as the strategies proposed by Ghazvini et al. (2024) for selection of barley progenies, or the indices mentioned by Alves et al. (2021) and Farias et al. (2024) to determine the sensitivity of soybeans to water deficit. However, most of these indices depend on a large number of covariates, do not completely associate agronomic characteristics with meteorological variables, and do not consider meteorological variables.
The objective of this work was to propose a selection index based on the agronomic and environmental resilience of soybean.
Materials and Methods
The study was carried out at the research farm of Universidade Regional do Noroeste do Estado do Rio Grande do Sul, located in the municipality of Augusto Pestana, in the state of Rio Grande do Sul, Brazil (28°26'25"S, 54°00'07"W). The soil was classified as a Latossolo Vermelho distroférrico típico, according to the Brazilian Soil Classification System (Santos et al., 2018), i.e., Oxisol. The climate is characterized as Cfa according to Köppen’s classification.
The experimental design used was augmented blocks with interspersed controls, with three replicates, totaling 101 experimental units. The regular treatments corresponded to 89 F8 lineages (99.218% homozygosity), and the common treatments were represented by four commercial controls (BRS 284, BMX Valente 6968 RSF RR, BMX Raio 50I52 RSF IPRO, and M 5710 I2X).
The experimental units consisted of two sowing rows, each one 5.0 m long, spaced 0.45 m apart, representing a total area of 4.5 m2. Sowing was performed in the first half of December 2021, with a density of 14 seeds per linear meter. Base fertilization consisted of 300 kg ha-1 of organic mineral fertilizer with the NPK 05-20-20 formulation. In order to minimize biotic effects on the results of the experiment, phytosanitary management was carried out preventively.
Agronomic data were collected by harvesting all plants in each experimental unit. In order to determine the number of seeds per plant (NSP), plants were collected individually, and the number of seeds was counted. In order to determine the seed weight per plant (SWP, g), the seeds of a plant were crushed, weighed on a digital scale, and the moisture content was corrected to 13%.
The meteorological station at the research farm of Universidade Regional do Noroeste do Estado do Rio Grande do Sul provided data related to air temperature and precipitation (Prec, in mm). Air temperature data were mean temperature (Tmean, in °C), minimum temperature (Tmin, in °C), and maximum temperature (Tmax, in °C). The optimal meteorological conditions for each phenological stage of soybean development were obtained in previous studies (Cunha & Bergamaschi, 1992; Carvalho et al., 2013; Silva et al., 2013; Tecnologias…, 2013; Ferrari et al., 2015; Neumaier et al., 2020; Cunha et al., 2021). The estimated optimal air temperatures were 22ºC, with upper basal of 40ºC and lower basal of 10ºC. The estimated optimal precipitation was 1.0 mm per day-1 from germination (G) to first expanded leaflet (V1), 5.0 mm per day along the vegetative period, and up to 8.0 mm per day in the reproductive period.
The assumptions of homoscedasticity, normality of errors, and independence of errors were checked by using Breusch-Pagan, Shapiro Wilk, and Bartlett’s tests, respectively. All assumptions were met. NSP and SWP data were subjected to deviance analysis at 5% probability by using chi-square (χ2). Restricted maximum likelihood (REML) was used to estimate the variance components and genetic parameters: genotypic variance (σ2G), residual variance (σ2E), phenotypic variance (σ2P), and broad-sense heritability (H2g). These parameters were used to estimate the best linear unbiased predictors (BLUPs), allowing the tested genotypes to be ranked.
The genetic selection index for resilience (GSIR∆) is based on the estimated BLUPs of each genotype and daily meteorological data. The index is expressed mathematically as follows (Equation 1):
where: GSIR∆ is the agronomic and environmental resilience index; NSC is the prediction of the number of seeds from commercial controls, NSL is the prediction of the number of seeds of each lineage, SNS is the sample standard deviation of the prediction for the variable number of seeds per plant, SWC is the prediction of seed weight of commercial controls, SWL is the prediction of seed weight for each lineage, SSW is the sample standard deviation of the prediction for the variable seed weight per plant, PREC is the ideal precipitation for the crop, equivalent to 650 mm (Carvalho et al., 2013), RPREC is the real precipitation occurred during the lineage cycle, SPREC is the sample standard deviation of real precipitation, TEMP is the ideal mean air temperature for crops, equivalent to 25ºC (Neumaier et al., 2020), RTEMP is the real mean air temperature occurred during the lineage cycle, and STMED is the sample standard deviation of the variable mean air temperature.
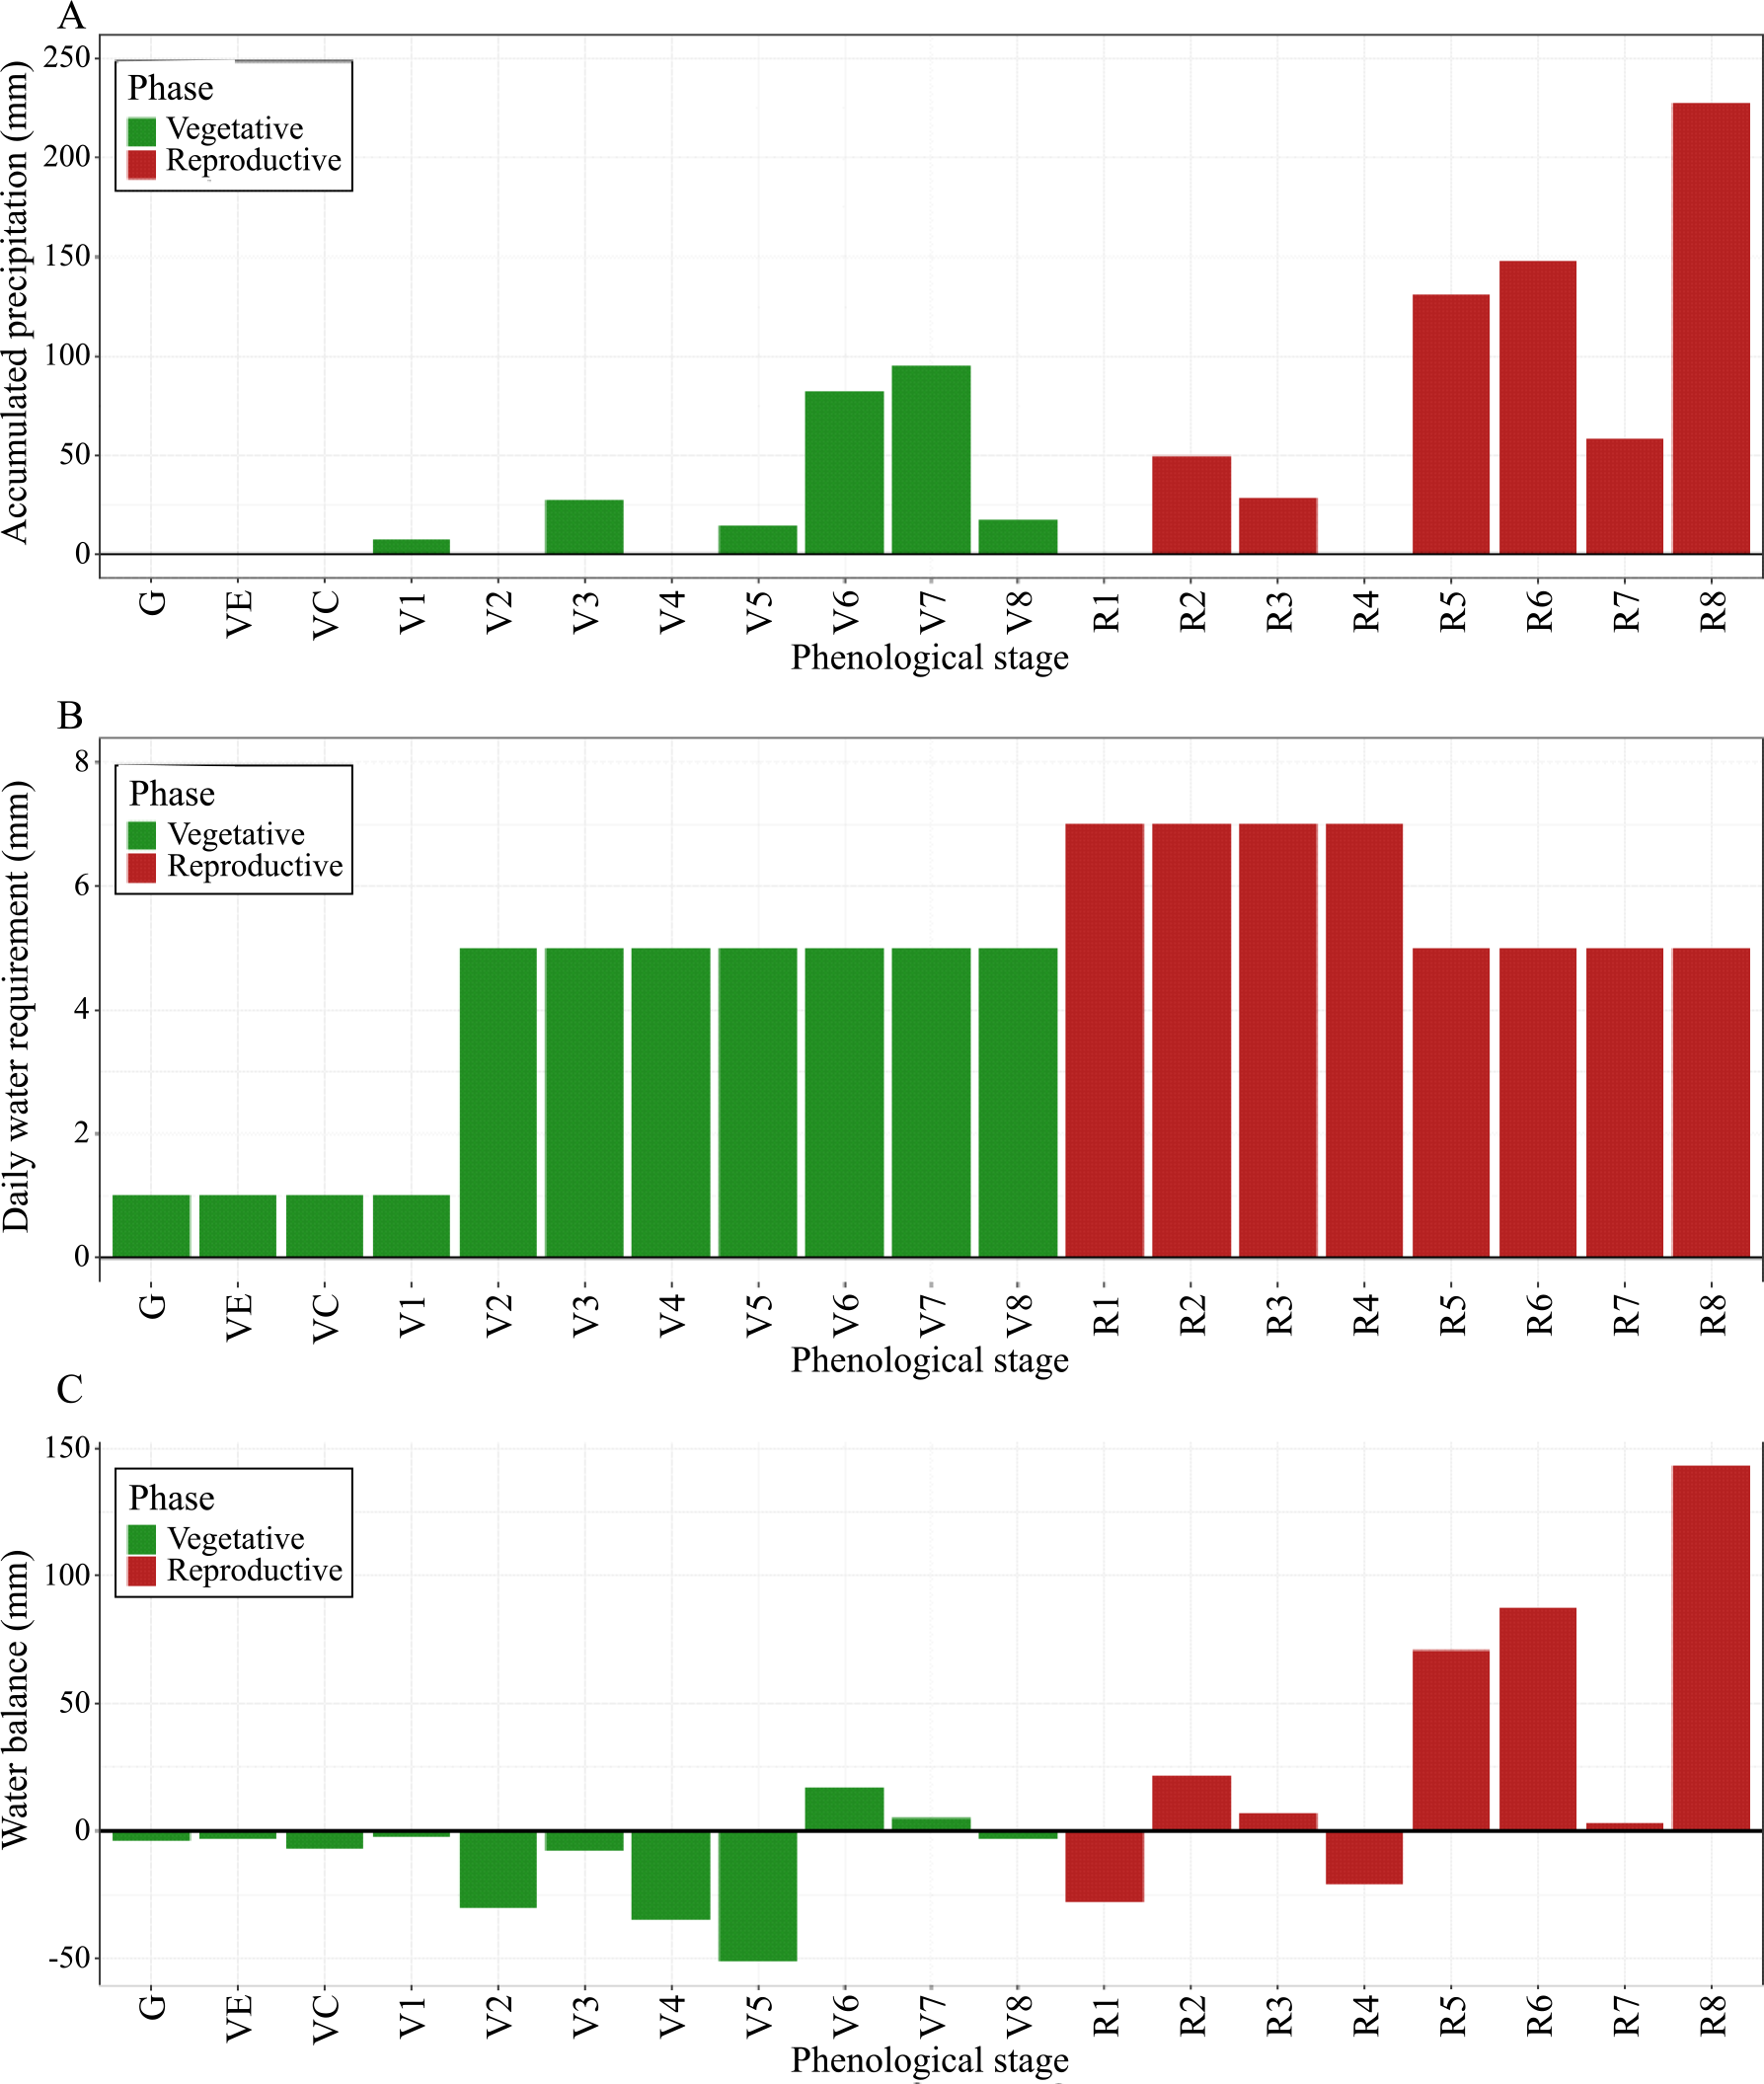
Each variable in Equation 1 was weighted by the respective standard deviation in order to turn the variable into a dimensionless parameter. The desired value of the parameter was deducted from the value of the control of the respective agronomic characteristics or, in the case of meteorological data, from values previously cited in other studies. The soybean cycle was used as a covariate to determine the requirements for total precipitation and mean air temperature of each genotype. In years when water restriction was overly pronounced, total precipitation and mean air temperature were used. However, it is suggested that in case of few occurrences of water restriction, only the values from the stress period should be used to calculate the index. The stratified precipitation at each phenological stage was measured by the meteorological station (Figure 1 A), the water requirement of the crop was obtained in literature (Figure 1 B), and the water deficit during the soybean cycle was estimated (Figure 1 C).

Data of (A) precipitation in the experimental area; (B) ideal daily water requirements(1) of soybean; and (C) estimated water balance (A-B), stratified by phenological stages(2) of the soybean life cycle. (1)Source: Cunha & Bergamaschi (1992), Carvalho et al. (2013), and Cunha et al. (2021). (2)G, germination; VE, emergence; VC, vegetative cotyledon; Vx, vegetative stage x; and Ry, reproductive stage y.
The R software (R Core Team, 2023) was used in all statistical analyzes. The packages ExpDes.pt (Ferreira et al., 2021), metan (Olivoto & Lúcio, 2020), and ggplot2 (Wickham, 2016) were installed.
Results and Discussion
In order to use GSIR∆, it is necessary to know the water requirements, optimal temperature, and basal temperature of soybean.
The estimated demand of water for the complete cycle of soybean is 450 to 800 mm (Tecnologias…, 2013). In the present study, the accumulated water was 884 mm. Given this criterion, there was enough water for full development of the crop. However, the frequency, the distribution, and the phenological stages of soybeans must be considered.
During the vegetative phase, the water requirements (Figure 1 B) of 1.0 mm per day of water are expected in the stages of germination (G), emergence (VE), vegetative cotyledon (VC), and one expanded leaflet (V1). In subsequent stages, water requirement increases to 5.0 mm per day, as the soybean expands its leaf area and plant structure. Observing Figure 1 A, there was an absence of precipitation in stages V2 and V4, while in V5, V6, and V7, precipitation was close to the expected amount needed for full development of the crop. There was water deficit from G to V5, and in V8 (Figure 1 C). A lack of water harms plant growth, as it minimizes photosynthetic activity due to stomatal closure, consequently decreasing CO2 assimilation (Bianchi et al., 2016). According to Carmello (2011), initial establishment depends directly on a satisfactory water supply.
During the reproductive phase, there is an increase in water requirements, mainly due to the differentiation of meristems and production of flowers. Maximum requirements are from R4 to R6, when the formation of the legume and grains takes place, and there is an increase in grain weight. The daily water requirement increases to 8.0 mm per day until physiological maturity, after which the water requirement decreases (Ferrari et al., 2015). No precipitation occurred in stages R1 and R4 (Figure 1 A), which resulted in severe stress on plants in the field (Figure 1 C). Water deficit causes physiological changes in the plant, including premature abscission of leaves and flowers (Barbosa et al., 2020). This set of actions culminates in the loss of soybean’s productive potential. Regularity of the water supply due to precipitation was observed in stages R2, R3, R5, R6, and R8 (Figure 1 A). In these stages, precipitation was accumulated above the optimal amount for the crop (Figure 1C), a fact that was beneficial for the study results.
For soybean, the upper base temperature is 40°C, and the ideal maximum temperature is 30°C (Neumaier et al., 2020). During the vegetative period, soybean was submitted to temperatures between 30 and 40ºC, causing thermal stress in the plant (Figure 2). On the other hand, during the reproductive period, soybean was exposed to maximum temperature below 30°C, which is beneficial for phenological events and differentiations. This was a consequence of precipitation in the period, which improved the growing environment conditions.

Data of the meteorological station of (A) maximum temperature; (B) minimum temperature; and (C) mean temperature of the air, during the soybean life cycle(1) in the experimental site. (1)G, germination; VE, emergence; VC, vegetative cotyledon; Vx, vegetative stage x; and Ry, reproductive stage y.
For soybean, the lower base temperature is 10°C, and ideal minimum temperature is 20°C (Neumaier et al., 2020). In the present study, temperatures below 10°C were not observed. However, for some lineages with cycles longer than 125 days, a decrease in the minimum temperature was observed during the period of physiological maturity and field maturation, at the end of the crop cycle (Figure 2). When considering the mean temperature, more than 80% of the soybean cycle was in the range of 20 to 30ºC, a suitable condition for the crop.
Table 1 shows the estimates of variance components and genetic parameters. The estimates and ratios of genotypic variance (σ2G) and phenotypic variance (σ2P) provided an understanding of the magnitude of genetic variability. Broad sense heritability (H2g) estimated for NSP and WSP were 0.25 and 0.24, respectively. These values express a low genetic variability for the attributes measured, which is expected due to the segregating generation of soybean lineages. This parameter is crucial for future predictions.
Estimates of variance components and broad-sense heritability for number of seeds per plant (NSP) and seed weight per plant (SWP) for F8 soybean (Glycine max) lineages.
Entringer et al. (2014) stated that selection success is directly proportional to the magnitude of heritability, but closely related to the target generation, number of lineages, and control of residual variability. By using several models for estimating genetic parameters, Carvalho et al. (2023) found a restricted-sense heritability for SWP of 0.16, revealing difficulty in obtaining genetic variability and an additive effect for this variable.
The estimated mean of the BLUP components for NSP is shown in Table 2. The results reveal that 33 of the lineages obtained a pure genetic gain (g) superior to that of the controls M 5710 I2X, BMX Raio 50I52 RSF IPRO, BMX Valente 6968 RSF RR, and BRS 284 (Table 2). High genetic gains can be obtained by selecting the 122F8, resulting in a gain of 91.046 seeds per plant, allowing the next generation to obtain plants with an average of 155.2 seeds. Borges et al. (2010) state that the use of BLUP predictions allows understanding and selecting promising genotypes through information that reveals the true genetic value, and minimizes distortions in estimates due to environmental effects.
Results of BLUP as pure genetic gain (g), pure genetic gain and additive genetic merit (g + u), expected genetic gain after selection (gain), and expected population mean after selection (new mean) for the trait number of seeds per plant (NSP) in F8 soybean (Glycine max) lineages, classified in decreasing order of “new mean”.
The estimated mean of the BLUP components for SWP is presented in Table 3. The results show that 34 of the lineages expressed a pure genetic gain (g) higher than that of the commercial controls, meaning that there is a possibility of selecting genotypes with high productive potential. The best lineage was 122F8, which showed an increase of 12.999 g in SWP, resulting in a genotype with a potential yield of 24.887 g per plant in the next generation. The “new mean” predicted by BLUP will be close to the magnitude that the trait will obtain in the next cultivation. However, if the estimate of pure genetic + additive genetic gain (g + u) is close to the “new mean”, there is a high probability that this prediction will be consistent (Borges et al., 2010). The predictions of total gains (g + u) were close to the “new mean”, which characterizes them as correct and reliable.
Results of BLUP as pure genetic gain (g), pure genetic gain and additive genetic merit (g + u), expected genetic gain after selection (gain), and expected population mean after selection (new mean) for the trait seed weight per plant (SWP) in F8 soybean (Glycine max) lineages, classified in decreasing order of “new mean”.
The GSIR∆ index was developed with the aim of supporting the selection of resilient genotypes. It was developed through the prediction of the NSP and SWP characters, relating them to ideal climatic factors (precipitation and temperature) for soybeans. The lower the GSIR∆ index, the more resilient the genotypes. Subtracting the predicted values from the constants in the equation causes the values to tend towards zero. On the other hand, a high GSIR∆ index indicates that the environment is highly demanding for full genotypic expression. Cruz et al. (2014) created a similar index in their study, in order to find superior genotypes and environments that are favorable or unfavorable to the character of interest.
Table 4 shows the lineages and their respective values obtained by using GSIR∆. The estimated mean value to be reached was 0.09, calculated from the individual mean values of all lineages in the study. The selected lineages were 122F8, 176F8, 165F8, 232F8, 109F8, 99F8, 166F8, 93F8, 154F8, 85F8, 121F8, 152F8 and 169F8. These genotypes showed high productive potential even in unsuitable climatic conditions. For the traits NSP and SWP, the 122F8 genotype stands out, but it requires a highly controlled environment to express its potential, since it presented the highest GSIR∆.
Results of the genetic selection index for resilience (GSIR∆), classified in decreasing order.
The estimated heritability for the studied characters was H2 = 0.25 and H2 = 0.24 for NSP and SWP, respectively, meaningt they have a complex inheritance, in addition to being highly influenced by the environment. Among 89 lineages, 37.08% were better than commercial controls for NSP, and 38.20% for SWP. When GSIR∆ was used as a selection tool of lineages focusing on resilience, only 14.61% of them were selected.
Conclusions
-
1. Soybean (Glycine max) lineages 122F8 and 176F8 are superior in terms of productivity components.
-
2. The best linear unbiased predictors allows for selection of 33 lineages for number of seeds per plant and 34 lineages for seed weight per plant.
-
3. The proposed agronomic and environmental resilience index allows for selection of 13 lineages for high agronomic potential and resilience to abiotic stress.
Disclaimer/Publisher’s note
The statements, opinions, and data contained in all texts published in Pesquisa Agropecuária Brasileira (PAB) are solely those of the individual author(s) and not of the journal’s publisher, editor, and editorial team, who disclaim responsibility for any injury to people or property resulting from any referred ideas, methods, instructions, or products.
The mention of specific chemical products, machines, and commercial equipment in the texts published in this journal does not imply their recommendation by the publisher.
Acknowledgment
To Conselho Nacional de Desenvolvimento Científico e Tecnológico (CNPq), for financial support (307554/2021-0).
Declaration of use of AI technologies
No generative artificial intelligence (AI) was used in this study.
Data availability statement
Data available upon request: research data are only available upon reasonable request to the corresponding author.
References
-
ALVES, E. da S.; RODRIGUES, L.N.; OLIVEIRA, R.A. de; LORENA, D.R. Water deficit on the growth and yield of irrigated soybean in the Brazilian Cerrado region. Revista Brasileira de Engenharia Agrícola e Ambiental, v.25, p.750-757, 2021. DOI: https://doi.org/10.1590/1807-1929/agriambi.v25n11p750-757
» https://doi.org/10.1590/1807-1929/agriambi.v25n11p750-757 -
BARBOSA, J.R.; PEREIRA FILHO, J.V.; OLIVEIRA, V.M. de; SOUSA, G.G. de; GOES, G.F.; LEITE, K.N. Productivity of irrigated soybean crops with regulated water deficit in the Cerrado of Piauí. Revista Brasileira de Agricultura Irrigada, v.14, p.4200-4210, 2020. DOI: https://doi.org/10.7127/RBAI.V14N401196
» https://doi.org/10.7127/RBAI.V14N401196 -
BIANCHI, L.; GERMINO, G.H.; SILVA, M. de A. Adaptação das plantas ao déficit hídrico. Acta Iguazu, v.5, p.15-32, 2016. DOI: https://doi.org/10.48075/actaiguaz.v5i4.16006
» https://doi.org/10.48075/actaiguaz.v5i4.16006 - BIZARI, E.H.; VAL, B.H.P.; PEREIRA, E. de M.; DI MAURO, A.O.; UNÊDA-TREVISOLI, S.H. Selection indices for agronomic traits in segregating populations of soybean. Revista Ciência Agronômica, v.48, p.110-117, 2017.
-
BORGES, V.; FERREIRA, P.V.; SOARES, L.; SANTOS, G.M.; SANTOS, A.M.M. Seleção de clones de batata-doce pelo procedimento REML/BLUP. Acta Scientiarum. Agronomy, v.32, p.643-649, 2010. DOI: https://doi.org/10.4025/actasciagron.v32i4.4837
» https://doi.org/10.4025/actasciagron.v32i4.4837 - CARMELLO, V. Vulnerabilidade agrícola da produção de soja na região metropolitana de Londrina - PR: análise da safra de 2005/06. Revista Geográfica de América Central, v.2, p.1-16, 2011.
- CARVALHO, I.R.; KORCELSKI, C.; PELISSARI, G.; HANUS, A.D.; ROSA, G.M. da. Demanda hídrica das culturas de interesse agronômico. Enciclopedia Biosphere, v.9, p.969-985, 2013.
-
CARVALHO, I.R.; SILVA, J.A.G. da; MOURA, N.B.; FERREIRA, L.L.; LAUTENCHLEGER, F.; SOUZA, V.Q. de. Methods for estimation of genetic parameters in soybeans: an alternative to adjust residual variability. Acta Scientiarum. Agronomy, v.45, e56156, 2023. DOI: https://doi.org/10.4025/actasciagron.v45i1.56156
» https://doi.org/10.4025/actasciagron.v45i1.56156 -
CARVALHO, I.V.; HUTRA, D.J.; FURLAN, R.D.P.; SCARTON, V.D.B.; TRETER, R.J.R.; SANGIOVO, J.P.; ZIMMERMANN, C.S.; LAUTENCHLEGER, F.; LORO, M.V.; PRADEBON, L.C. Selection of soybean F3 segregating families by multivariate models. Functional Plant Breeding Journal, v.3, p.95-106, 2021. DOI: https://doi.org/10.35418/2526-4117/v3n2a8
» https://doi.org/10.35418/2526-4117/v3n2a8 - CRUZ, C.D.; CARNEIRO, P.C.S.; REGAZZI, A.J. Modelos biométricos aplicados ao melhoramento genético 3.ed. Viçosa: UFV, 2014. v.2, 668p.
- CRUZ, C.D.; FERREIRA, F.M.; PESSONI, L.A. Biometria aplicada ao estudo da diversidade genética 2.ed. Viçosa: UFV, 2020.
- CUNHA, F.F. da; SEDIYAMA, T.; SILVA, F.C. dos S. (Ed.). Irrigação da soja: uso e manejo. Londrina: Mecenas, 2021.
- CUNHA, G.R.; BERGAMASCHI, H. Efeitos da disponibilidade hídrica sobre o rendimento das culturas. In: BERGAMASCHI, H. (Coord.). Agrometeorologia aplicada a irrigação Porto Alegre: UFRGS, 1992. p.85-97.
-
ENTRINGER, G.C.; SANTOS, P.H.A.D.; VETTORAZZI, J.C.F.; CUNHA, K.S. da; PEREIRA, M.G. Correlação e análise de trilha para componentes de produção de milho superdoce. Revista Ceres, v.61, p.356-361, 2014. DOI: https://doi.org/10.1590/S0034-737X2014000300009
» https://doi.org/10.1590/S0034-737X2014000300009 -
FARIAS, D.B. dos S.; RODRIGUES, L.N.; ALEMAN, C.C.; CECON, P.R. Estimation of soybean crop water deficit sensitivity index. Scientia Agricola, v.81, e20230103, 2024. DOI: https://doi.org/10.1590/1678-992X-2023-0103
» https://doi.org/10.1590/1678-992X-2023-0103 -
FERRARI, E.; PAZ, A. da; SILVA, A.C. da. Déficit hídrico no metabolismo da soja em semeaduras antecipadas no Mato Grosso. Nativa, v.3, p.67-77, 2015. DOI: https://doi.org/10.31413/nativa.v3i1.1855
» https://doi.org/10.31413/nativa.v3i1.1855 -
FERREIRA, L.L.; AMARAL, U.; TURATI, G.L.; CARVALHO, I.R.; SILVA, R.V.; SANTOS, N.S.C.; FERNANDES, M.S.; LAUTENCHLEGER, F.; LORO, M.V.; PEREIRA, A.I.A.; CURVÊLO, C.R.S. Agronomic performance of soybean genotypes supplemented with micronutrients via leaf. Agronomy Science and Biotechnology, v.8, p.1-14, 2022. DOI: https://doi.org/10.33158/ASB.r164.v8.2022
» https://doi.org/10.33158/ASB.r164.v8.2022 -
FERREIRA, L.L.; SILVA, Â.J. da; CARVALHO, I.R.; FERNADES, M. de S.; LAUTENCHLEGER, F.; LORO, M.V. Correlations and canonical variables applied to the distinction of soybean cultivars in a tropical environment. Agricultural Science and Biotechnology, v.8, p.1-12, 2021. DOI: https://doi.org/10.33158/ASB.r146.v8.2022
» https://doi.org/10.33158/ASB.r146.v8.2022 -
GHAZVINI, H.; POUR-ABOUGHADAREH, A.; JASEMI, S.S.; CHAICHI, M.; TAJALI, H.; BOCIANOWSKI, J. A framework for selection of high-yielding and drought-tolerant genotypes of barley: applying yield-based indices and multi-index selection models. Journal of Crop Health, v.76, p.601-616, 2024. DOI: https://doi.org/10.1007/s10343-024-00981-1
» https://doi.org/10.1007/s10343-024-00981-1 - NEUMAIER, N.; FARIAS, J.R.B.; NEPOMUCENO, A.L.; MERTZ-HENNING, L.M.; FOLONI, J.S.S.; MORAES, L.A.C.; GONCALVES, S.L. Ecofisiologia da soja. In: SEIXAS, C.D.S.; NEUMAIER, N.; BALBINOT JUNIOR, A.A.; KRZYZANOWSKI, F.C.; LEITE, R.M.V.B. de C. (Ed.). Tecnologias de produção de soja Londrina: Embrapa Soja, 2020. p.34-54. (Embrapa Soja. Sistemas de produção, 17).
-
OLIVOTO, T.; LÚCIO, A.D. metan: an R package for multi-environment trial analysis. Methods in Ecology and Evolution, v.11, p.783-789, 2020. DOI: https://doi.org/10.1111/2041-210X.13384 .
» https://doi.org/10.1111/2041-210X.13384 -
PRADEBON, L.C.; CARVALHO, I.R.; SANGIOVO, J.P.; LORO, M.V.; SCARTON, V.D.B.; PORT, E.D.; MALLMANN, G.; STASIAK, G.; MACIEL, D.G.; LOPES, P.F.; CARIOLI, G. Management tendencies and needs: a joint proposal to maximize soybean grain yield. Agronomy Science and Biotechnology, v.9, p.1-11, 2023. DOI: https://doi.org/10.33158/ASB.r187.v9.2023
» https://doi.org/10.33158/ASB.r187.v9.2023 - R CORE TEAM. R: a language and environment for statistical computing. Vienna: R Foundation for Statistical Computing, 2023.
- SANTOS, H.G. dos; JACOMINE, P.K.T.; ANJOS, L.H.C. dos; OLIVEIRA, V.A. de; LUMBRERAS, J.F.; COELHO, M.R.; ALMEIDA, J.A. de; ARAUJO FILHO, J.C. de; OLIVEIRA, J.B. de; CUNHA, T.J.F. Brazilian soil classification system 5th ed. rev. and exp. Brasília: Embrapa, 2018. E-book.
-
SILVA, A.J. da; CANTERI, M.G.; SILVA, A.L. da. Haste verde e retenção foliar na cultura da soja. Summa Phytopathologica, v.39, p.151-156, 2013. DOI: https://doi.org/10.1590/S0100-54052013000300001
» https://doi.org/10.1590/S0100-54052013000300001 - TECNOLOGIAS de produção de soja na região central do Brasil em 2014. Londrina: Embrapa Trigo, 2013. (Sistemas de produção, 16).
-
THOMASZ, E.O.; PÉREZ-FRANCO, I.; GARCÍA-GARCÍA, A. Assessing the impact of climate change on soybean production in Argentina. Climate Services, v.34, art.100458, 2024. DOI: https://doi.org/10.1016/j.cliser.2024.100458
» https://doi.org/10.1016/j.cliser.2024.100458 -
VASCONCELOS, E.S. de; REIS, M.S.; SEDIYAMA, T.; CRUZ, C.D. Estimativas de parâmetros genéticos da qualidade fisiológica de sementes de genótipos de soja produzidas em diferentes regiões de Minas Gerais. Semina: Ciências Agrárias, v.33, p.65-76, 2012. DOI: https://doi.org/10.5433/1679-0359.2012v33n1p65
» https://doi.org/10.5433/1679-0359.2012v33n1p65 -
WANG, H.; GUOHUI, S.; ZIZHONG, S.; XIANGDONG, H. Effects of climate and price on soybean production: empirical analysis based on panel data of 116 prefecture-level Chinese cities. PLoS ONE, v.18, e0273887, 2023. DOI: https://doi.org/10.1371/journal.pone.0273887
» https://doi.org/10.1371/journal.pone.0273887 -
WICKHAM, H. ggplot2: elegant graphics for data analysis. Cham: Springer, 2016. 2nd ed. 260p. DOI: https://doi.org/10.1007/978-3-319-24277-4
» https://doi.org/10.1007/978-3-319-24277-4
Edited by
-
Chief editor:
Edemar Corazza
-
Edited by:
Daniel Kinpara