 Altitude on the physicochemical characteristics of coffee beverage from beans produced in Taquaritinga do Norte, in the state of Pernambuco, Brazil
Abstract
The objective of this work was to determine the physicochemical characteristics of coffee beverages prepared with Coffea arabica beans produced at different altitudes in the municipality of Taquaritinga do Norte, in the state of Pernambuco, Brazil. Eight coffee bean samples, obtained from five different producers, were analyzed in a completely randomized design, with three replicates. The evaluated variables were: total acidity, pH, electrical conductivity, total dissolved solids, extraction percentage, reducing sugars, and caffeine content. The data were subjected to the analysis of variance, Tukey’s mean test, and agglomerative hierarchical clustering. The results showed total acidity from 0.39 to 3.05 mL-1 NaOH, pH from 5.30 to 4.80, electrical conductivity from 2.79 to 3.24 µS cm-1, total dissolved solids from 2.00 to 2.56 °Brix, extraction percentage from 18.14 to 27.24%, reducing sugars from 0.28 to 0.40%, and caffeine content from 0.50 to 2.18%. Through agglomerative hierarchical clustering, two groups of samples were discriminated based on the evaluated physicochemical parameters. Altitude is a common aspect of the samples of a same group, defining different characteristics of coffee beverages in Taquaritinga do Norte.
Index terms:
Coffea arabica
; altimetry; beverage crops; cultivation
Resumo
O objetivo deste trabalho foi determinar as características físico-químicas de bebidas de café preparadas com grãos de Coffea arabica produzidos em diferentes altitudes no município de Taquaritinga do Norte, no estado de Pernambuco, Brasil. Foram analisadas oito amostras de grãos de café, obtidas de cinco diferentes produtores, em delineamento inteiramente casualizado, com três repetições. As variáveis avaliadas foram: acidez total, pH, condutividade elétrica, sólidos dissolvidos totais, percentagem de extração, açúcares redutores e teor de cafeína. Os dados foram submetidos à análise de variância, ao teste de média de Tukey e ao agrupamento aglomerativo hierárquico. Os resultados indicaram acidez total de 0,39 a 3,05 g mL-1 de NaOH, pH de 5,30 a 4,80, condutividade elétrica de 2,79 a 3,24 µS cm-1, sólidos dissolvidos totais de 2,00 a 2,56°Brix, percentagem de extração de 18,14 a 27,24%, açúcares redutores de 0,28 a 0,40% e teor de cafeína de 0,50 a 2,18%. Por meio da técnica de agrupamento aglomerativo hierárquico, foram discriminados dois grupos de amostras com base nas variáveis físico-químicas avaliadas. A altitude é um aspecto comum das amostras de um mesmo grupo, tendo definido diferentes características de bebidas de café em Taquaritinga do Norte.
Termos para indexação
Coffea arabica
; altimetria; culturas para bebidas; cultivo
Introduction
The coffee plant is a perennial shrub belonging to the Rubiaceae family, of the Coffea genus, with over 100 species described, among which Coffea arabica L. and Coffea canephora Pierre ex A.Froehner are the most commercially traded (Senar, 2017). In Brazil, the total production of Arabica coffee was approximately 38,904.9 thousand bags of processed coffee in 2023 according to Companhia Nacional de Abastecimento (Acompanhamento…, 2023), showing an increase of 18.9% compared with the volume of coffee produced in the previous year’s harvest.
The quality of the produced coffee depends on several factors, such as bean roasting, processing, and fermentation. Before coffee roasting, two important events are coffee cherry processing and fermentation, whose order depends on the agricultural practices adopted by the farmer. For coffee cherry processing, there are three major methods: a dry process, also known as natural processing; a wet process, where the skin and pulp of the fruit are removed; and a semi-wet process, when only the skin is removed (Sousa et al., 2023). For coffee cherry fermentation, the same authors added that the grains are subjected to fermentation in the presence or absence of oxygen, which can occur spontaneously or induced by the microbiota present in the fruit or through starter cultures of microorganisms. In general, the coffee fermentation process has the potential to improve the quality of the beverage, changing its main sensory attributes such as body, sweetness, acidity, aroma, and flavor (Pereira et al., 2020). However, regardless of the type of processing used, the coffee bean must reach an ideal moisture content of 10–12% on a wet basis, in order to prevent the development of bacteria or fungi (Sanz-Uribe et al., 2017).
After being processed and dried, the coffee beans undergo quality classification. This can be done either using the methodology described by Classificação Oficial Brasileira (Brasil, 2003), the official Brazilian classification for commodity coffee, or by following the protocol outlined by the Specialty Coffee Association of America (Senar, 2017) for the classification of specialty coffees.
The roasting process, through its various chemical and physical reactions, is responsible for determining most of the final characteristics of the coffee beverage. Poisson et al. (2017) highlighted that these characteristics are strongly influenced by the degree of roasting (light, medium, or dark) of the coffee beans, which can alter the main sensory attributes of the beverage, such as color, flavor, aroma, sweetness, acidity, bitterness, and body.
In addition to the great chemical and sensory complexity of the coffee beverage, the way that is consumed can vary significantly depending on cultural, geographical, and social factors, as well as on personal preferences, among others (Caporaso et al., 2014). In the case of Brazil, the quality of the final drink can be positively impacted by the innovations in coffee harvesting and processing in the country (Costa, 2020), which can increase the sustainability and efficiency of the production chain. Specifically in the municipality Taquaritinga do Norte, in the state of Pernambuco, the production of coffee cultivated agroecologically stands out, mostly under shade and using the C. arabica species.
In 2014, the association of organic producers of Taquaritinga do Norte, called Associação dos Produtores Orgânicos de Taquaritinga do Norte, was established, uniting coffee producers with the goal of enhancing coffee production and processing methods (Gomes & Regueira, 2019). In 2022, the municipality produced 420 tons of Arabica coffee (processed in grains) in an area of 700 hectares, representing 70.46% of the coffee of Pernambuco according to Instituto Brasileiro de Geografia e Estatística (IBGE, 2023).
The objective of this work was to determine the physicochemical characteristics of beverages prepared with Coffea arabica beans produced at different altitudes in the municipality of Taquaritinga do Norte, in the state of Pernambuco, Brazil.
Materials and Methods
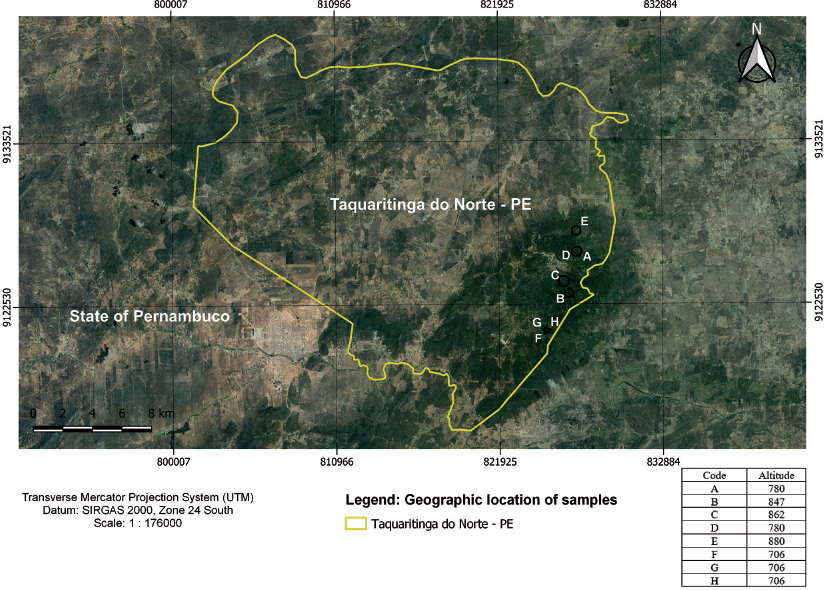
The coffee samples used in the study were collected in the municipality of Taquaritinga do Norte (Figure 1), located in the microregion of Alto do Capibaribe, in the mesoregion of Agreste do Pernambuco (7°54’06.2”S 36°02’51.3”W), covering an area of 475.184 km2 (IBGE, 2022). The region is situated in the Caatinga Biome, characterized by a tropical climate with a predominantly hypoxerophytic Caatinga vegetation.
Map of the sites and respective altitudes where the Coffea arabica coffee samples (A to H) were collected in the municipality of Taquaritinga do Norte, in the state of Pernambuco, Brazil.
The used coffee beans, all classified as medium roasting by the manufacturers, were donated by five producers from Associação dos Produtores Orgânicos de Taquaritinga do Norte, the association of organic producers of the municipality. Additional information about the samples is provided in Table 1.
Description of the samples of Coffea arabica coffee, showing cultivar, processing, quality classification, and cultivation altitude as indicated on their labels.
Three beverages were prepared from each coffee bean sample (n=24). For this, a ceramic Koar filter holder donated by Koar Café do Brasil (Recife, PE, Brazil) was used. The beverages were prepared in triplicate, following the methodology described by Angeloni et al. (2019) for drip-filtered beverages, with the following adaptations: water temperature of 92±1°C, coffee/water ratio of 8.0 g per 100 mL distilled water (pH 7.65±0.28 and electrical conductivity of 3.63±0.04 µs cm-1), medium-fine grind (0.5 mm particle size and 32 mesh), and 3 min extraction. The experiment was carried out in a completely randomized design with three replicates, and the experimental unit was 400 mL of coffee beverage. The samples were stored at room temperature (24.0±1.0°C), within their original packaging, until the physicochemical analyses were conducted.
The following physicochemical properties were analyzed using the methodologies described by Instituto Adolf Lutz (Zenebon et al., 2008): total titratable acidity, expressed in g mL-1 NaOH 0.1 N spent; pH, measured with the PA200 digital pH meter (Marconi, Piracicaba, SP, Brazil); electrical conductivity (µS cm-1), measured using the AC-200 conductivity meter (Avla Científica, Uberaba, MG, Brazil); and total dissolved solids (°Brix), measured with the Redi-P-101 digital refractometer (Megabrix, Ionlab, Araucária, PR, Brazil). Extraction percentage, reducing sugars, and caffeine content were also determined.
Extraction percentage was calculated according to the methodology of Wang et al. (2016). To determine the content of total reducing sugars, the 3,5-dinitrosalicylic acid method described by Miller (1959) was followed. Absorbance readings were taken at 540 nm using the UV-M51 UV-VIS spectrophotometer (BEL Equipamentos Analíticos Ltda, Piracicaba, SP, Brazil), with values expressed as percentage, based on a calibration curve performed with glucose concentrations ranging from 0.1 to 1.0 g L-1.
Caffeine content (%) was determined following the methodology described by Instituto Adolf Lutz (Zenebon et al., 2008). For this, sulfuric acid was added to the coffee samples, and a selective carbonization of organic matter was carried out. Then, caffeine was extracted using chloroform as a solvent. Absorbance readings were taken at 276 nm with the UV-M51 UV-VIS spectrophotometer (BEL Equipamentos Analíticos Ltda, Piracicaba, SP, Brazil), based on a calibration curve performed with caffeine concentrations ranging from 0.6 to 2.0 g L-1.
The data from the laboratory analyses were subjected to the one-way analysis of variance. In addition, normality, homoscedasticity, and independence of errors were checked using Shapiro-Wilk’s, Barlett’s, and Durbin-Watson’s tests, respectively, at 5% probability. All assumptions were met, and no data transformation was needed. Outliers were detected and removed. Means were compared by Tukey’s test, at 5% probability.
Agglomerative hierarchical clustering according to Ward (1963) was used as the grouping method. Dissimilarity was measured using the mean Euclidean distance, and the method proposed by Mojena (1977) was adopted to determine the optimal number of groups (k) present in the dendrogram.
All statistical analyses were performed using the R, version 4.4.1 (R Core Team, 2024), and RStudio, version 2024.04.2+764 (RStudio Team, 2024), software. The MultivariateAnalysis R package was used for standardizing the matrix based on the averages of the variables. The generated maps were manipulated with the open-source QGIS 3.28 software (QGIS Development Team, 2024). The geographic and altitude data were obtained from Instituto Brasileiro de Geografia e Estatística (IBGE, 2023) and the Topodata (2023) repository, respectively.
Results and Discussion
Samples E, C, and B were cultivated at the highest altitudes of 880, 862, and 847 m, respectively, followed by samples A and D, at an altitude of 780 m, and by samples F, G, and H, at 706 m (Table 1). Worku et al. (2018) concluded that altitude is one of the most important parameters for the production of high-quality and specialty coffees. In this line, Martins et al. (2020) identified a significant effect of altitude on the biochemical composition of coffee beans, observing an increase in the concentration of fatty acids and chlorogenic acid as elevation rose. Therefore, the quality of coffee is affected by altitude, as well as by other factors such as geographic origin, climatic conditions, harvesting methods, processing types, and storage (Tassew et al., 2021; Filete et al., 2022). Another relevant factor is the beverage extraction process (Santos et al., 2024).
Regarding the total acidity of the evaluated coffee beverages, sample F showed the highest value of 3.05±0.06 g mL-1 NaOH, while samples C and E exhibited the lowest of 0.39±0.10 and 0.46±0.05 g mL-1 NaOH, respectively (Table 2). The characteristic sour or acidic taste present in coffee beverages is an attribute associated to high-quality coffees (specialty or gourmet). Tassew et al. (2021), for example, noted a higher total acidity as cultivation altitudes increased. However, in the present study, the opposite behavior was observed since there was an increase in total acidity as elevation decreased. These different behaviors may be associated to the different stages of fruit ripeness in the samples from the different farmers or to the different roasting times. In this sense, Poisson et al. (2017) found that longer roasting times cause a greater degradation of organic acids.
Means, standard deviation of the mean, and results of Tukey’s mean test obtained for the physicochemical parameters evaluated for eight samples of coffee beverages (A to H) extracted from different Coffea arabica coffee beans produced in the municipality of Taquaritinga do Norte, in the state of Pernambuco, Brazil(1).
pH values were the highest for sample C (5.30±0.02), but the lowest for samples D (4.80±0.04) and B (4.85±0.00), as shown in Table 2. This parameter is used to evaluate potential changes in coffee fruit during the pre- and post-harvest stages, when factors that may interfere with the pH value of coffee beverages occur, including climatic conditions, cultivar type, fruit-maturation stage, grain quality, roast degree (light, medium, or dark), type of extraction method (infusion, percolation, or pressure), and the water/coffee ratio used for beverage preparation, among others (Angeloni et al., 2019).
Regarding electrical conductivity, samples G, A, and B showed the highest values of 3.24±0.07, 3.23±0.12, and 3.22±0.06 µS cm-1, respectively, and sample D, the lowest of 2.79±0.39 µS cm-1 (Table 2). This parameter, which measures the capacity of the membrane to transport ions, is linked to grain quality. Ribeiro et al. (2023) found that the disorganization of the cell membrane and the consequent loss of components, such as potassium, correspond to the loss of beverage quality. Therefore, high values of electrical conductivity indicate a low grain quality. In the present study, all analyzed samples presented a low electrical conductivity, which is an indicative of a good-quality beverage.
The total dissolved solids (TDS) parameter is used to control the quality of coffee extraction, measuring the amount of soluble material present in the beverage that was dissolved during the extraction process (Córdoba et al., 2020). When evaluating the influence of the content of TDS in different degrees of roast (light, medium, and dark), Frost et al. (2020) observed that the bitterness and lingering-flavor attributes were strongly driven by higher values. These authors also concluded that the perception of sweetness tended to decrease as TDS increased, reporting values ranging from 0.9 to 1.8%. In the present work, sample C showed the highest TDS content of 2.56±0.03ºBrix, and sample D, the lowest of 2.00±0.00ºBrix (Table 2), meaning that the coffee beverages would probably be classified as bitter, with a lingering flavor, and not as sweet.
Extraction yield or extraction percentage is the ratio between the mass of extracted soluble components and the mass of the used coffee grounds (Córdoba et al., 2020). In 1957, Lockhart developed a chart called the Coffee Brewing Control Chart, allowing of TDS and extraction percentage to be used as quality control parameters for coffee beverage extractions. According to Frost et al. (2020), the ideal range for high quality beverages is from 18 to 22%. In the present study, most samples (A, B, D, F, G, and H) were within this range, with values from 18.14 to 21.27%; the exceptions were samples C (27.24±0.89%) and E (25.59±0.44%) with the highest extraction percentages (Table 2).
In general, reducing sugars play an important role in the roasting process of coffee beans, being used as substrates for the Maillard reaction. High values of this attribute can indicate a high number of precursors for the formation of volatiles (aromatic compounds and volatile acids) and nonvolatiles (melanoidins and acids), contributing to the sensory perception of the coffee cup (Ferreira & Montanuci, 2020). Samples D and F exhibited the highest values of reducing sugars of 0.40±0.04 and 0.38±0.03%, respectively, while sample C showed the lowest of 0.28±0.01% (Table 2). Ferreira & Montanuci (2020) obtained two-fold values of reducing sugars compared with those of 0.70±0.06 to 0.98±0.20 found in the present study. These low values of reducing sugars may be explained by the used types of processing, degrees of roast, and variety of coffee.
Regarding caffeine content, the highest value of 2.18±0.03% was obtained for sample F, and the lowest of 0.50±0.01%, for sample E (Table 2). It is noteworthy that samples A and D from the same cultivar (Typica), despite undergoing different processing conditions (Table 1), showed the same caffeine content of 1.69±0.00% (Table 2). The caffeine substance, 1,3,7-trimethylxanthine-2,6-dione, belongs to the group of methylxanthines and is one of the most well-known chemical compounds associated with coffee beverages, being responsible for stimulating the effect and sensory characteristic of bitterness (Pietsch, 2017).
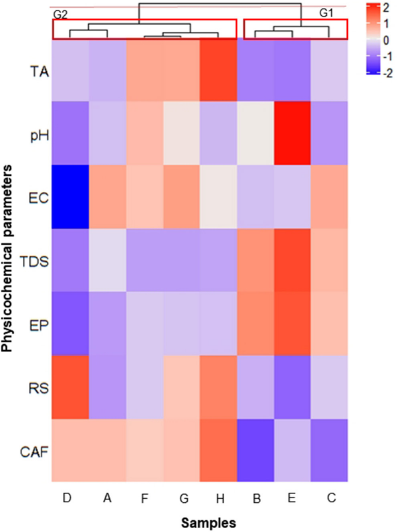
In order to determine possible similarities or dissimilarities among the coffee samples in terms of physicochemical parameters, the hierarchical clustering analysis was conducted (Figure 2). A cophenetic correlation coefficient of 0.79 was obtained, resulting in two groups (k= 2) according to the method proposed by Mojena (1977).
Hierarchical clustering analysis, based on the evaluated physicochemical parameters, of eight samples (A to H) of Coffea arabica coffee produced in the municipality of Taquaritinga do Norte, in the state of Pernambuco, Brazil. The color scale represents the relationship degree between variables and samples. TA, total acidity; EC, electrical conductivity; TDS, total dissolved solids; EP, extraction percentage; RS, reducing sugars; and CAF, caffeine content. G1 and G2, groups formed.
The groups consisted of the following samples: B, C, and E in group 1 (G1); and A, D, F, G, and H in group 2 (G2) (Figure 2). The heat map used in the clustering analysis has a color scale ranging from -2 (blue) to 2 (red), which is directly related to the significance between the evaluated variables and samples (Figure 2). Although the samples in the same group were not necessarily from the same cultivar or did not have the same quality classification, they shared a similar altitude. The samples in G1 were cultivated at an altitude from 847 to 880 m, whereas those in G2, at 706 to 780 m. Therefore, altitude seemingly affects the studied physicochemical characteristics, allowing of the formation of two groups of coffee beans.
The analysis of the physicochemical characteristics of the samples in a same group showed differences between G1 and G2. In G1, samples C and E had a low quality in terms of total acidity, a sensory attribute that differentiates higher quality coffees. As to pH, sample C had the highest value, which may indicate problems during harvesting. In terms of electrical conductivity, samples C and E were classified as low quality compared with sample B. Considering TDS, samples B, C, and E were categorized as drinks with a lingering aftertaste and a certain bitterness. Regarding extraction percentage, a quality control characteristic, samples C and E were within the ideal range. For reducing sugars, sample C showed the lowest value, whereas, for caffeine, samples B and E had the lowest content. In comparison, all samples in G2 presented better physicochemical results than those in G1, which could be related to problems during harvesting and bean roasting in the latter group.
Conclusions
-
Using agglomerative hierarchical clustering, the evaluated Coffea arabica coffee beverage samples can be classified into two groups (G1 and G2) based on the studied physicochemical characteristics.
-
The samples in the same group share similar altitudes, above 800 m in G1 and below 800 m in G2.
-
Altitude defines different coffee beverage characteristics in the municipality of Taquaritinga do Norte, in the state of Pernambuco, Brazil.
Acknowledgments
To the associated producers of Associação dos Produtores Orgânicos de Taquaritinga do Norte (APROTAQ), for support in the research and the donation of the coffee samples; to Universidade Federal do Agreste de Pernambuco (UFAPE), for support in the research; and to Conselho Nacional de Desenvolvimento Científico e Tecnológico (CNPq), for financial support to the undergraduate students.
References
-
ACOMPANHAMENTO DA SAFRA BRASILEIRA [DE] CAFÉ: safra 2023: quarto levantamento, v.10, n.4, dez. 2023. Available at: <https://www.conab.gov.br/info-agro/safras/cafe/boletim-da-safra-de-cafe/item/download/50685_9a1021b64436b24e993ef7d33271e532>. Accessed on: June 30 2024.
» https://www.conab.gov.br/info-agro/safras/cafe/boletim-da-safra-de-cafe/item/download/50685_9a1021b64436b24e993ef7d33271e532 -
ANGELONI, G.; GUERRINI, L.; MASELLA, P.; BELLUMORI, M.; DALUISO, S.; PARENTI, A.; INNOCENTI, M. What kind of coffee do you drink? An investigation on effects of eight different extraction methods. Food Research International, v.116, p.1327-1335, 2019. DOI: https://doi.org/10.1016/j.foodres.2018.10.022
» https://doi.org/10.1016/j.foodres.2018.10.022 -
BRASIL. Ministério da Agricultura, Pecuária e Abastecimento. Instrução Normativa no 8, de 11 de junho de 2003 [Aprova o Regulamento Técnico de Identidade e de Qualidade para a Classificação do Café Beneficiado Grão Cru]. Brasília, 2003. Available at: <https://abic.com.br/wp-content/uploads/2021/07/Instrucao-Normativa-08-03.pdf>. Accessed on: Nov. 29 2024.
» https://abic.com.br/wp-content/uploads/2021/07/Instrucao-Normativa-08-03.pdf -
CAPORASO, N.; GENOVESE, A.; CANELA, M.D.; CIVITELLA, A.; SACCHI, R. Neapolitan coffee brew chemical analysis in comparison to espresso, moka and American brews. Food Research International, v.61, p.152-160, 2014. DOI: https://doi.org/10.1016/j.foodres.2014.01.020
» https://doi.org/10.1016/j.foodres.2014.01.020 -
CÓRDOBA, N.; FERNANDEZ-ALDUENDA, M.; MORENO, F.L.; RUIZ, Y. Coffee extraction: a review of parameters and their influence on the physicochemical characteristics and flavour of coffee brews. Trends in Food Science & Technology, v.96, p.45-60, 2020. DOI: https://doi.org/10.1016/j.tifs.2019.12.004
» doi.org/10.1016/j.tifs.2019.12.004 -
COSTA, B. de R. Brazilian specialty coffee scenario. In: ALMEIDA, L.F. de; SPERS, E.E. (Ed.). Coffee consumption and industry strategies in Brazil [Amsterdam]: Elsevier, 2020. p.51-64. DOI: https://doi.org/10.1016/B978-0-12-814721-4.00003-2
» 10.1016/B978-0-12-814721-4.00003-2 -
FERREIRA, A.C.C.; MONTANUCI, F.D. Influência da temperatura e método de secagem do café (Coffea arabica) nas características físico-químicas e sensoriais da bebida. Revista Brasileira de Tecnologia Agroindustrial, v.14, p.3228-3249, 2020. DOI: https://doi.org/10.3895/rbta.v14n2.8380
» https://doi.org/10.3895/rbta.v14n2.8380 -
FILETE, C.A.; MOREIRA, T.R.; SANTOS, A.R. dos; GOMES, W. dos S.; GUARÇONI, R.C.; MORELI, A.P.; AUGUSTO, M.I.; ABREU, R. de O.; SIMMER, M.M.B.; CALIMAN, A.D.C.; GUIMARÃES, C.V.; BERILLI, S. da S.; FERRÃO, M.A.G.; FONSECA, A.F.A. da; PARTELLI, F.L.; BERILLI, A.P.C.G.; OLIVEIRA, E.C. da S.; PEREIRA, L.L. The new standpoints for the terroir of Coffea canephora from Southwestern Brazil: edaphic and sensorial perspective. Agronomy, v.12, art.1931, 2022. DOI: https://doi.org/10.3390/agronomy12081931
» https://doi.org/10.3390/agronomy12081931 -
FROST, S.C.; RISTENPART, W.D.; GUINARD, J.-X. Effects of brew strength, brew yield, and roast on the sensory quality of drip brewed coffee. Journal of Food Science, v.85, p.2530-2543, 2020. DOI: https://doi.org/10.1111/1750-3841.15326
» https://doi.org/10.1111/1750-3841.15326 -
Google. Google Earth Pro. Available at: <http://www.google.com/earth/index.html>. Accessed on: Nov. 12 2024.
» http://www.google.com/earth/index.html -
GOMES, J. de A.; REGUEIRA, L.F.X.V. Empreendedorismo rural (o caso dos produtores de café em Taquaritinga do Norte - PE. Revista Valore, v.4, p.225-234, 2019. DOI: https://doi.org/10.22408/reva402019366225-234
» https://doi.org/10.22408/reva402019366225-234 -
IBGE. Instituto Brasileiro de Geografia e Estatística. Geociências 2022. Available at: <www.ibge.gov.br/geociencias/downloads-geociencias.html>. Accessed on: Nov. 5 2023.
» www.ibge.gov.br/geociencias/downloads-geociencias.html>. -
IBGE. Instituto Brasileiro de Geografia e Estatística. PAM - Produção Agrícola Municipal: culturas temporárias e permanentes. 2023. Available at: <https://www.ibge.gov.br/estatisticas/economicas/agricultura-e-pecuaria/9117-producao-agricola-municipal-culturas-temporarias-e-permanentes.html?=&t=resultados>. Accessed on: July 1 2024.
» https://www.ibge.gov.br/estatisticas/economicas/agricultura-e-pecuaria/9117-producao-agricola-municipal-culturas-temporarias-e-permanentes.html?=&t=resultados> -
MARTINS, P.M.M.; BATISTA, N.N.; MIGUEL, M.G. da C.P.; SIMÃO, J.B.P.; SOARES, J.R.; SCHWAN, R.F. Coffee growing altitude influences the microbiota, chemical compounds and the quality of fermented coffees. Food Research International, v.129, art.108872, 2020. DOI: https://doi.org/10.1016/j.foodres.2019.108872
» https://doi.org/10.1016/j.foodres.2019.108872 -
MILLER, G.L. Use of dinitrosalicylic acid reagent for determination of reducing sugar. Journal of Analytical Chemistry, v.31, p.426-428, 1959. DOI: https://doi.org/10.1021/ac60147a030
» https://doi.org/10.1021/ac60147a030 -
MOJENA, R. Hierarchical grouping methods and stopping rules: an evaluation. The Computer Journal, v.20, p.359-363, 1977. DOI: https://doi.org/10.1093/comjnl/20.4.359
» https://doi.org/10.1093/comjnl/20.4.359 -
PEREIRA, L.L.; GUARÇONI, R.C.; PINHEIRO, P.F.; OSÓRIO, V.M.; PINHEIRO, C.A.; MOREIRA, T.R.; ten CATEN, C.S. New propositions about coffee wet processing: chemical and sensory perspectives. Food Chemistry, v.310, art.125943, 2020. DOI: https://doi.org/10.1016/j.foodchem.2019.125943
» https://doi.org/10.1016/j.foodchem.2019.125943 -
PIETSCH, A. Decaffeination: process and quality. In: FOLMER, B. (Ed.). The craft and science of coffee Amsterdam: Elsevier, 2017. p.225-243. DOI: https://doi.org/10.1016/B978-0-12-803520-7.00010-4
» https://doi.org/10.1016/B978-0-12-803520-7.00010-4 -
POISSON, L.; BLANK, I.; DUNKEL, A.; HOFMANN, T. The chemistry of roasting: decoding flavor formation. In: FOLMER, B. (Ed.). The craft and science of coffee Amsterdam: Elsevier, 2017. p.273-309. DOI: https://doi.org/10.1016/B978-0-12-803520-7.00012-8
» https://doi.org/10.1016/B978-0-12-803520-7.00012-8 -
QGIS Development Team. QGIS Geographic Information System Available at: <https://www.qgis.org>. Accessed on: Nov. 22 2024.
» https://www.qgis.org -
R CORE TEAM. R: a language and environment for statistical computing. Vienna: R Foundation for Statistical Computing, 2024. Available at: <https://www.R-project.org>. Accessed on: June 28 2024.
» https://www.R-project.org -
RIBEIRO, F.C.; BORÉM, F.M.; FIGUEIREDO, L.P.; GIOMO, G.S.; MALTA, M.R. Armazenamento de café especial em acondicionamentos com atmosfera artificial. Revista Delos, v.16, p.3488-3511, 2023. DOI: https://doi.org/10.55905/rdelosv16.n48-030
» https://doi.org/10.55905/rdelosv16.n48-030 -
RSTUDIO TEAM. RStudio: integrated development for R. Boston, 2024. Available at: <https://www.rstudio.com/>. Accessed on: June 28 2024.
» https://www.rstudio.com/ -
SANTOS, W.W.V.; LIMA, K.L.B.; LUCENA, M.R. de; ARRUDA, L.L.A.L. de; OLIVEIRA, R.L. de; SILVA, M.E. dos S.; SILVA, S.P. de. Effect of different materials of filter holder on sensory profile of coffee beverages. Journal of Sensory Studies, v.39, e12929, 2024. DOI: https://doi.org/10.1111/joss.12929
» https://doi.org/10.1111/joss.12929 -
SANZ-URIBE, J.R.; YUSIANTO; MENON, S.N.; PEÑAUELA, A.; OLIVEROS, C.; HUSSON, J.; BRANDO, C.; RODRIGUEZ, A. Posthaverst processing: revealing the green bean. In: FOLMER, B. (Ed.). The craft and Science of coffee Amsterdam: Elsevier, 2017. p.51-76. DOI: https://doi.org/10.1016/B978-0-12-803520-7.00003-7
» https://doi.org/10.1016/B978-0-12-803520-7.00003-7 - SENAR. Serviço Nacional de Aprendizagem Rural. Café: cafés especiais. Brasília, 2017. 104p. (Coleção Senar, 193).
-
SOUSA, L.H.B.P. de; LUZ, J.M.R. da; SILVA, M. de C.S. da; MORELI, A.P.; VELOSO, T.G.R.; GUARÇONI, R.C.; MOREIRA, T.R.; BARROS, M.V.P.; KASUYA, M.C.M.; MARCATE, J.P.P.; BRIOSCHI JÚNIOR, D.; GOMES, W. dos S.; PEREIRA, L.L.; OLIVEIRA, E.C. da S. Relationship between sensory and microbial profiles of fermented coffee by dry and washed methods. Food Chemistry Advances, v.2, art.100259, 2023. DOI: https://doi.org/10.1016/j.focha.2023.100259
» https://doi.org/10.1016/j.focha.2023.100259 -
TASSEW, A.A.; YADESSA, G.B.; BOTE, A.D.; OBSO, T.K. Influence of location, elevation gradients, processing methods, and soil quality on the physical and cup quality of coffee in the Kafa Biosphere Reserve of SW Ethiopia. Heliyon, v.7, e07790, 2021. DOI: https://doi.org/10.1016/j.heliyon.2021.e07790
» https://doi.org/10.1016/j.heliyon.2021.e07790 -
TOPODATA. Banco de Dados Geomorfométricos do Brasil. Modelo digital de elevação 2023. Available at: htts://www.webmapit.com.br/inpe/topodata/ Accessed on: July 22 2023.
» htts://www.webmapit.com.br/inpe/topodata/ -
WANG, X.; WILLIAM, J.; FU, Y.; LIM, L.-T. Effects of capsule parameters on coffee extraction in single-serve brewer. Food Research International, v.89, p.797-805, 2016. DOI: https://doi.org/10.1016/j.foodres.2016.09.031
» https://doi.org/10.1016/j.foodres.2016.09.031 -
WARD JR, J.H. Hierarchical grouping to optimize an objective function. Journal of the American Statistical Association, v.58, p.236-244, 1963. DOI: https://doi.org/10.1080/01621459.1963.10500845
» https://doi.org/10.1080/01621459.1963.10500845 -
WORKU, M.; de MEULENAER, B.; DUCHATEAU, L.; BOECKX, P. Effect of altitude on biochemical composition and quality of green arabica coffee beans can be affected by shade and postharvest processing method. Food Research International, v.105, p.278-285, 2018. DOI: https://doi.org/10.1016/j.foodres.2017.11.016
» https://doi.org/10.1016/j.foodres.2017.11.016 - ZENEBON, O.; PASCUET, N.S.; TIGLEA, P. (Coord.). Métodos físico-químicos para análise de alimentos 4.ed., 1.ed. digital. São Paulo: Instituto Adolfo Lutz, 2008. p.105-106, 117, 468-472, 491-494, 600-601.