 Detection and counting marigold flowers using drone images and YOLOv8 in complex environments
Abstract
The manual counting of marigold (Calendula officinalis L.) flowers is a labor-intensive task that compromises the accuracy of yield estimates and optimal harvest timing, especially in large-scale fields to know the harvesting moment. This study aimed to evaluate the performance of five versions of the YOLOv8 object detection model (Nano, Small, Medium, Large, and X-Large) for detecting and counting marigold flowers using high-resolution RGB images acquired by unmanned aerial vehicle (UAV). The experimental design included image acquisition with a multispectral drone, image clipping, annotation, and model training on Google Colab with the Adam optimizer. Performance metrics such as precision, recall, mAP50, mAP50-95, and classification loss were analyzed, alongside model correlation with manual counting through Pearson’s, RMSE, MAE, and R². The Large model demonstrated the best performance, achieving over 90% precision and mAP50 and an R² of 0.895. Although the X-Large model offered similar accuracy, it required significantly more computational resources. In contrast, the small model emerged as a computationally efficient alternative with performance comparable to the larger models. The findings demonstrate the feasibility of integrating UAV-based imagery and YOLOv8 for accurate, automated flower detection, reducing subjectivity and labor in floriculture management. This approach shows promise for broader applications in precision agriculture, especially for crops with small, dense floral structures.
Keywords:
Artificial intelligence; precision agriculture; small detection; UAV
Resumo
A contagem manual de flores de calêndula (Calendula officinalis L.) é uma tarefa exigente em força de trabalho, podendo comprometer a precisão das estimativas de produtividade e a determinação do momento ideal de colheita, especialmente em áreas de grande escala. Este estudo teve como objetivo avaliar o desempenho de cinco versões do modelo de detecção de objetos YOLOv8 (Nano, Small, Medium, Large e X-Large) para a detecção e contagem de flores de calêndula utilizando imagens RGB de alta resolução adquiridas por veículos aéreos não tripulados (VANTs). O delineamento experimental incluiu a aquisição de imagens com um drone multiespectral, o recorte e a anotação das imagens, e o treinamento dos modelos no Google Colab com o otimizador Adam. Foram analisadas métricas de desempenho como precisão, recall, mAP50, mAP50-95 e perda de classificação, bem como a correlação dos modelos com a contagem manual por meio do coeficiente de Pearson, RMSE, MAE e R². O modelo Large apresentou o melhor desempenho, alcançando mais de 90% de precisão e mAP50, e um R² de 0,895. Embora o modelo X-Large tenha oferecido precisão semelhante, exigiu significativamente mais recursos computacionais. Em contraste, o modelo Small mostrou-se uma alternativa computacionalmente eficiente, com desempenho comparável aos modelos maiores. Os resultados demonstram a viabilidade da integração de imagens obtidas por VANTs e do YOLOv8 para a detecção automatizada e precisa de flores, reduzindo a subjetividade e a demanda de força de trabalho no manejo da floricultura. Essa abordagem mostra potencial para aplicações mais amplas na agricultura de precisão, especialmente em culturas com estruturas florais pequenas e densas.
Palavras-chave:
Agricultura de precisão; detecção de pequenos objetos; inteligência artificial; VANT
Introduction
Calendula officinalis L., commonly known as marigold or pot marigold, is a member of the family Asteraceae, characterized by its yellow-orange flowers valued for their antibacterial, antiseptic, culinary, and antioxidant properties which are used in medicinal and agricultural applications (Chalchat et al., 1991; Corrêa Júnior, 1994; Khalid et al., 2010. Its chemical composition includes bioactive compounds such as triterpenoid esters, polysaccharides, steroids, tannins, quinones, coumarins, flavonoids, carotenoids, amino acids, and essential oils (Al-Snafi, 2015; Ak et al., 2021).
The harvest of marigold flowers is critical for industries producing medicines, cosmetics, and oil seeds, as flower heads are the primary structures of interest (Eberle et al., 2014; Król and Paszko, 2017). Manual flower counting, essential for harvest management, is labor-intensive and prone to errors due to the small size and high density of flowers per plant leading to inaccurate yield estimations.
Recent advances in precision agriculture, such as unmanned aerial vehicles (UAVs) and deep learning have enabled automated flower detection in crops like cotton (Gossypium hirsutum L), apple (Malus domestica Borkh), soybean (Glycine max (L) Merrill), kiwifruit (Actinidia Deliciosa (A. Chev)), pear (Pyrus Communis L), tomato (Solanum lycopersicum L), and chrysanthemum (Chrysanthemum morifolium Ramant) (Ge et al., 2022; Chen et al., 2022; Qi et al., 2022; Liu et al., 2024; Tan et al., 2024; Zhao et al., 2024). While many studies rely on complex models and high-resolution ground sensors (Tan et al., 2024), these approaches are less suited for large-scale field applications. UAVs with improved resolution offer a scalable solution for field mapping supporting tasks such as disease detection, weed identification and harvest optimization (Zhang et al., 2019; Yang et al., 2019; Windrim et al., 2019; Peng et al., 2023; Bah et al., 2018). Single-stage models like the YOLO family have shown promise in automated, data-driven agricultural systems due to their efficiency and adaptability (Badgujar et al., 2024). However, few studies have explored UAV-based mapping of marigold fields using YOLO models. The combination emphasizes the potential of large-scale field mapping and detection to improve the harvest management and time, also contributing to decrease the subjectivity in counting the flowers manually in the fields generating poor estimation.
This study hypothesizes that: (i) increasing the number of parameters in YOLOv8 models enhances the accuracy and precision of marigold flower detection in UAV imagery and (ii) UAV imagery combined with YOLOv8 models enables accurate and efficient detection of marigold flowers in large-scale fields. The objective was to evaluate the performance of YOLOv8 models (Nano, Small, Medium, Large, and X-Large) for detecting Calendula Officinalis L. flowers using UAV imagery, aiming to improve harvest management and reduce reliance on labor-intensive manual methods.
Materials and Methods
High resolution images collection and processing
The Calendula Officinalis L plants were distributed across an 805 square meter area. The images were collected using the DJI Mavic 3 multispectral® drone/UAV (Shenzhen, China). The flight plan was configurated with a front and side overlap of 80% and flight height of 20 meters in automatic flight mode. To support automatic mode, the UAV was connected to the DJI D-RTK 2®, DJI (Shenzhen, China) to decrease the flight error to within a few centimeters. The ground sample distance (GSD) obtained was 0.05 meters with max resolution of 5280 x 3956 pixels and the images were exported as JPEG format. The next step after image acquisition was processing it. Thus, using the Pix4D® software, (Lausanne, Swiss) the images were processed in high quality and corrected geometrically and radiometrically to generate an orthomosaic.
Flower identification
The process to identify the marigold flower involved different softwares. The image size chosen for You Only Look Once (YoLo) version 8 model was 640 x 640 pixels. Therefore, the initial step consisted of clipping the images in QGIS® software (Hyberabad, Indian) to the specified size without compromising its quality. The second step involved the boundary box creation (annotation) using the LabelImg free code software (https://github.com/HumanSignal/labelImg) (Fig. 1). A total of 70 images were annotated with a total instance (calendula plants) number of 6,650. Thus, the next step was to split the dataset to 70%, 20%, and 10% with 49, 14, and 7 images for train, test and validation, respectively. Finally, using the Google Colab platform the divided dataset was uploaded and the YOLOv8 models were trained for 1,500 epochs.

Calendula officinalis L. clipped to 640 x 640 pixels and used as input for LabelImg (A) and labeling of calendula flowers in the open-source LabelImg software (B).
Model structure and functions
The YOLO (You Only Look Once) family represents a type of deep learning model that compiles the information through multiple layers with single-stage detection. The design across the YOLO family combines convolutional neural networks filters and layers.
The YOLOv8 model is structured in three main parts: the backbone, the neck, and the head. The backbone is based on the Cross Stage Partial Darknet (CSPDarknet) architecture, derived from Darknet (Jocher, 2022; Diwan et al., 2023), and its goal is to reduce computation time by efficiently extracting essential visual information from images. Continuing with the structure, the neck component connects the extracted elements, combining the information at different stages, which allows for the detection of objects of varying sizes within the same image (Fan et al., 2024). Finally, the head component is responsible for generating the final predictions, including the creation of bounding boxes and the classification of the detected objects. Bounding boxes are rectangular annotations used to indicate the location of an object within an image or frame. Furthermore, YOLOv8 integrates modules such as the CBS (Convolution, Batch Normalization, and SiLU Activation) block, improves feature extraction and stabilizes learning. The C2f module (Two-Stage Cross Partial Module), which makes the network lighter and more efficient; and the SPPF module (Spatial Pyramidal Grouping - Rapid), helps the model to more accurately identify objects at different scales and positions within the image.
Besides the YOLOv8 aforementioned improvements, the model is available in different sizes: Nano (N), Small (S), Medium (M), Large (L), Extra-Large (X-large). Each size differs in the numbers of parameters and computational efficiency (Table 1) which affects training time and model performance depending on the dataset and hardware limitations (Ding et al. 2024b).
You Only Look Once (YOLO) models for object detection task and the number of parameters used for each model. Adapted from Ultralytics.
Models training, test and validation
The pipeline to train the models was executed using the Google Colab environment and local runtime T4 GPU available from Google computers. The models were downloaded from Ultralytics platform (https://docs.ultralytics.com/pt/tasks/obb/) and the training parameters were configurated with Adam optimizer with an initial learning rate of 0.937 and an image size of 640 x 640 pixels. The Adam (Adaptative Moment Estimation) optimizer combine two essential parameters for learning rate optimization: Momentum (acceleration) and RMSprop (adaptability). By calculating the gradient as a function of the loss, it estimates the mean of gradients and the mean of square gradients, corrects the initial bias and update the network weights (Kingma and Ba, 2014). The initial batch size for the training was set to 16 for all models. After training, the models were evaluated on the test dataset. Finally, the validation images were manually counted and compared with the model’s predicted marigold flower counts.
Metrics and model performance evaluation
Model performance was evaluated using recall (R; equation 1), precision (P; equation 2), mean average precision at 50% Intersection over Union (IoU) threshold (mAP50; equation 3), mean average precision across IoU thresholds from 50% to 95% (mAP50-95; equation 3), and classification loss (Clsloss; equation 4), calculated for both training and validation datasets. Recall measures the model’s ability to identify all relevant objects by calculating the proportion of true positive detections (correctly detected plants) among all actual objects present, i.e. over all flowers in the images, how much the model can detect. Precision quantifies the model’s accuracy by determining the proportion of correct detections among all positive predictions, i.e. over all detections made by the model how much detection was corrected. The mAP metric evaluates overall detector performance across all classes by computing the average precision at different IoU thresholds, where mAP50 uses a single 50% threshold and mAP50-95 averages across thresholds from 50% to 95% (Padilla et al., 2020). Classification loss represents the model’s prediction error in correctly classifying objects within bounding boxes, with higher values indicating lower classification accuracy.
Recall (R), computed from true positives (TP) and false negatives (FN), measures the model’s ability to detect all actual objects present in the image. Values approaching 1 represent high detection performance, whereas values near 0 indicate the model misses most true instances.
Precision (P), computed from true positives (TP) and false positive (FP) measures the proportion of correct detections among all predicted objects. Values approaching 1 represent high accuracy with minimal false detections, whereas values near 0 indicate the model generate numerous incorrect predictions.
Where N represents the number of evaluated samples used to compute the average precision, and P(i) denotes the precision value at the i-th evaluation point. Mean Average Precision (mAP) quantifies the model’s ability to correctly detect and localize objects across all classes. The mAP50 metric uses an IoU threshold of 50%, considering a detection correct when the predicted bounding box overlaps at least 50% with the ground truth (annotated manually bounding box). The mAP50-95 provides a more comprehensive evaluation by averaging precision across IoU thresholds from 50% to 95% at 5% steps, thus penalizing less accurate localizations. Higher values approaching 1 indicate superior detection performance, whereas lower values suggest low performance in object detection and localization capability.
Classification loss (Clsloss) represents the prediction error calculated from the difference between true class labels (Yi) and model-predicted class probabilities (Ŷi) for both training and validation datasets.
Performance metrics (recall, precision, mAP50, and mAP50-95) were compared and visualized using boxplots and scatter plots, whereas Clsloss progression was analyzed using line graphs over training epochs. Statistical analyses and visualizations were conducted in R version 4.4.3.
Analysis on validation dataset
During the validation stage, the number of calendula flowers in each image was first counted manually and then compared with the results obtained automatically by the trained model. This allowed for the calculation of Pearson’s correlation coefficient, which was determined to verify the relationship between the manual and automatic counts. In addition, a linear regression analysis was performed to compare the observed (manual) and predicted (automatic) values, obtaining the coefficient of determination (R²; equation 5), root mean square error (RMSE; equation 6), and mean absolute error (MAE; equation 7).
R2 represents the determination coefficient, y is the observed values, are the predicted values and the mean values calculated from observed values. The results were expressed between 0 and 1, values close to 0 represent low precision from by the models and close to 1 high precision in counting the plants.
RMSE is the root mean square error and measures the accuracy from the models. The variable n represents the number of samples. High values indicated low accuracy between the manual and automatic values.
MAE is the mean absolute error and measure also the accuracy from the model.
Results
Despite a reduction of approximately 95% in the number of parameters when scaling down from the X-Large to the Nano version, the YOLO models tested in the present study showed similar performance for precision and recall metrics (Fig. 2). However, a comparison between the mAP metrics indicated a decrease in accuracy for mAP50. The Nano model exhibited the lowest mAP50 score, reaching approximately 0.35. This represented a decrease of 0.04 compared to the X-Large model, which achieved the highest observed value for this metric. Nevertheless, all models exhibited a significant decline in accuracy when evaluated with mAP50-95 as opposed to mAP50. The Nano model decreased by almost 0.35 while the medium showed the highest values, reaching almost 0.39. These low mAP values highlight the model’s difficulty in accurately detecting and localizing marigold flowers, suggesting confusion between true flower locations and background elements or misaligned predictions (Fig. 2).

Boxplot analysis for precision recall, mean average precision 50% and mean average precision 50% - 95% for all YOLO models, Nano, Small, Medium, Large and X-Large.
The mAP50 evaluates the overlap of 50% of the boundary box observed and detected by the model. All models reached 0.9 values for mAP50 indicating the capability in found the flowers in almost 50%. However, compared to the mAP50-95 the uncertain and low values revealed the low accuracy of the models in detecting the flowers, i.e., the background, plant architecture and field conditions could have collaborated to decrease the performance specially for light model, as Nano architecture. The results found were related to the observed for flower detection in agriculture.
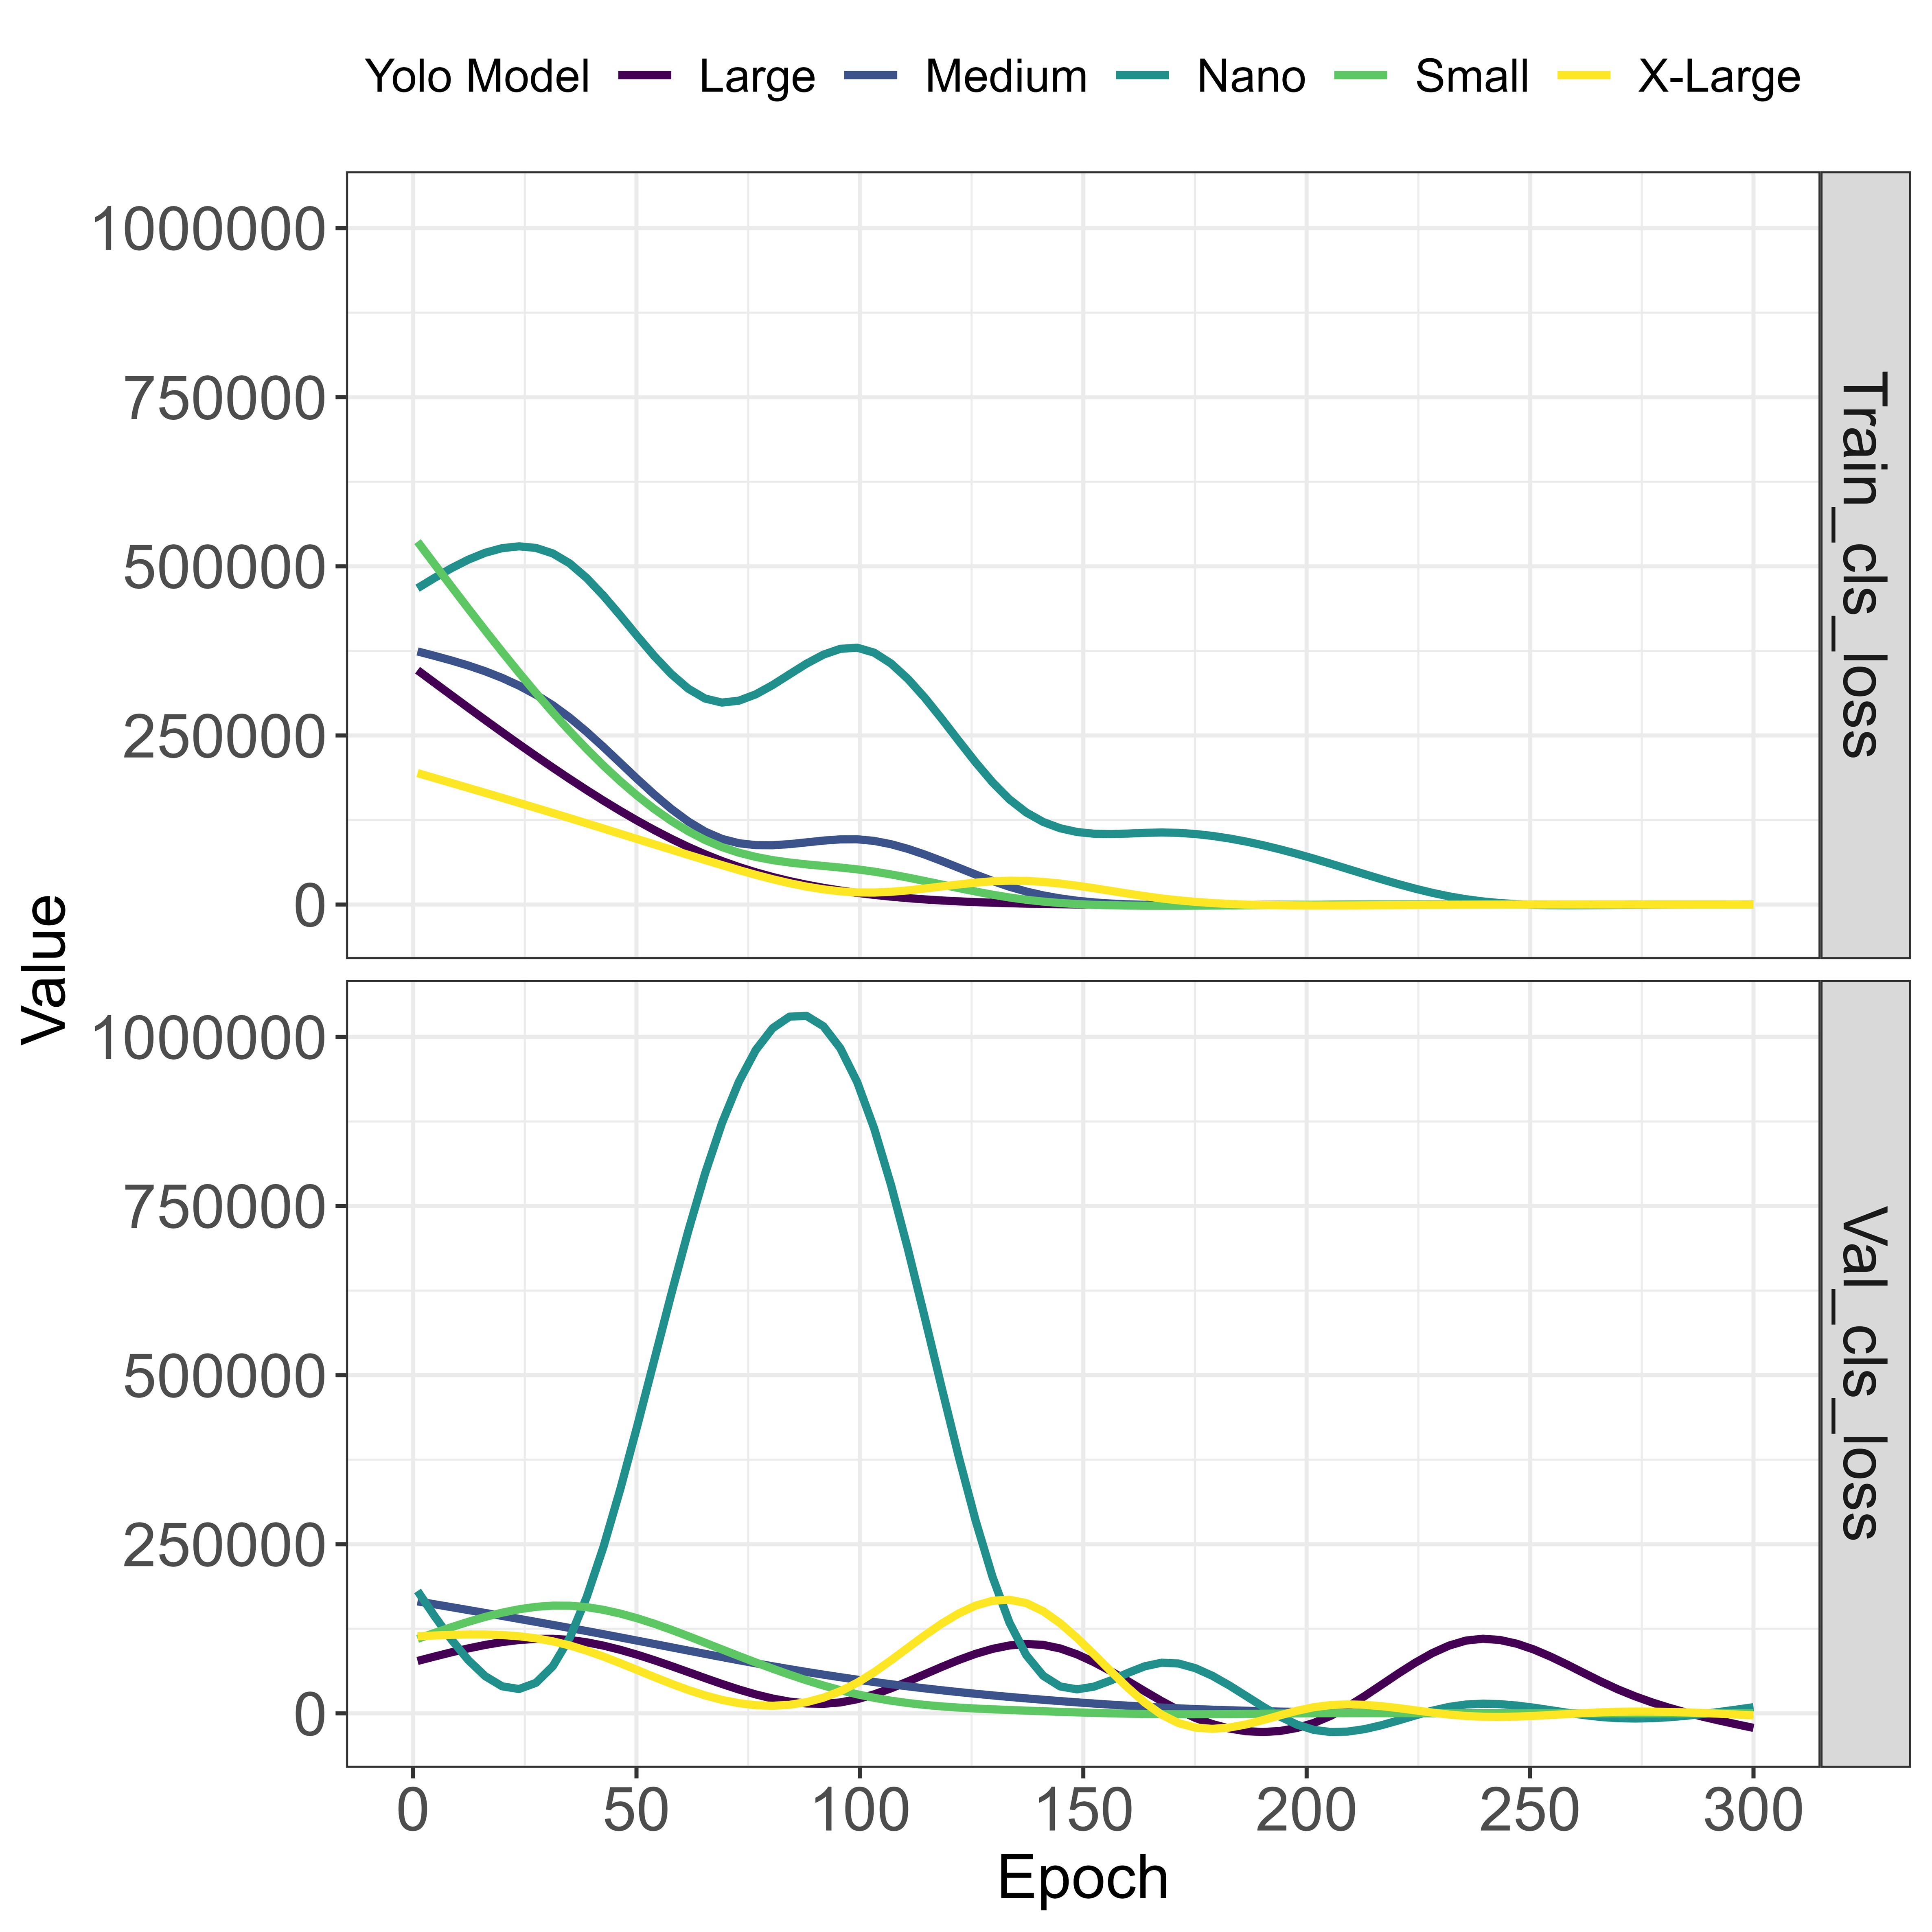
The previously observed low accuracy was also reflected in the classification loss during both the training and testing phases (Fig. 3). This metric allowed evaluation of the model’s stabilization over epochs. The results demonstrated that all models initially exhibited highest variation of classification loss, which then rapidly decreased and stabilized after approximately 300 epochs (Fig. 3). Among the models, the Small architecture demonstrated the lowest variation in classification loss across the epochs, whereas the Nano version showed the highest variation during both training and testing. The X-Large model began with the lowest loss values, highlighting the efficiency of its larger number of parameters in the initial stages. However, significant variations were observed during its validation phase. Bigger models as observed for X-large and Large present a quick convergence at initial epochs compared to the smallest model Nano. However, the dataset size can contribute to the model’s performance as observed for the Nano architecture that present similar classification loss when compared to the highest models like large and X-large. Although the Nano model stabilizes more slowly and requires more epochs to converge, once it becomes stable, its final loss is similar to that of the larger models, as shown in the Fig. 3.

Behavior of classification loss during the training and validation phases for Nano, Small, Medium, Large, and X- Large architectures as a function of epochs.
The five-architectures evaluated, combined with the Adam optimizer, considered different levels of parameters and efficiency as observed during the training and testing steps. At the beginning of the training, the Small and X-Large architectures showed the best performance for precision, recall, and mAP (Fig. 4), demonstrating the importance of the balance among the convolutional filters, layers, and activation functions. The Nano version, due to its lightweight architecture, presents the highest variations as observed in Figure 4, demonstrating high sensitivity to the initialization of the weights. Thus, the number of epochs to reach the highest values for precision, recall, and mAP was higher than the other models.

Scatter plots to evaluate the accuracy, recovery, and average mean accuracy of the Yolo Nano, Small, Medium, Large, and Extra-Large models over 300 epochs.
According to the analysis of five YOLO architectures, including the Large and Extra-Large models, it was observed that larger-scale models achieve superior performance due to their rapid convergence from the initial weights. However, the high computational demands associated with the greater number of parameters, especially in the Extra-Large model, make this a crucial criterion to consider during model selection. In this study, the Small model achieved comparable performance to the Extra-Large version, despite having 80% fewer parameters. Therefore, tasks requiring the highest possible accuracy and precision in flower detection can be considered, regardless of the computational demands of the Extra-Large and Large models. Thus, the use of lightweight models like the Small architecture is considered a practical option, given its precision and accuracy.
Comparing the observed and predicted values, RMSE, MAE, and R² were calculated (Fig. 5). The Large, Medium, and X-Large models presented the highest performance, with R² values of 0.895, 0.860, and 0.835, respectively. Additionally, the MAE and RMSE values ranged from 4 to 7 flowers, with the lowest errors observed in the Large, Medium, and X-Large models. In contrast, the Nano and Small models showed the highest RMSE values (9 and 8 flowers, respectively) and the highest MAE values (6 and 7 flowers) when compared to the manual validation. These results followed the same trend observed for the correlation results, indicating that a greater number of parameters increases model performance, as observed in the Large model.
The second aspect evaluated in the regression lines was the width of the gray band surrounding the red line. This band represents the confidence interval of the relationship between the values obtained through manual validation and those predicted by the YOLO models. A wider gray band indicates greater variability between the x and y axes, suggesting that the model exhibits significant inconsistency in object detection. Greater variability is associated with lower model performance, leading to greater uncertainty in flower identification in the images. As a result, the model may misclassify objects that are not flowers or fail to detect actual flowers.

Linear regression, determination coefficient (R2), Root Mean Square Error (RMSE) and Mean Absolute Error (MAE) comparing the validation (manual) and predicted by the models Nano, Small, Medium, Large and X-large for test dataset.
The results obtained are comparable to previous studies applying deep learning for flower and fruit detection in agriculture. For instance, a similar study using YOLOv5 and DeepSORT for rose bud counting reported a coefficient of determination (R²) of 0.997 for open buds and 0.8973 for closed buds, indicating a strong correlation with manual methods as reported by Herrera et al. (2024). These findings underscore the reliability of computer vision and deep learning techniques for automated plant monitoring.
In addition to the differences observed between the models and the manual method, manual flower counting required high levels of subjectivity, skill, and concentration. A single calendula plant can produce a large number of flowers, making counting difficult and increasing the likelihood of human error. Furthermore, large fields can further reduce the efficiency and overall performance of the count. Therefore, flower counting becomes challenging, and the use of high-performance models such as those in the YOLO family can improve efficiency, with errors of fewer than 5 flowers per plant (Fig. 5). These models maintain high accuracy even in scenarios with small objects and under conditions where manual counting is prone to errors (Hu et al., 2023).
Discussions
The integration of deep learning with high-resolution images, particularly those obtained from unmanned aerial vehicles (UAVs), has advanced significantly in agricultural applications, such as flower counting (Ge et al., 2022), maturity classification (Bazame et al., 2021), fruit diameter estimation (Liu et al., 2024 ), disease identification (Yarak et al., 2021), and cotton flower detection (Tan et al., 2024). These advances demonstrate the great potential of computer vision for automated crop monitoring. However, challenges remain in achieving consistent accuracy, especially when detecting small, visually complex, or morphologically variable objects, such as flowers.
The performance of object detection models varies depending on task complexity, object size, and environmental conditions. For instance, apple flower detection studies reported high precision with YOLOv5 Small, though accuracy decreased for small buds due to feature loss (Chen et al., 2022). In contrast, tomato flower detection with YOLOv5 yielded only 50% accuracy (Egi et al., 2022), and pear flower counting using random forest models reported R² values of 0.41 - 0.51, partly due to frost damage (Vandermaeseri et al., 2021). Chrysanthemum flower detection further demonstrated the impact of lighting, with a CNN-based TC-YOLO model outperforming YOLOv5 Small in varied conditions (Qi et al., 2022), while controlled settings yielded 98% precision for rose identification using InceptionV3 compared to 94.1% in field conditions with YOLOv5 (Herrera et al., 2024).
In the present study, YOLOv8 Medium and YOLOv8 Large achieved superior performance for marigold flower detection using drone imagery, with precision above 90% and mAP50 of 92%. However, YOLOv8 Nano underperformed (75% precision) compared to YOLOv5 Small in prior studies, potentially due to configuration differences (Liu et al., 2023). These results suggest that YOLOv8’s advanced architecture, combined with UAV imagery, offers robust solutions for complex environments like marigold flowering, outperforming previous tomato and pear flower detection efforts.
Flower detection is hindered by morphological complexity, small object size, and environmental variability. Marigold flowers, for instance, exhibit dynamic stages (anthesis, formation, senescence) influenced by plant variety and conditions like temperature and frost (Correa Junior et al., 1994; Citadini-Zanette et al., 2012; Ossipov et al., 2024). Traditional manual counting methods are labor-intensive and prone to human error, underscoring the need for automated solutions. While UAVs facilitate rapid mapping of large areas, few studies have explored their potential for flower detection, particularly for smaller or less abundant inflorescences (Junos et al., 2022; Guo et al., 2025). Studies on flower detection highlight the potential of advanced models, such as the larger YOLOv8 variants (e.g., Large and X-Large) (Zhao et al., 2024; Bai et al., 2023; Li et al., 2022; Zhang et al., 2025) and other convolutional neural network (CNN) architectures like Mask-RCNN and Fast-RCNN (Mann et al., 2022; Shang et al., 2023). These models require significant computational resources due to their complex architecture, which typically involve many parameters. In the YOLOv8 family, increasing the number of parameters, such as adding layers, convolutional filters, or connections, improves the model’s ability to accurately detect complex features like shapes, textures, and spatial relationships in images.
This study demonstrates that integrating YOLOv8 with UAV imagery enables accurate marigold flower detection. The high precision (90%) and mAP50 (92%) achieved with YOLOv8m and YOLOv8l highlight the efficacy of this approach in complex field environments. Compared to smartphone-based strawberry flower detection (87.4% - 90.5% precision; Bai et al., 2024) and kiwifruit flower detection (mAP 93.99-97.61; Jing et al., 2024; Li et al., 2023), that combine high resolution from terrestrial cameras, the finds observed in the present study highlights the UAV capability, despite the challenges of smaller flower sizes. Future research will focus on classifying marigold flowers into developmental stages (floral bud, fully open, senescence) to further refine harvest timing predictions. Additionally, optimizing YOLOv8 configurations for small object detection and exploring multi-sensor UAV data could enhance performance across diverse agricultural settings.
Conclusions
The results demonstrate that the integration of unmanned aerial vehicles (UAVs) and artificial intelligence offers a viable approach for monitoring marigold flowers. These findings confirm the first hypothesis, indicating that YOLOv8 models with a higher number of parameters, such as the Large and X-Large architectures, achieve greater precision and stronger correlation with ground truth data. In contrast, smaller models, including Nano and Small, provide greater stability but lower overall precision; therefore, model selection depends on specific application requirements, balancing precision, stability, and computational efficiency.
Furthermore, the results support the second hypothesis, demonstrating that the use of UAV-acquired imagery combined with YOLOv8 models enables accurate detection of marigold flowers under field conditions. These findings highlight the potential of computer vision techniques, which can replace manual counting methods, thereby improving the efficiency and reliability of crop monitoring.
Acknowledgments
The authors wish to express their sincere gratitude to the Foundation for Research Support of the State of Minas Gerais (FAPEMIG), the Coordination for the Improvement of Higher Education Personnel (CAPES), the National Council for Scientific and Technological Development (CNPq), and the Universidad Federal de Lavras (UFLA) for their indispensable support in the development of this project.
Data availability statement
Data will be made available upon request to the authors.
References
-
AK, G.; ZENGIN, G.; CEYLAN, R.; MAHOMOODALLY, M.F.; JUGREET, S.; MOLLICA, A.; STEFANUCCI, A. Chemical composition and biological activities of essential oils from Calendula officinalis L. flowers and leaves. Flavour Fragrance Journal, v.36, p.554-563, 2021. https://doi.org/10.1002/ffj.3661
» https://doi.org/10.1002/ffj.3661 - AL-SNAFI, A.E. The chemical constituents and pharmacological effects of Calendula officinalis - A review. Indian Journal of Pharmaceutical Science & Research, v.5, n.3, p.172-185, 2015.
-
BADGUJAR, C.H.; POULOSE, A.; GAN, H. Agricultural object detection with You Only Look Once (YOLO) Algorithm: A bibliometric and systematic literature review. Computers and Electronics in Agriculture, v.223, 109090, 2024. https://doi.org/10.1016/j.compag.2024.109090
» https://doi.org/10.1016/j.compag.2024.109090 -
BAH, M.D.; DERICQUEBOURG, E.; HAFIANE, A.; CANALS, R. Deep learning based classification system for identifying weeds using high-resolution UAV Imagery. Intelligent Computing, v.2, p.176-187, 2018. https://doi.org/10.1007/978-3-030-01177-2_13
» https://doi.org/10.1007/978-3-030-01177-2_13 -
BAI, Y.; YU, J.; YANG, S.; NING, J. An improved YOLO algorithm for detecting flowers and fruits on strawberry seedlings. Biosystems Engineering, v.237, p.1-12, 2024. https://doi.org/10.1016/j.biosystemseng.2023.11.008
» https://doi.org/10.1016/j.biosystemseng.2023.11.008 -
BAZAME, H.C.; MOLIN, J.P.; ALTHOFF, D.; MARTELLO, M. Detection, classification, and mapping of coffee fruits during harvest with computer vision. Computers and Electronics in Agriculture, v.183, 106066, 2021. https://doi.org/10.1016/j.compag.2021.106066
» https://doi.org/10.1016/j.compag.2021.106066 -
CHALCHAT, J.C.; GARRY, R.P.H.; MICHET, A. Chemical composition of essential oil of Calendula officinalis L. (Pot Marigold). Flavour and Fragrance Journal, v.6, p.189-192, 1991. https://doi.org/10.1002/ffj.2730060306
» https://doi.org/10.1002/ffj.2730060306 -
CHEN, Z.; SU, R.; WANG, Y.; CHEN, G.; WANG, Z.; YIN, P. WANG, J. Automatic estimation of apple orchard blooming levels using the improved YOLOv5. Agronomy, v.12(10), p.2483, 2022. https://doi.org/10.3390/agronomy12102483
» https://doi.org/10.3390/agronomy12102483 -
CITADINI-ZANETTE, V.; NEGRELLE, R.R.B.; BORBA, E.T. Calendula officinalis L. (Asteraceae): aspectos botânicos, ecológicos e usos. Visão Acadêmica, v.13, n.1, p.31261-31273, 2012. https://doi.org/10.5380/acd.v13i1.30013
» https://doi.org/10.5380/acd.v13i1.30013 - CORRÊA JÚNIOR, C.; MING, L.C.; SCHEFFER, M.C. Cultivo de plantas medicinais, condimentares e aromáticas. Jaboticabal: FUNEP, 1994.
-
DIWAN, T.; ANIRUDH, G.; TEMBHURNE, J.V. Object detection using YOLO: challenges, architectural successors, datasets and applications. Multimedia Tools and Applications, v.82, p.9243-9275, 2023. https://doi.org/10.1007/s11042-022-13644-y
» https://doi.org/10.1007/s11042-022-13644-y -
EBERLE, C.A.; FORCELLA, F.; GESCH, R.; PETERSON, D.; EKLUND, J. Seed germination of calendula in response to temperature. Industrial Crops and Products, v.52, p.199-204, 2014. https://doi.org/10.1016/j.indcrop.2013.10.031
» https://doi.org/10.1016/j.indcrop.2013.10.031 -
EGI, Y.; HAJYZADEH, M.; EYCEYURT, E. Drone-computer communication based tomato generative organ counting model using YOLO V5 and deep-sort. Agriculture, v.12, p.1290, 2022. https://doi.org/10.3390/agriculture12091290
» https://doi.org/10.3390/agriculture12091290 -
FAN, Z.; QIN, Z.; LIU, W.; CHEN, M.; QIU, Z. SS-YOLOv8: A lightweight algorithm for surface litter detection. Applied Sciences, v.14, n.20, p.9283, 2024. https://doi.org/10.3390/app14209283
» https://doi.org/10.3390/app14209283 -
GE, Y.; LIN, S.; ZHANG, Y.; LI, Z.; CHENG, H.; DONG, J.; SHAO, S.; ZHANG, J.; QI, X.; WU, Z. Tracking and counting of tomato at different growth period using an improving YOLO-deepsort network for inspection robot. Machines, v.10, n.6, p.489, 2022. https://doi.org/10.3390/machines10060489
» https://doi.org/10.3390/machines10060489 -
GUO, H.; CHEN, H.; WU, T. MSDP-Net: A YOLOv5-based safflower corolla object detection and spatial positioning network. Agriculture, v.15, n.8, p.855, 2025. https://doi.org/10.3390/agriculture15080855
» https://doi.org/10.3390/agriculture15080855 -
HERRERA, D.; ESCUDERO-VILLA, P.; CÁRDENAS, E.; ORTIZ, M.; VARELA-ALDÁS, J. Combining image classification and unmanned aerial vehicles to estimate the state of explorer roses. AgriEngineering, v.6, n.2, p.1008-1021, 2024. https://doi.org/10.3390/agriengineering6020058
» https://doi.org/10.3390/agriengineering6020058 -
HU, J.; FAN, C.; WANG, Z.; RUAN, J.; WU, S. Fruit detection and counting in apple orchards based on improved YOLOv7 and multi-object tracking methods. Sensors, v.23, n.13, p.5903, 2023. https://doi.org/10.3390/s23135903
» https://doi.org/10.3390/s23135903 -
JING, R.; NIU, Q.; TIAN, Y.; ZHANG, H.; ZHAO, Q.; LI, Z.; ZHOU, X.; LI, D. Sunflower-YOLO: Detection of sunflower capitula in UAV remote sensing images. European Journal of Agronomy, v.160, 127332, 2024. https://doi.org/10.1016/j.eja.2024.127332
» https://doi.org/10.1016/j.eja.2024.127332 -
JOCHER, G. Ultralytics/yolov5: v7.0 - YOLOv5 SOTA realtime instance segmentation. GitHub, 2022. Available at: <Available at: https://github.com/ultralytics/yolov5 >. Acessed on: 26 fev. 2026.
» https://github.com/ultralytics/yolov5 -
JUNOS, M.H.; KHAIRUDDIN, A.S.M.; THANNIRMALAI, S.; DAHARI, M. Automatic detection of oil palm fruits from UAV images using an improved YOLO model. The Visual Computer, v.38, p.2341-2355, 2022. https://doi.org/10.1007/s00371-021-02116-3
» https://doi.org/10.1007/s00371-021-02116-3 -
KHALID, K.A.; SILVA, J.A.T. Yield, essential oil and pigment content of Calendula officinalis L. flower heads cultivated under salt stress conditions. Scientia Horticulturae, v. 126, n. 2, p.297-305, 2010. https://doi.org/10.1016/j.scienta.2010.07.023
» https://doi.org/10.1016/j.scienta.2010.07.023 -
KINGMA, D.P.; BA, J. ADAM: A Method for Stochastic Optimization. The 3rd International Conference for Learning Representations, v.9, 2014. https://doi.org/10.48550/arXiv.1412.6980
» https://doi.org/10.48550/arXiv.1412.6980 -
KRÓL, B.; PASZKO, T. Harvest date as a factor affecting crop yield, oil content and fatty acid composition of the seeds of calendula (Calendula officinalis L.) cultivars. Industrial Crops and Products, v.97, p.242-251, 2017. https://doi.org/10.1016/j.indcrop.2016.12.029
» https://doi.org/10.1016/j.indcrop.2016.12.029 -
LI, G.; SUO, R.; ZHAO, G.; GAO, C.; FU, L.; SHI, F.; DHUPIA, J.; LI, R.; CUI, Y. Real-time detection of kiwifruit flower and bud simultaneously in orchard using YOLOv4 for robotic pollination. Computers and Electronics in Agriculture, v.193, p.106641, 2022. https://doi.org/10.1016/j.compag.2021.106641
» https://doi.org/10.1016/j.compag.2021.106641 -
LI, J.; LI, Y.; QIAO, J.; LI, L.; WANG, X.; YAO, J.; LIAO, G. Automatic counting of rapeseed inflorescences using deep learning method and UAV RGB imagery. Frontiers Plant Science, v.14, p.1101143, 2023. https://doi.org/10.3389/fpls.2023.1101143
» https://doi.org/10.3389/fpls.2023.1101143 -
LI, W.; FU, H.; YU, L.; CRACKNELL, A. deep learning based oil palm tree detection and counting for high-resolution remote sensing images. Remote Sensing, v.9, n.1, p. 22, 2017. https://doi.org/10.3390/rs9010022
» https://doi.org/10.3390/rs9010022 -
LIU, J.; ZHAO, G.; LIU, S.; LIU, Y.; YANG, H.; SUN, J.; YAN, Y.; FAN, G.; WANG, J.; ZHANG, H. New Progress in intelligent picking: online detection of apple maturity and fruit diameter based on machine vision. Agronomy, v.14, n.4, p.721, 2024. https://doi.org/10.3390/agronomy14040721
» https://doi.org/10.3390/agronomy14040721 -
LIU, Q.; ZHANG, Y.; YANG, G. Small unopened cotton boll counting by detection with MRF-YOLO in the wild. Computers and Electronics in Agriculture, v.204, p.107576, 2023. https://doi.org/10.1016/j.compag.2022.107576
» https://doi.org/10.1016/j.compag.2022.107576 -
MANN, H.M.R.; LOSIFIDIS, A.; JEPSEN, J.U.; WELKER, J.M.; LOONEN, M.J.J.E.; HOYE, T.T. Automatic flower detection and phenology monitoring using time-lapse cameras and deep learning. Remote Sensing in Ecology and Conservation, v.8, n.6, p.765-777, 2022. https://doi.org/10.1002/rse2.275
» https://doi.org/10.1002/rse2.275 -
OSSIPOV, V.; KHAZIEVA, F.; BALEEV, D.; SALMINEN, J.-P.; SIDELNIKOV, N. Comparative metabolomics of ligulate and tubular flowers of two cultivars of Calendula officinalis L. Metabolites, v.14, n.3, p.140, 2024. https://doi.org/10.3390/metabo14030140
» https://doi.org/10.3390/metabo14030140 -
PADILLA, R.; NETTO, S.L.; SILVA, E.A.B. A survey on performance metrics for object-detection algorithms. International Conference on Systems, Signals and Image Processing (IWSSIP), p.237-242, 2020. https://doi.org/10.1109/IWSSIP48289.2020.9145130
» https://doi.org/10.1109/IWSSIP48289.2020.9145130 -
PENG, J.; WANG, D.; ZHU, W.; YANG, T.; LIU, Z.; REZAEI, E.E.; LI, J.; SUN, Z.; XIN, X. Combination of UAV and deep learning to estimate wheat yield at ripening stage: The potential of phenotypic features. International Journal of Applied Earth Observation and Geoinformation, v.124, p.103494, 2023. https://doi.org/10.1016/j.jag.2023.103494
» https://doi.org/10.1016/j.jag.2023.103494 -
QI, C.; GAO, J.; PEARSON, S.; HARMAN, H.; CHEN, K.; SHU, L. Tea chrysanthemum detection under unstructured environments using the TC-YOLO model. Expert Systems with Applications, 193, 116473, 2022. https://doi.org/10.1016/j.eswa.2021.116473
» https://doi.org/10.1016/j.eswa.2021.116473 -
SHANG, Y.; XU, X.; JIAO, Y.; WANG, Z.; HUA, Z.; SONG, H. Using lightweight deep learning algorithm for real-time detection of apple flowers in natural environments. Computers and Electronics in Agriculture, p.107765, 2023. https://doi.org/10.1016/j.compag.2023.107765
» https://doi.org/10.1016/j.compag.2023.107765 -
TAN, C.; SUN, J.; PATERSON, A.H.; SONG, H.; LI, C. Three-view cotton flower counting through multi-object tracking and RGB-D imagery. Biosystems Engineering, v.246, p.233-247, 2024. https://doi.org/10.1016/j.biosystemseng.2024.08.010
» https://doi.org/10.1016/j.biosystemseng.2024.08.010 -
VANDERMAESERI, J.; ROMBOUTS, B.; DELALIEUX, S.; BYLEMANS, D.; REMY, S. Drone-acquired data in support of Belgian fruit production. IEEE International Geoscience and Remote Sensing Symposium IGARSS, p.6292-6295, 2021. https://doi.org/10.1109/IGARSS47720.2021.9554559
» https://doi.org/10.1109/IGARSS47720.2021.9554559 -
WINDRIM, L.; BRYSON, M.; MCLEAN, M.; RANDLE, J.; STONE, C. Automated mapping of woody debris over harvested forest plantations using UAVs, High-Resolution Imagery, and Machine Learning. Remote Sensing, v.11, n.6. 2019. https://doi.org/10.3390/rs11060733
» https://doi.org/10.3390/rs11060733 -
YANG, Q.; SHI, L.; HAN, J.; ZHA, Y.; ZHU, P. Deep convolutional neural networks for rice grain yield estimation at the ripening stage using UAV-based remotely sensed images. Field Crops Research, v.235, p.142-153, 2019. https://doi.org/10.1016/j.fcr.2019.02.022
» https://doi.org/10.1016/j.fcr.2019.02.022 -
YARAK, K.; WITAYANGKURN, A.; KRITIYUTANONT, K.; ARUNPLOD, C.; SHIBASAKI, R. Oil palm tree detection and health classification on high-resolution imagery using deep learning. Agriculture, v.11, n.2, p.183, 2021. https://doi.org/10.3390/agriculture11020183
» https://doi.org/10.3390/agriculture11020183 -
ZHANG, S., YANG, Y., TU, L., FU, T., CHEN, S., CEN, F., YANG, S.; ZHAO, Q.; GAO, Z.; HE, T. Comparison of YOLO-based sorghum spike identification detection models and monitoring at the flowering stage. Plant Methods, v.21, p.20, 2025. https://doi.org/10.1186/s13007-025-01338-z
» https://doi.org/10.1186/s13007-025-01338-z -
ZHANG, X.; HAN, L.; DONG, Y.; SHI, Y.; HUANG, W.; HAN, L.; GONZÁLEZ-MORENO, P.; MA, H.; YE, H.; SOBEIH, T. A Deep learning-based approach for automated yellow rust disease detection from high-resolution hyperspectral UAV images. Remote Sensing, v.11, n.3, p.1554, 2019. https://doi.org/10.3390/rs11131554
» https://doi.org/10.3390/rs11131554 -
ZHAO, K.; LI, J; SHI, W.; QI, L.; YU, C.; ZHANG, W. Field-based soybean flower and pod detection using an improved YOLOv8-VEW Method. Agriculture, v.14, n.8, p.1423, 2024. https://doi.org/10.3390/agriculture14081423
» https://doi.org/10.3390/agriculture14081423
Edited by
-
Editor:
Leosane Cristina Bosco (Universidade Federal de Santa Catarina, Brasil)