Ocean-to-nearshore circulation patterns around Curaçao: a southern Caribbean reef island exposed to distinct flow regimes
ABSTRACT
Shallow-water coral reef ecosystems are positioned at the critical interface between terrestrial and marine environments, where ocean circulation patterns control the delivery and distribution of nutrients and land-derived substances. This study examines three-dimensional circulation patterns around Curaçao, a southern Caribbean reef island, using Lagrangian particle tracking analysis with the SCARIBOS hydrodynamic model for the period 2020-2024. We analyze two distinct surface flow regimes previously identified around the island: NW-flow periods dominated by the northwestward Caribbean Surface Current, and EDDY-flow periods characterized by cyclonic eddies or low-energy conditions. These regimes create contrasting patterns in horizontal surface circulation and vertical exchange, with significant differences in surface flow direction and enhanced upwelling during EDDY-flow conditions. However, analysis of offshore-to-nearshore connectivity using conditional pathways reveals that these large-scale surface regimes have no apparent influence on the delivery of deeper waters to nearshore coral reef areas. Spatial analysis reveals that volumetric transport decreases from east to west along the southern coastline. The West Point segment exhibits the lowest horizontal transport but the highest vertical exchange, receiving 48% of its volume transport from subsurface layers, contrasting with other segments where surface volume transport dominates (75-87%). These findings demonstrate that three-dimensional circulation patterns create spatially variable conditions for water renewal, nutrient delivery, and thermal regulation, improving our understanding of coral reef ecosystem dynamics and supporting reef management strategies.
Keywords:
Hydrodynamics; Coral reefs; Coastal upwelling; Lagrangian particle tracking; Caribbean Sea
INTRODUCTION
Coral reef ecosystems around tropical islands are simultaneously exposed to oceanic circulation patterns and terrestrial inputs. These include anthropogenic influences such as land-derived nutrients and pollutants from sewage systems and groundwater (e.g., Richmond, 1993; Painter et al., 2023; Wear and Thurber, 2015). The exchange between offshore and nearshore waters controls the delivery and distribution of nutrients and pollutants to nearshore coral reef areas, as well as the rate of removal of these substances, ultimately determining the resilience and adaptive capacity of these ecosystems (Lowe and Falter, 2015; Winter et al., 2020).
The range of physical oceanographic conditions under which coral reefs thrive is vast, from very strong wave-energetic environments to more tidally dominated conditions (Falter et al., 2013; Monismith, 2007). However, local variations in these processes cannot be fully understood through open-ocean circulation patterns alone. Offshore ocean dynamics interacting with islands result in processes that affect nutrient availability (Gove et al., 2016), dilution (Nelson et al., 2011), transport of land-derived substances (Devlin and Brodie, 2005), and upwelling-driven cooling (Rogers et al., 2022). Despite the recognized importance of these ocean-reef interactions, our quantitative understanding of how coral reefs are connected to the surrounding ocean remains limited (Lowe and Falter, 2015). This knowledge gap stems from both the complex, multi-scale nature of these interactions and the lack of studies that examine coral reef ecosystems across multiple spatial scales, from large-scale ocean circulation down to reef site scales.
Coastal upwelling represents a particularly important mechanism among these island-ocean interactions. It delivers subsurface nutrients to reef environments while also affecting the transport and dilution of terrestrial inputs (Gove et al., 2006; Silva et al., 2021). Beyond nutrient delivery, coastal upwelling can induce substantial cooling of surface waters, creating important thermal refugia that potentially reduce bleaching effects in warming oceans (Randall et al., 2020; Wall et al., 2015). However, the occurrence and spatial patterns of upwelling around tropical reef islands remain poorly characterized.
To investigate these island-ocean interaction processes, our study focuses on the small tropical island of Curaçao and its adjacent counterpart Klein Curaçao, situated in the southern Caribbean Sea at 12°N latitude and 69°W longitude. The island is known for its pristine and well-preserved shallow-water fringing reefs along its southern coastline, which are rapidly declining (Bak et al., 2005; Vermeij et al., 2011; Waitt Institute, 2017). Previous studies of Curaçao have examined various aspects of coral reef and land-sea interactions. Kruijssen et al. (2024) emphasized the importance of groundwater flow as a pathway for terrestrial nutrient and pollutant transport into the ocean, Sánchez Barranco et al. (2025b) highlighted how bays concentrate terrestrial nutrients and facilitate their seasonal transport to coral reefs, and Steward et al. (2025) stressed the importance of spatial planning for the future of the island’s coral reefs. Yet, gaps remain in our understanding of three-dimensional ocean circulation patterns and their interaction with the island’s nearshore waters.
Bertoncelj et al. (2025a) studied coastal connectivity, demonstrating much stronger connectivity between different parts of the island during cyclonic eddy events, that occurred at least a few months each year within the studied period of 2020-2024. Enhanced intra-island connectivity may be critical for larval transport, nutrient distribution, and the dispersal of land-based pollutants. However, surface dynamics alone do not provide a complete understanding of the island’s ocean-reef interaction processes, as important mechanisms such as vertical exchange have not yet been studied.
In this study, we use the 3D version of the hydrodynamic model SCARIBOS (Bertoncelj et al., 2025a) and apply the Parcels framework to study Lagrangian trajectories using ‘conditional pathways.’ This approach, previously applied successfully in studies such as Van Sebille et al. (2013, 2014), Tamsitt et al. (2017), and Yit Sen Bull and Van Sebille (2016), provides the flexibility to select specific pathways that address our research questions. Building on the work of Bertoncelj et al. (2025a), this study aims to address these knowledge gaps by examining the full three-dimensional ocean circulation around Curaçao. We aim to answer the following research questions: (1) What are the dominant 3D flow pathways around Curaçao between 2020 and 2024? (2) What is the temporal variability of offshore-to-nearshore connectivity? (3) How spatially variable is the offshore-to-nearshore connectivity? Understanding these circulation patterns will improve our ability to predict coral reef responses to future environmental changes and develop effective management strategies for small island systems.
METHODS
WATER MASSES AROUND CURAÇAO
Curaçao is located at 12°N latitude and 69°W longitude in the southern Caribbean Sea, approximately 60 km north of Venezuela (Figure 3A). The island measures 61 km in length and 14 km at its widest point, with Klein Curaçao located 10 km to the southeast across an 800 m deep channel (Figure 1A). The bathymetry around Curaçao varies significantly, with steep slopes on the southern coastline and more gradual slopes along the northern coastline (Figure 1A). Curaçao is exposed to the strong Caribbean Surface Current that flows northwestward along the island. Besides this strong flow, the island also often experiences periods of low-energy flow conditions. During these periods, cyclonic eddies often have a strong influence on surface currents and the distribution of land-derived substances around the island (Bertoncelj et al., 2025a).
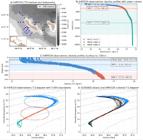
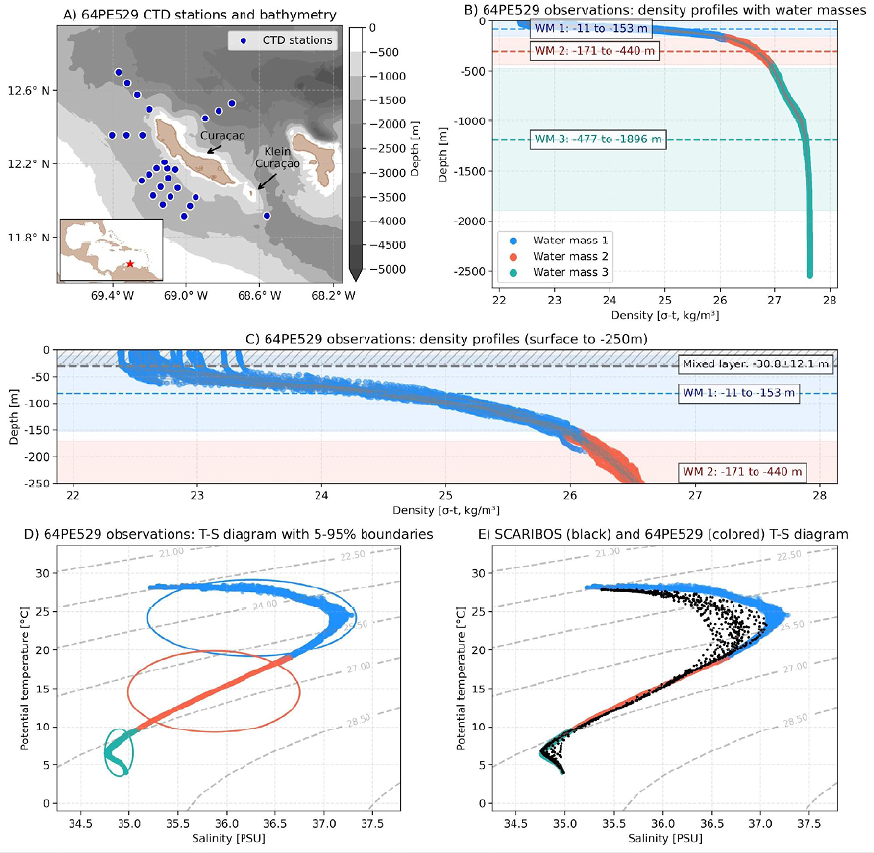
Water mass structure and model comparison. (A) Geographic locations of CTD stations with bathymetry collected during RV Pelagia, together with a zoomed-out map of the Caribbean Sea where the location of Curaçao is indicated; (B) density-depth profiles showing the three identified water masses with 5th and 95th percentile boundaries, in which Water Mass 1 corresponds to Caribbean Surface Water, Water Mass 2 corresponds to Subtropical Underwater and Water Mass 3 corresponds to Western North Atlantic Central Water; (C) surface density profile with the mixed layer depth indicated; (D) temperature-salinity diagram of CTD profiles; and (E) temperature-salinity diagram from the SCARIBOS model output at corresponding locations during 4-22 January 2024 (black), together with the temperature-salinity diagram of CTD profiles (colored).
The coastal water masses in the region around Curaçao have been characterized in previous studies (Corredor and Morell, 2001; Hernández-Guerra and Joyce, 2000; Van Duyl et al., 2024), which identified three primary layers: Caribbean Surface Water (CSW; 0 to -50 m), Subtropical Underwater (STUW; -50 to -200 m), and Western North Atlantic Central Water (WNACW; <-200 m). In this study, we will analyze how the water in these layers moves. To do this, we first need to define the depth extents of these layers in our own model.
We analyzed CTD data from an expedition conducted with RV Pelagia from January 4 to January 22, 2024 (expedition 64PE529), to determine appropriate depth layers for Lagrangian particle analysis (Figure 1B). Our focus is exclusively on offshore CTD stations located in waters deeper than 1000 m to characterize water masses representative of offshore regions, where most of our experimental domain lies. We excluded coastal stations because terrestrial processes such as freshwater runoff and groundwater discharge introduce spatial and temporal variability in temperature and salinity that the model does not represent, making direct comparisons with nearshore observations difficult to interpret.
To determine offshore water mass structure from our own dataset, we applied K-means clustering (e.g., Jin et al., 2023) on the CTD data with three clusters. We then computed the 5th and 95th percentile depth boundaries for each cluster and identified the mixed layer depth based on the density profile. Figure 1 shows the resulting water mass analysis and compares our CTD observations with SCARIBOS model data from the same period (Figure 1E).
Three distinct water masses were identified from the CTD observations:
-
Caribbean Surface Water (CSW, extending to -153 m at the lower 95th percentile)
-
Subtropical Underwater (STUW, spanning -171 to -440 m between 5th-95th percentiles)
-
Western North Atlantic Central Water (WNACW, deeper than -477 m)
As shown in Figure 1C, the mixed layer from the CTD observations is relatively shallow, reaching -30.8 ± 12.1 m, and is contained within the CSW. These mixed layer depths are in good agreement with Valcarcel et al. (2025), who observed similar depths of -20 to -58 m with a mean depth of -31 m in nearshore CTD profiles during trade wind conditions. Comparison of CTD observations with the data simulated with the hydrodynamic model SCARIBOS reveals some differences (Figure 1D). Relative to the CTD observations, SCARIBOS consistently simulates lower salinity values in the surface below the mixed layer. The agreement of salinity in the mid-depth layer is good. The salinity in the deep layer is overestimated at some stations.
For simplicity, we determined the depth bounds of the layers used in our analysis as the mean between the 5th and 95th percentiles of the water masses, identified with the CTD observations, as:
-
Surface layer: 0 to -162 m (corresponding primarily to CSW)
-
Mid-layer: -162 to -458.5 m (corresponding primarily to STUW)
-
Deep layer: <-458.5 m (corresponding primarily to WNACW)
These categories are used throughout the entire Lagrangian particle analysis.
HYDRODYNAMIC MODEL AND MONTHLY SURFACE CURRENT REGIMES
This analysis uses the hydrodynamic model SCARIBOS, which is described in detail and validated in Bertoncelj et al. (2025a). The model uses the Coastal and Regional Ocean Community Model (CROCO) (Auclair et al., 2023) and covers the islands of Curaçao, Aruba, and Bonaire between 66.0-70.5° W and 10.0-13.5° N (orange box in Figure 3A). The model runs for four years from March 2020 to April 2024. It has a horizontal resolution of 1/100° (approximately 1.1 km in both directions) and 50 vertical sigma layers. The vertical layers are thicker at depth and thinner near the surface, where the top layer varies from centimeters to 4 m thick. The model uses boundary conditions from GLORYS12V1 (Lellouche et al., 2021), atmospheric data from ERA5 (Hersbach et al., 2020), tides from TPXO7 (Egbert and Erofeeva, 2002), and river discharge data from Dai and Trenberth (2002). Detailed model configuration and forcing datasets are provided in Table S1.
SCARIBOS was validated against multiple datasets including surface currents from GlobCurrent (Rio et al., 2014), water level measurements from a bubbler sensor, and two weeks of ADCP measurements from ship surveys (described in detail in Bertoncelj et al., 2025a). Validation showed good agreement between modeled and observed surface currents, with the model accurately capturing both current direction and speed around the islands. Water level validation demonstrated that the model correctly reproduces tidal dynamics, including spring and neap tides, with an accuracy of approximately one centimeter for the main tidal components. Surface temperature and salinity were validated against multi-observation datasets (for temperature: Guinehut et al., 2012; for salinity: Droghei et al., 2016), showing strong agreement especially for temperature, with some differences in salinity mainly along the Venezuelan coast. Overall, the validation confirms that SCARIBOS reliably simulates the surface ocean dynamics.
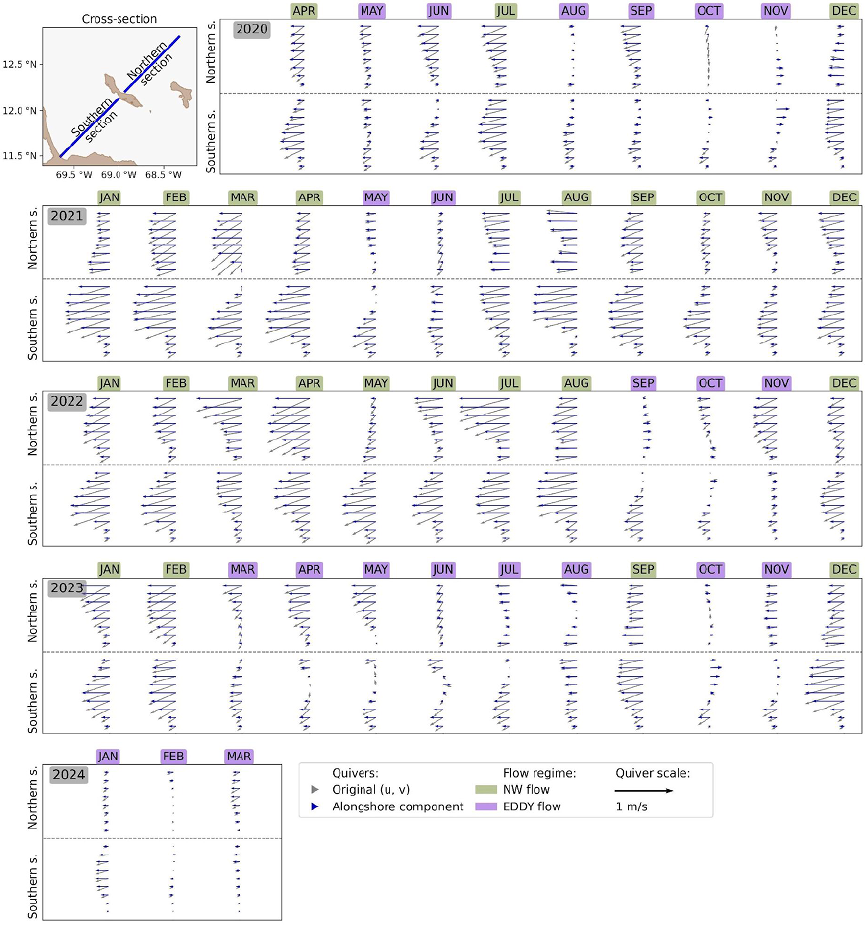
We distinguish two dominant surface flow regimes around Curaçao: northwest-directed flow (NW-flow) and cyclonic eddy-dominated flow (EDDY-flow). These regimes reflect temporal variations between periods dominated by the strong northwestward Caribbean Surface Current and periods when cyclonic eddies and low-energy flow conditions prevail. During the analyzed period, both regimes were observed to dominate surface flow during several months of each year from 2020 to 2024 (Bertoncelj et al., 2025a).
To classify the prevailing monthly flow regime for each month of the analyzed period, we investigated monthly mean surface current cross-sections oriented southwest-to-northwest perpendicular to the orientation of Curaçao (Figure 2). From these cross-sections, we computed the alongshore and cross-shore components of the surface velocity. For classification purposes, we focus on the southern section, as this is the area where most shallow-water coral reefs are (Waitt Institute, 2017). A calendar month is classified as NW-flow dominated if it meets all the following criteria:
-
The entire cross-shore component in the southern section is directed offshore (southwestward).
-
At least half of the southern section shows strong northwestward alongshore flow with velocities exceeding 0.3 m s-1.
-
Flow magnitudes away from the Venezuelan coast remain positive across the southern section.
This monthly classification assigns each month to a single flow regime based on the monthly mean, although transitions may occur within a month (e.g., a NW-flow period followed by EDDY-flow). In such cases, if the northwestward flow is not sufficiently strong or persistent in a certain calendar month, we assume eddy activity has a prevailing influence during that month. We acknowledge that not all months meet these criteria unambiguously. For instance, March 2023 exhibits a NW-flow pattern that satisfies most conditions but is weak in overall magnitude and is therefore categorized as EDDY-flow dominated. Figure 2 illustrates the monthly flow classifications, in which NW-flow months are labelled in green and EDDY-flow months in purple.
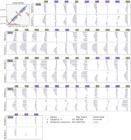
Cross-sections of monthly mean surface current velocities perpendicular to the coastline of Curaçao. Each panel, grouped by year, shows the northern (top) and southern (bottom) sections of the cross-section. The top-left map indicates the location of the cross-section relative to the island. Full velocity vectors (grey) are shown alongside the alongshore (blue) components of the flow. Monthly flow regimes are classified as either NW-flow dominated (green), or cyclonic EDDY-flow dominated (purple). Classifications are based on the southern section, which hosts most shallow-water coral reefs.
LAGRANGIAN PARTICLE TRACKING EXPERIMENTS
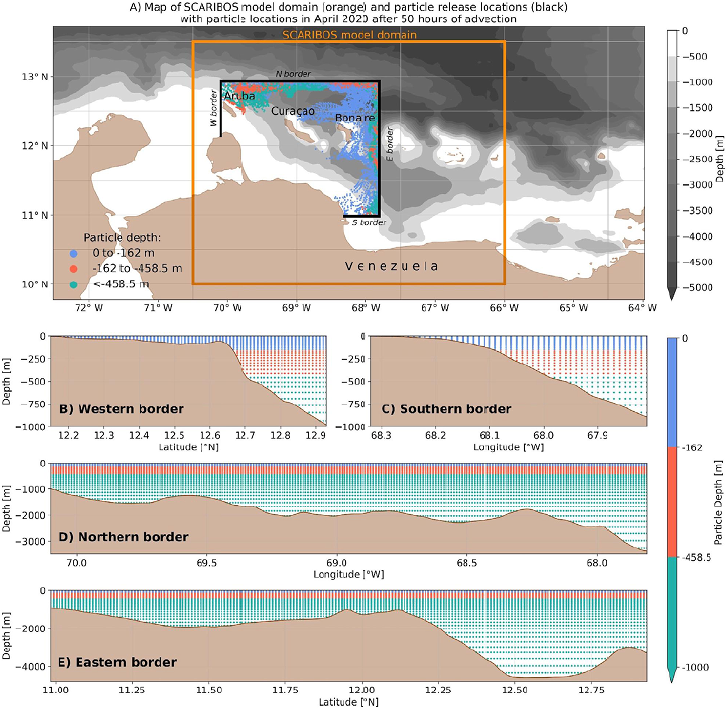
We conducted Lagrangian particle tracking experiments using the Parcels v3.1.2 framework (Delandmeter and Van Sebille, 2019) to simulate the transport pathways of passive tracers in the study area. Virtual particles were seeded into the selected domain every 24 hours from April 1, 2020, to March 31, 2024. The domain expands the area around Curaçao depicted with black lines in Figure 3A and particles are seeded on each of these boundaries. Each particle is advected for a maximum of four months; if it remains in the domain beyond this period, it is removed. This maximum duration is chosen based on a sensitivity analysis, which showed that after three months, (at most but usually much less than) 10% of particles remain in the domain, typically along the Venezuelan coastline and, to a lesser extent, near Bonaire, Curaçao, and Aruba.
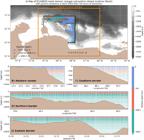
(A) Map of the SCARIBOS model domain (orange) with particle release locations (black borders) and example locations of particle positions after 50 hours in April 2020, colored by their depth at t=50 hours. (B-D) Particle release depths at each of the four borders (west, south, north, east), colored by their initial depth.
All particles are neutrally buoyant tracers and represent the volume transport of water masses. Seeding occurs at multiple depths, from the surface to the maximum model depth, using logarithmic vertical spacing to provide higher resolution near the surface where the current is generally the strongest. The vertical spacing ranges from approximately 4.3 m at the surface to 435 m at the deepest depth. Particles are seeded on a regular horizontal grid with a spacing of 0.01° (~1 km). A schematic of the vertical seeding distribution is shown in Figure 3B-E.
To handle the sigma-coordinate system used by CROCO, the FieldSet.from_croco() method in the Parcels v3.1.2 framework automatically converts particle depths from meters to sigma-coordinates before interpolation. The conversion uses the CROCO vertical grid transformation. First, depth levels z are converted from the sigma coordinates:
in which H is the local ocean depth, ζ is the sea surface elevation, h c is the critical depth parameter, C s,w is the dimensionless vertical coordinate stretching function (as implemented in CROCO; Auclair et al., 2023) and z 0 is the nonlinear vertical transformation. The sigma coordinate σ for a particle at given depth z is found through linear interpolation:
During the advection estimations, the advection kernel converts the vertical velocity w to sigma-units (w σ ) at every time step using:
Particle advection uses a fourth-order Runge-Kutta scheme in forward mode, with an internal time step of 5 minutes. The advection is applied without diffusion. Particle attributes such as position and depth are recorded at hourly intervals.
In total, we released approximately 26 million particles during the simulation period. However, only a subset of these particles is considered ‘active’: that is, only those initially moving inward into the model domain are tracked. Once a particle exits the domain, it is permanently removed from the simulation.
Particle trajectories are analyzed using an analytical discrete streamtube method (Van Sebille et al., 2018). This approach computes trajectories across grid cells using the velocity field at grid cell faces while conserving the volume of the particle throughout its lifespan, following the approach described in Van Sebille et al. (2018) and applied in several studies (e.g., Blanke et al., 1999; Döös et al., 2008; Rühs et al., 2019; Van Sebille et al., 2013, 2014; Tamsitt et al., 2017).
Volume transport of each particle Q p is calculated as the product of the incoming speed and the particle’s representative area A p:
in which is the magnitude of the velocity field at the particle’s position at the moment of release (t = 0), with the velocity components computed internally by Parcels.
A representative area of each particle is computed based on the initial position of the particle as:
in which Δx p and Δz p are the horizontal and vertical grid spacing, respectively. These are defined as:
in which d x,left and d x,right are the distances to neighboring particles in the horizontal direction, and d z,above and d z,below are the distances to neighboring particles in the vertical direction.
For particles whose initial position is near the seabed, the vertical extent is adjusted to:
in which z p is the particle’s seeding depth and is the local bottom depth, ensuring that the assigned volume does not extend below the ocean floor.
LAGRANGIAN PARTICLE TRACKING ANALYSIS
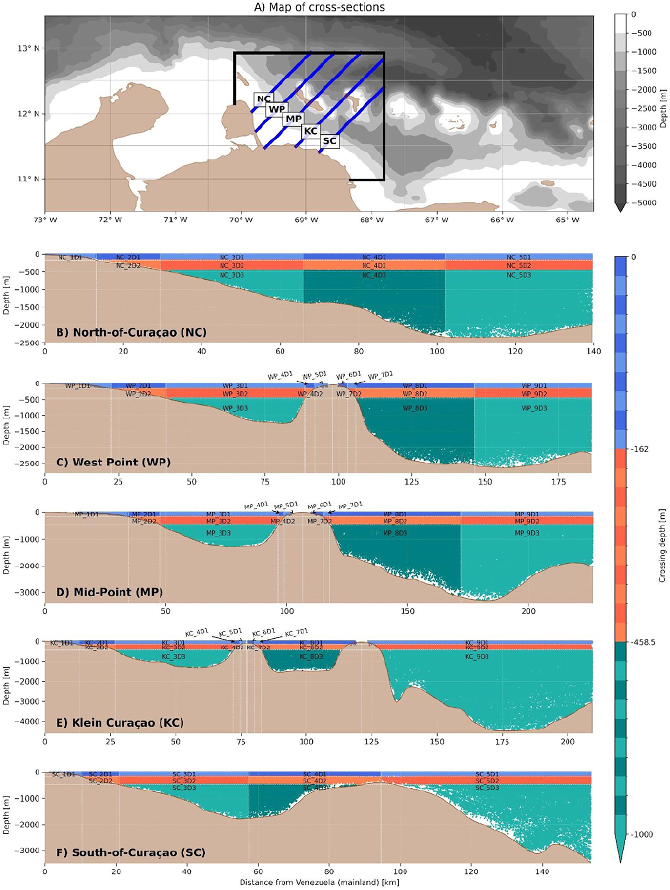
To study the general 3D flow around Curaçao, we built transition matrices that represent the movement of particle trajectories through depth layers around Curaçao. For that, we defined five cross-sections perpendicular to the orientation of the island, at a 45° angle from true north, depicted in Figure 4A. Each cross-section was further subdivided into smaller segments based on depth and distance from the coast. Depth categories were selected based on depth layers defined from the CTD data. We defined surface segments (segments with labels ending with D1) that have a crossing depth between 0 and -162 m, mid-depth segments (segments with labels ending with D2) that have a depth between -162 and -458.5 m, and deep segments (segments with labels ending with D3) that have depths deeper than -458.5 m. Segmentation was designed to be finer in the nearshore areas around Curaçao and Klein Curaçao, which are of particular interest in this study. The areas directly adjacent to the coasts of Curaçao and Klein Curaçao are referred to as ‘nearshore segments’ throughout the manuscript. Figure 4B-F depict the segments of each cross-section along with the crossings of a subset of particles seeded between April and June 2022.
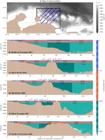
(A) Map showing the five cross-sections (orange lines) and particle release locations (black lines) around Curaçao. (B-F) Depth profiles of each cross-section showing their segments and labels. The position of Curaçao is indicated by closely spaced vertical lines at approximately 100 km distance in panels (C) and (D), while the position of Klein Curaçao is indicated by closely spaced vertical lines at approximately 75 km distance in panel (E). Figure 4B-F depict segments of each cross-section along with the crossings of a subset of particles seeded between April and June 2022.
A particle was considered to have crossed a section if the displacement vector between two consecutive time steps intersected the vector defining the cross-section. When a crossing occurred, we recorded the particle ID, time, coordinates, depth, and corresponding segment name. We tracked all particle movements between segments (both within and between cross-sections) to create a timeline of segment transitions for each particle. However, if a particle crossed the same segment multiple times consecutively without crossing any other segment in between, only the first occurrence was recorded. All other segment transitions were included in the timeline, enabling us to capture the full pathway of particle movement through the study area.
To analyze transport pathways around Curaçao, we tracked all particle movements between segments to create a timeline of segment transitions for each particle, recording only the first occurrence when particles crossed the same segment consecutively. The sequence of crossings was used to create transition matrices for the entire simulation period. To summarize the dominant patterns, we constructed Sankey diagrams showing the 80 most frequent particle transitions for each flow regime. These pathways are weighted by volume transport and represent the strongest and most persistent circulation patterns around Curaçao and Klein Curaçao.
To analyze offshore-nearshore connectivity, we applied conditional pathways to examine flow patterns specifically associated with the nearshore regions of Curaçao and Klein Curaçao. In conditional pathways analysis, a subset of trajectories is taken from the full set in post-processing, based on some condition, such as the depths they traversed through. The concept of conditional pathways has been successfully applied in previous studies (e.g., Tamsitt et al., 2017; Van Sebille et al., 2013, 2014; Yit Sen Bull and Van Sebille, 2016), as it enables targeted analysis of particle trajectories under specific conditions. We filtered particle trajectories to include only those that crossed at least one nearshore segment (labelled in Figure 4C-E as: WP_5D1, MP_5D1, and KC_5D1 for the southern coastline of Curaçao, and WP_6D1, MP_6D1, and KC_6D1 for the northern coastline of Curaçao). For these selected particles, we extracted their complete trajectories and analyzed the time series of pathways before reaching the nearshore (representing flow arriving at Curaçao) and after leaving the nearshore (representing flow departing from Curaçao).
Using these conditional pathways, we generated timelines of particle depths before and after crossing the nearshore segments. Particles were categorized into three depth classes (surface, mid-range, and deep) based on their maximum depth during either their pre-arrival phase (for incoming flow analysis) or post-departure phase (for outgoing flow analysis). This categorization allows us to identify potential upwelling processes (deep particles moving toward the surface before reaching nearshore areas) and downwelling processes (particles moving to greater depths after leaving nearshore areas).
RESULTS
GENERAL CONNECTIVITY
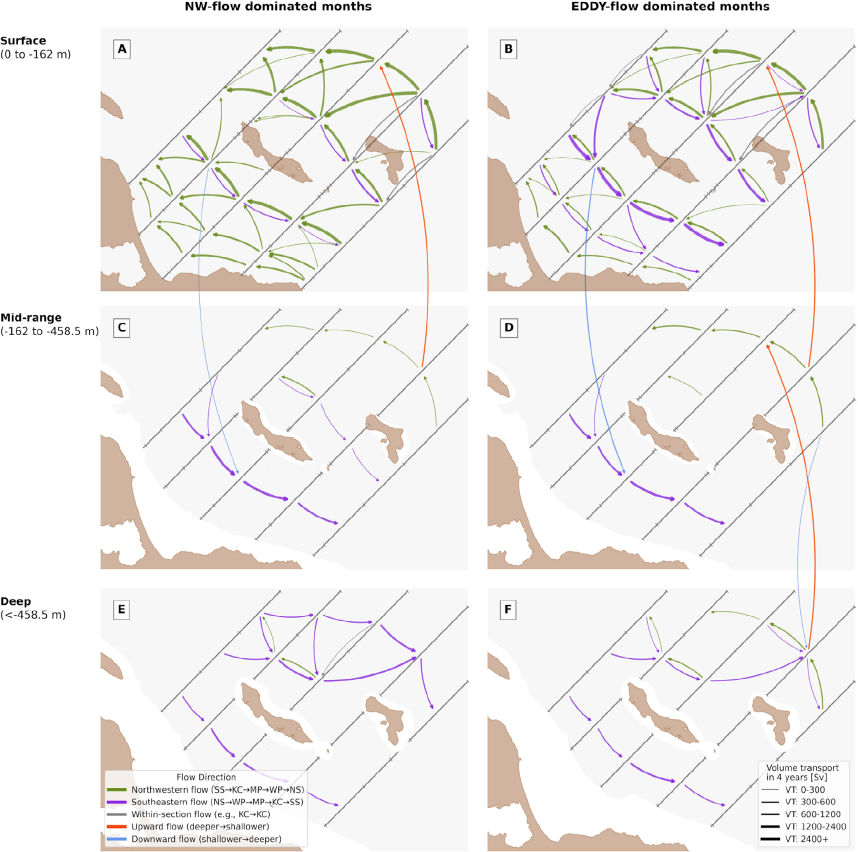
Surface layer horizontal transport (Figures 5A and B) dominates over the mid-depth (Figures 5C and D) and bottom layers (Figures 5E and F) in both regimes. The most striking differences between regimes occur in the surface layer in the southwestern sections adjacent to Curaçao. During NW-flow months (Figure 5A), northwestward transport dominates this region, whereas southeastward flow prevails during EDDY-flow months (Figure 5B). Notably, the northeastern part of the domain maintains northwestward surface flow under both regimes. This suggests that the Caribbean Current, generally dominating the surface flow in this region (Bertoncelj et al., 2025a), does not disappear during EDDY-flow months but instead shifts northward, away from Curaçao. This northward displacement of the current’s core position is associated with cyclonic eddy circulation around the island and altered surface flow conditions (Bertoncelj et al., 2025a).
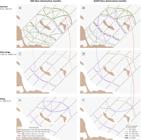
Sankey diagram for NW-flow dominated months (left) and EDDY-flow dominated months (right). For both diagrams, only the 80 flows with the largest volume transport are depicted. Colors indicate flow direction: green represents southeast-to-northwest transport, purple the reverse (northwest-to-southeast), blue indicates downward movement, and red indicates upward movement. Volume transport is indicated by the thickness of the arrows, in which 1 Sv=10<sup>6</sup> m<sup>3</sup> s<sup>-1</sup>.
While the mid-depth layer remains relatively consistent between regimes, the bottom layer also shows marked differences. In the northeastern region, an eastward flow is present during the NW-flow regime (Figure 5E), whereas westward flow dominates during EDDY-flow months (Figure 5F). Additionally, while both regimes share the same vertical exchange pattern between the surface and mid-depth layers, vertical exchange between the bottom and mid-depth layers is only observed during EDDY-flow months (Figures 5D and F).
It is also notable that, out of the 80 strongest flow transitions, only two connect nearshore segments during the NW-flow regime (Figure 5A): inflow toward the northern section of West Point, and offshore outflow away from the southern coastline of the Mid-Point section. The latter may indicate divergent surface flow along the southern coastline, consistent with the patterns seen in the hotspot analysis in Bertoncelj et al. (2025a).
The limited representation of nearshore-offshore connections in this diagram (only 3 out of the 80 strongest transitions) results from the diagram’s focus on absolute transport magnitude. Nearshore segments have much smaller areas than offshore segments, leading to proportionally lower transport volumes compared to exchanges between larger segments.
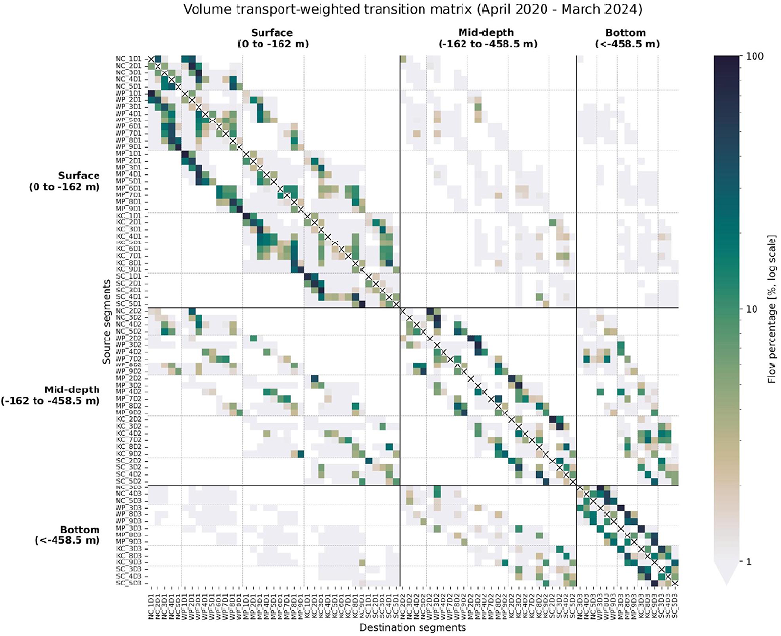
To examine connectivity in greater detail, including the weaker but important nearshore connections, Figure 6 presents the complete transition matrix showing the relative distribution of volume transport pathways, with each row indicating where flow from a given segment is most likely to go next. Overall, transitions occur predominantly within the same depth layer, as already seen in the Sankey diagram (Figure 5), indicating that horizontal flow dominates. At the surface, particle movements are directed primarily northwestward, as shown by the stronger connections below the main diagonal (self-transitions, marked by crossed squares). In contrast, in the mid-depth and bottom layers, more exchange occurs toward the southeast, shown by stronger transitions above the diagonal.
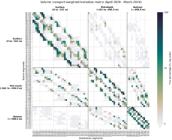
Transition matrix showing volume-weighted particle transitions across all months from April 2020 to March 2024. Matrix values represent the percentage of transitions between cross-sections and depth layers on a logarithmic scale. Solid lines separate the three depth layers (surface, mid-depth, deep), creating quadrants that represent transitions within the same layer (diagonal quadrants) or between different layers (off-diagonal quadrants). Dashed lines mark the boundaries between different cross-sections. NW-directed transitions appear below the main diagonal, and SE-directed transitions appear above it.
Vertical exchange is most pronounced in the mid-depth layer. In the southeastern part of the domain, we observe vertical connectivity between transect SC, KC, and MP locations, with upward flow from bottom to mid-depth layers and downward flow from mid-depth to bottom. Upward exchange also occurs from mid-depth to surface layers, but with minimal downward flow from surface to mid-depth. This asymmetric pattern indicates that vertical connectivity is stronger in the deeper water column, particularly in the southeastern region.
Interestingly, we also detect direct exchange between the bottom and surface layers, bypassing the mid-depth layer. This is not a limitation of the model but rather a result of our cross-section placement: particles do move through the mid-depth layer in the regions between cross-sections, but these horizontal mid-depth transitions are not captured because we did not position cross-sections in those specific locations. For example, upward flow is directed to KC_9D1, while downward flow appears toward SC_3D3. These patterns suggest the presence of localized upwelling and downwelling processes in the southeastern part of the domain, near Klein Curaçao.
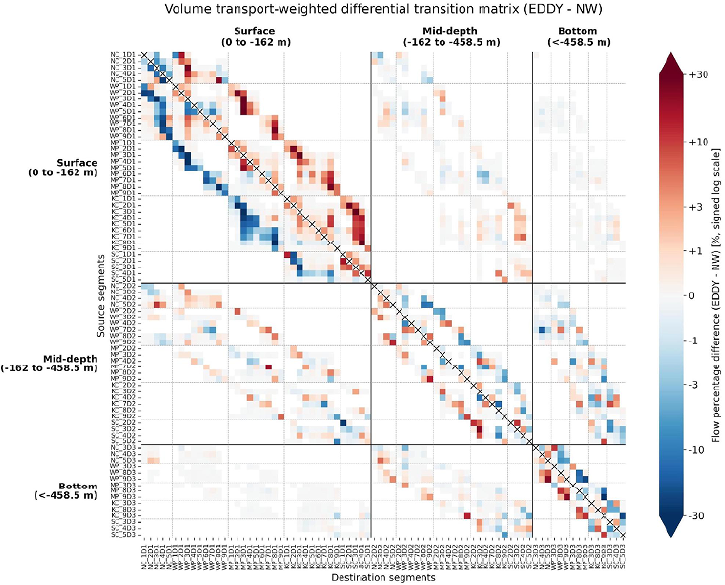
To highlight differences between flow regimes, we created separate transition matrices for months associated with NW-flow and EDDY-flow regimes and subtracted the EDDY-flow matrix from the NW-flow matrix to construct a differential transition matrix. Figure 7 presents this differential transition matrix, where positive values (red shading) indicate stronger transitions during EDDY-flow months and negative values (blue shading) show stronger transitions during NW-flow months. The surface layer exhibits a strong contrast between the two flow regimes: northwestward flow dominates during NW-flow months (blue below the diagonal), while southeastward flow strengthens during EDDY-flow months (red above the diagonal). This pattern is reversed at depth, as the mid-depth and bottom layers show stronger southeastward flow during NW-flow months and stronger northwestward flow during EDDY-flow months.
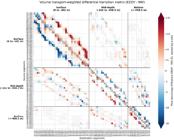
Differential transition matrix between EDDY-flow and NW-flow months. Matrix values represent the difference in transitions (EDDY minus NW) on a logarithmic scale. Positive values (red shading) indicate transitions that are more frequent during EDDY-flow conditions, while negative values (blue shading) indicate transitions that are more frequent during NW-flow conditions.
We also observe enhanced within-cross-section transitions during EDDY-flow months, indicating stronger particle movement in the SW-NE direction (along the 45° orientation of the cross-sections). This pattern suggests more movement directly toward and away from Curaçao, rather than particles simply bypassing the island.
The two flow regimes also govern spatial differences in downwelling from the surface layer to the mid-depth layer around the island. Notably, EDDY-flow months intensify downwelling in the southeastern region (Figure 7: bottom right values in the surface-to-mid-depth quadrant). However, the regimes differ even more in overall vertical exchange patterns. EDDY-flow months promote stronger upward transport across all three layers (mid-depth to surface and bottom to mid-depth quadrants in Figure 7), while NW-flow months favor stronger downward transport only from the mid-depth to the bottom layer. This suggests that EDDY-flow conditions create a more dynamic vertical circulation system with enhanced upwelling across the domain.
OFFSHORE-NEARSHORE CONNECTIVITY
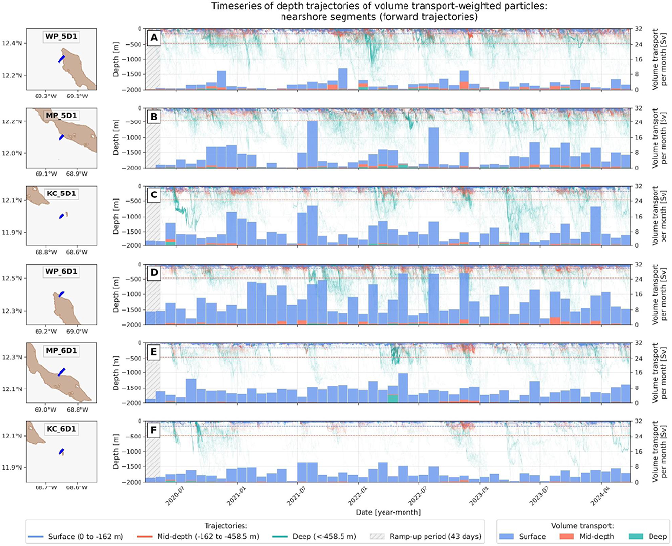
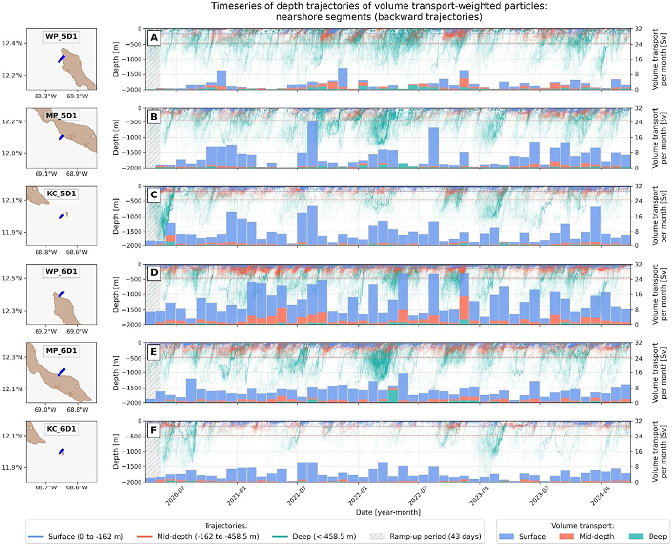
The depth time series of particles arriving at nearshore segments are shown in Figure 8. Each figure displays both the particle depth trajectories (lines) and monthly cumulative volume transport (bars) through each segment, color-coded by the particles’ maximum depth prior to arrival. Note that the first 43 days of the time series should be interpreted with caution due to the ramp-up effect, during which particles gradually fill the domain from their initial boundary seeding locations (Van Sebille et al., 2012). All particles are weighted by their volume transport, so the analysis shows cumulative volume transport rather than absolute particle numbers.
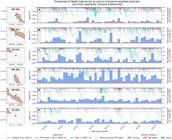
Time series of particle depth trajectories arriving at nearshore segments (segment locations shown in left panels). Thin lines show particle depth trajectories until arrival at the destination segment, color-coded by the particles’ maximum depth prior to arrival. Monthly bars represent cumulative volume transport, in which 1 Sv=10 6 m3 s-1 .
In general, each segment exhibits distinct characteristics: West Point (Figures 8A and D) receives overall more mid-depth and deep particles compared to other segments, while Klein Curaçao (Figures 8C and F) consistently receives predominantly surface particles throughout the simulated period. The Mid-Point segment on the southern coastline (Figure 8B) shows highly variable volume transport, with some periods (e.g., May-June 2021) having almost zero net volume transport, followed by a period of relatively large inflow of volume transport from the surface (July-August 2021). In contrast, the Mid-Point segment on the northern coastline (Figure 8E) maintains very consistent volume transport levels throughout the entire period.
The monthly volume transport varies greatly over time, with no obvious correlations between different segments. This suggests that time series of monthly volume transport alone do not reveal consistent patterns across nearshore locations around Curaçao and Klein Curaçao.
However, examining the depth trajectories reveals synchronized events where multiple segments simultaneously receive deeper particles. For example, during September-November 2022, all segments in Figure 8 received at least some mid-depth and deep particles (the signal is present at all segments, albeit in different proportions). Despite being geographically separated, these segments showed coordinated deep particle arrivals, suggesting regional processes that sometimes bring deeper water masses simultaneously to the nearshore around both islands. Nevertheless, such synchronized events are not the norm. For example, the strong arrival of deep particles in March-April 2022 was confined to the Mid-Point segments on both coastlines (south and north) (Figures 8B and E), even though these locations are geographically separated by the island.
Figure 9 shows the time series of departing trajectories. Most notably, particles rarely move to deeper waters after leaving the nearshore segments, indicating that downwelling processes are very limited. Additionally, there is almost no synchronized behavior in these rare downwelling events, with the exception of October-November 2022, when coordinated downwelling occurred at the southern Klein Curaçao segment and across the entire northern coastline (Figures 9C-F).
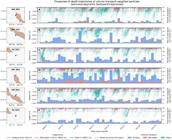
Time series of particle depth trajectories departing from nearshore segments (segment locations shown in left panels). Thin lines show particle depth trajectories after leaving the nearshore segment, color-coded by the particles’ maximum depth during the post-departure phase. Monthly bars represent cumulative volume transport, where 1 Sv=10 6 m3 s-1 .
Notably, neither arriving nor departing particle time series show clear correlations with the two flow regimes. Deep particle arrivals and downwelling events occur during both NW-flow and EDDY-flow months without consistent patterns, indicating that offshore-nearshore connectivity involves more fine-scale processes than the large-scale circulation patterns described earlier.
While temporal patterns show limited correlation with flow regimes, examining the spatial distribution of overall volume transport reveals distinct regional variations. To quantify these patterns, we analyzed the total flow through each nearshore segment and determined what fraction was associated with surface, mid-depth, and deep particles. All particles are weighted by their volume transport, so the analysis shows cumulative volume transport rather than absolute particle numbers. Figure 10 summarizes these transport patterns across all nearshore segments for the entire simulation period of four years, alongside the spatial distribution of coral cover observed in 2015 (Waitt Institute, 2017).
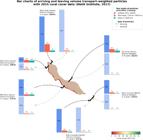
Volume transport through nearshore segments for particles seeded from April 2020 to March 2024. Colors indicate depth layer contributions based on the maximum depth reached during particle trajectories. Solid bars: arriving particles; shaded bars: departing particles. Bar size represents total volume transport over four years, with values labelled next to each bar pair, in which 1 Sv=10^6 〖 m〗^3 s^(-1). Colored circles show 2015 coral cover percentage on the southern coastline, adapted from the study by the Waitt Institute (2017).
Clear spatial patterns emerge along the coastlines. Along the southern coastline of Curaçao, volume transport increases from west to east, while along the northern coastline, volume transport increases from east to west. Strikingly, both the lowest and highest transport values occur at the West Point cross-sections: the lowest volume transport is observed at the southern West Point segment, while the northern West Point segment exhibits the highest volume transport-approximately 4.5 times greater than its southern counterpart. This high transport at northern West Point is consistent with the patterns highlighted in the Sankey diagram (Figure 5A), where the northern West Point nearshore segment stands out as one of the few nearshore areas to appear among the top 80 transitions, specifically during NW-flow months.
Beyond these spatial variations in total transport, the depth composition of flow also varies significantly between segments. Across all segments except for the southern West Point segment, arriving particles predominantly originate from the surface layer, with surface-originating particles accounting for 76-88% of incoming volume. Similarly, departing flow is dominated by surface particles (88-96%) at all segments except the southern West Point. These results reflect the presence of the Caribbean Current, which dominates the horizontal flow in the upper ocean.
The southern West Point segment displays a distinctly different pattern. Here, 48% of the arriving particles originate from subsurface layers: 27% from mid-depth and 21% from deep. Similarly, its departing flow includes significant downward movement compared to other segments, with 20% of particles exiting to the mid-depth layer and 9% to the deep layer. These numbers suggest that the southern West Point is a key location for vertical exchange, characterized by both upwelling and (weaker) downwelling dynamics. This is consistent with its low total volume transport and indicates that this region is both the least ventilated and the most vertically active among the nearshore segments.
DISCUSSION
SURFACE FLOW REGIMES GOVERN HORIZONTAL CIRCULATION PATTERNS
This study, using Lagrangian analysis, shows that Curaçao experiences two distinct surface flow regimes: NW-flow and EDDY-flow (previously identified in Bertoncelj et al., 2025a). Our results reveal how these regimes influence three-dimensional circulation patterns around the islands. Importantly, during EDDY-flow periods, the Caribbean Current does not vanish but rather shifts northward, as evidenced by persistent northwestward flow in the northeastern domain even when circulation around Curaçao reverses to southeastward flow. This latitudinal variability in the Caribbean Current’s position in the southern Caribbean has been previously acknowledged in Rueda-Roa et al. (2018), and here we showed that it correlates with island-scale circulation patterns. This variability exhibits seasonality, with mechanisms linked to upstream dynamics of Caribbean Current and wind forcing, with additional local processes acting in this region around the island (Bertoncelj, et al., 2025b). Understanding these mechanisms improves our ability to predict circulation patterns and their impacts on Curaçao’s nearshore ecosystems.
While the Sankey diagrams (Figure 5) show the expected directional differences in surface currents between NW-flow and EDDY-flow regimes, the differential transition matrix (Figure 7) reveals more subtle dynamics. Most notably, EDDY-flow periods exhibit enhanced transport towards and away from Curaçao and Klein Curaçao, suggesting stronger flow-island interactions during this regime. The weaker flow velocities during EDDY-flow months (Figure 2) also suggest greater particle retention around the islands, potentially increasing the residence time of both beneficial nutrients and harmful contaminants near coral reef ecosystems. This contrasts with NW-flow periods, when currents primarily bypass the islands with minimal interaction, as already shown with the Hotspot analysis in Bertoncelj et al. (2025a). Understanding the timing and drivers of these regime shifts is therefore crucial for assessing transport of various substances to Curaçao’s reefs.
The two flow regimes also create contrasting vertical circulation patterns around the islands. EDDY-flow conditions promote stronger upward transport across all depth layers, while NW-flow months favor downward transport primarily from surface to mid-depth waters. This suggests that EDDY-flow periods create a more dynamic vertical circulation system with enhanced domain-wide upwelling. However, enhanced upwelling across the broader domain does not necessarily translate to increased coastal upwelling near the coral reefs. While these patterns suggest that EDDY-flow conditions may enrich surface waters with deeper water, understanding how these large-scale circulation patterns ultimately affect the delivery of nutrients and substances to coral reef environments requires examining the direct connectivity between offshore waters and nearshore areas where corals are located.
TEMPORAL DYNAMICS AND SPATIAL PATTERNS OF OFFSHORE-NEARSHORE CONNECTIVITY
Although the two dominant surface flow regimes strongly influence surface dynamics that are critical for shallow-water ecosystems, our analysis reveals that these regimes have limited influence on offshore-nearshore connectivity patterns. Analyses of particle arrival time series and monthly volume transport to nearshore segments (Figure 8) reveal that different physical mechanisms control transport from deeper layers to the surface around the islands.
Deep particle arrivals do not clearly relate to the surface flow regime. Examining particle trajectories prior to nearshore arrival (not shown) revealed no distinctive spatial patterns linking source locations or trajectories toward the nearshore to either the NW-flow or EDDY-flow regime. However, deep particles often arrive in batches along similar trajectories, suggesting large-scale transport pathways that operate independently of surface regime variability. These include pathways from the northwestern corner of the particle tracking domain toward West Point (rising with increasing bathymetry), and to a lesser extent from the northern and east-southeastern boundaries. This independence from surface variability is likely driven by the Caribbean Counter Current, which remains present during both flow regimes (Figure 5C and D). Upwelling occurs when this deeper flow encounters topographic features such as island slopes and bathymetric ridges, a process known as the island mass effect (De Falco et al., 2022; Gove et al., 2006; Hamner and Hauri, 1981; Liu et al., 2014), creating localized vertical transport regardless of surface conditions.
This lack of regime influence on offshore-nearshore connectivity contrasts with findings by Bertoncelj et al. (2025a), where the surface flow was shown to significantly affect coastal connectivity. In that study, particles released along the coastline were more likely to circulate around the island during the EDDY-flow regime, while under NW-flow, surface divergence at the leeward side of the island rapidly deflected them offshore. Based on this, one might expect that the surface regime would also influence the arrival of offshore particles at the nearshore. However, our results show otherwise. This likely arises from the different experimental setups. In the current study, particles were initialized offshore at the domain boundaries, far from Curaçao, and only a subset (those that reached the nearshore segments) were analyzed. In contrast, Bertoncelj et al. (2025a) tracked particles released directly along the coast, focusing on how surface circulation redistributes them alongshore or moves them offshore. Our current analysis, by design, isolates offshore-to-coastal delivery, with a focus on the volume transport and depth characteristics of incoming particles. While strong surface divergence may rapidly remove surface coastal particles in the NW-flow regime, it does not appear to significantly influence the arrival of particles from offshore, which follow more complex three-dimensional pathways. These findings underscore the importance of distinguishing between surface redistribution of coastal-origin particles and offshore-driven import of particles to the coast when interpreting connectivity. The former is crucial for understanding how locally released substances such as pollution or coral larvae may spread along the coastline and impact coral reef ecosystems (Kruijssen et al., 2024; Sánchez Barranco et al., 2025b). In contrast, the latter is key to assessing how different parts of the island are ventilated by offshore waters, and whether there are any consistent sources of upwelled, cold, and nutrient-rich water that may enhance productivity or influence local biogeochemical conditions.
Despite the temporal independence from surface flow regimes, clear spatial patterns emerge in overall volume transport along the coastlines, as shown in Figure 10. Of all the studied segments, the southern coastline near West Point stands out as particularly significant. The combination of strong vertical exchange processes and minimal horizontal transport at this location creates a unique hydrodynamic environment. The reduced volume transport through this segment aligns with the expected sheltering effect in the leeward region of the island, consistent with ADCP validation data presented by Bertoncelj et al. (2025a, Figure 4), which demonstrate significantly lower surface current velocities in this area. This hydrodynamic setting, where weak horizontal flow coincides with active vertical mixing, may create conditions favorable for localized biogeochemical processes, as upwelled nutrients have longer residence times to be taken up by coral reef ecosystems before being flushed away. This interpretation is supported by observational evidence from Sánchez Barranco et al. (2025a), who found both physical indicators (a more mixed water column) and biogeochemical indicators (elevated nutrient concentrations and higher chlorophyll-a levels) at West Point, confirming enhanced vertical processes and upwelling-driven nutrient enrichment at this location.
These findings highlight the complexity and localized nature of nearshore circulation along Curaçao’s coastline. Rather than behaving as passive extensions of broader offshore circulation, nearshore zones function as semi-independent systems with distinct dynamics controlled by local bathymetry, coastline orientation, and small-scale hydrodynamic features. This independence of offshore-nearshore dynamics from regional flow regimes suggests a persistent hydrodynamic “barrier” between offshore and nearshore waters, likely arising from flow separation around the island’s steep bathymetric gradients. Similar “barrier” effects limiting offshore-nearshore exchange have been documented in other oceanographic contexts, such as the East Australian Current system, where western boundary currents act as persistent separators between onshore and offshore processes (Roughan et al., 2011). This “barrier” creates asymmetric exchange: nearshore waters export offshore, while offshore particles have limited access to nearshore waters. This asymmetry has dual implications for coral reefs: protection from offshore-borne substances but reduced water renewal in areas where the “barrier” is strongest, potentially increasing residence times of land-derived pollutants. Capturing these fine-scale barrier dynamics requires high-resolution modeling approaches when assessing nearshore transport processes. Coarser-resolution models, such as global ocean reanalysis GLORYS (Lellouche et al., 2021), would likely miss these fine-scale processes and may lead to oversimplified interpretations of nearshore circulation.
IMPLICATION FOR CURAÇAO’S SHALLOW WATER CORAL REEFS
Although this study focuses on physical water transport rather than direct measurements of nutrients, oxygen, or pollutants, the circulation patterns we observe can provide important context for understanding the spatial variability in coral patterns (Sandin et al., 2022). Water transport can serve as a first-order indicator for processes such as water renewal (Cetina-Heredia et al., 2019; Hirsh et al., 2023) and vertical exchange, all of which influence reef conditions. This is particularly relevant for the southern coastline of Curaçao, where most of the island’s shallow-water coral reefs are located.
Our results show clear differences in volume transport between coastal segments, which may have implications for coral reef resilience and exposure to environmental stressors. Klein Curaçao exhibits the strongest volume transport, followed by Mid-Point, while West Point shows substantially lower transport. In the more ventilated areas, water is renewed more frequently, reducing the time during which various substances can build up or persist. This effect may offer some protection to coral reefs by reducing the exposure duration to harmful substances (e.g., localized pollutants, which often originate from nearby urban areas and bays). The high coral cover (up to 60% in 2015) at Klein Curaçao compared to Mid-Point (up to 10% in 2015) reported by the Waitt Institute (2017) and shown in Figure 10 is consistent with this pattern: despite both areas experiencing coastal connectivity (Bertoncelj et al., 2025a), Klein Curaçao’s stronger volume transport limits accumulation of land-derived substances through enhanced flushing.
The situation at West Point is complex. While it is the least ventilated locally, it also receives a higher proportion of water arriving from deeper layers due to upwelling dynamics in this region. This has two potentially opposing implications. On one hand, deeper water is typically cooler, which could offer thermal relief during extreme heat events, potentially serving as thermal refugia (Randall et al., 2020; Wall et al., 2015). On the other hand, upwelled water may carry higher concentrations of nutrients (Gove et al., 2016; Wang et al., 2007). Depending on the context, this could either support primary productivity or lead to eutrophication and algal overgrowth, which would be detrimental to coral health. Recent observations at West Point confirm elevated nutrient concentrations and higher chlorophyll-a levels, alongside physical indicators of a more mixed water column (Sánchez Barranco et al., 2025a). According to the Waitt Institute (2017), this region supported relatively high coral cover (up to 30% in 2015; Figure 10), especially when compared to Mid-Point (up to 10%; Figure 10). While upwelling effects on reef ecosystems can vary with depth, location, and proximity to shore (Spring and Williams, 2023), the relatively high coral cover at West Point suggests that in this specific setting, the combination of low horizontal flow and upwelling-driven nutrient supply creates favorable conditions: upwelled nutrients have longer residence times to support coral reef development before being flushed away.
The upwelling dynamics at West Point share characteristics with the Island Mass Effect (IME), where flow-topography interactions drive vertical nutrient transport and enhanced productivity around islands (De Falco et al., 2022). The strong Caribbean Current creates a wake region behind the island with reduced current speeds at West Point, coinciding with enhanced upwelling from deeper layers (21% of particles arriving at West Point originated from the deep layer). This pattern is consistent with lee-side upwelling documented in IME studies (e.g., Andrade et al., 2014). However, the IME signature around Curaçao appears limited compared to classical examples of strong IME. While Sánchez Barranco et al. (2025a) confirm elevated nutrient concentrations at West Point, satellite chlorophyll-a observations (not shown) reveal no basin-scale productivity enhancement typical of strong IME systems. The limited extent of this IME response likely relates to the combination of Curaçao’s relatively small island size and its orientation relative to the incoming current, as well as the strength and direction of the incoming current.
Such physical differences can influence how long coral reefs are exposed to stressors like heat or local pollutants. To better understand the mechanisms affecting reef ecosystems around Curaçao, it is essential to not only interpret the physical circulation patterns shown in this study, but also integrate them with other drivers, such as the biogeochemical properties of the seawater in the studied area, land-based runoff, groundwater flow, and local bay dynamics. Moreover, recent spatial planning scenarios for Curaçao demonstrate that zoning regulations limiting coastal development can reduce nutrient fluxes by up to 22% (Steward et al., 2025), illustrating the potential for land-use management to mitigate inputs of land-derived substances. In particular, knowing which areas are more or less connected to offshore and deeper waters can help prioritize monitoring and mitigation efforts, including spatial interventions that limit pollutant inputs in areas with low flushing capacity.
MODEL RESOLUTION: CAPABILITIES AND INTERPRETIVE CONSTRAINTS
The SCARIBOS model’s ~1 km horizontal resolution with 50 depth layers is adequate for exploring sub-island scale variability, which is central to our research objectives. This spatial resolution effectively captures mesoscale and submesoscale dynamics across the study region, with our findings demonstrating that such fine-scale resolution is essential for distinguishing between different flow regimes as well as ocean-to-nearshore dynamics.
Nevertheless, previous studies highlight critical limitations when interpreting results at scales finer than the model grid resolution. Dauhajre et al. (2019) demonstrated that Lagrangian connectivity in nearshore environments is highly sensitive to the horizontal resolution of hydrodynamic model input. Their work revealed that resolutions ≤100 m are required to capture rapid alongshore and vertical transport processes occurring within 1 km of the shoreline, such as fronts, filaments, topographic wakes, and narrow alongshore jets. Similarly, Saint-Amand et al. (2023) emphasized the need for careful interpretation of connectivity results, again constrained by the spatial scales of model resolution. Their findings indicate that connectivity results from studies such as ours cannot be meaningfully interpreted at individual reef scales, but rather at the scale of larger “reef patches.” For instance, results associated with our West Point segment represent broader northwestern coastal processes extending several kilometers around the coordinates of the segment, rather than localized conditions at a single location, i.e., at the reef site known as West Point.
Nevertheless, our approach describes offshore-nearshore dynamics by revealing how nearshore environments connect with broader circulation patterns and how these connections vary temporally, spatially, and with depth. While our resolution cannot resolve fine-scale hydrodynamics within reef flats or surf zones (scales on the order of 10-100 m), our results establish important context for understanding how large-scale oceanographic processes shape the environmental conditions experienced by these ecosystems.
DATA AVAILABILITY STATEMENT
The SCARIBOS model output dataset can be accessed through Bertoncelj (2025), providing immediate access to hourly surface currents and water level time series. Complete model output is available upon request through the same DOI. The scripts for reproducing all Parcels simulations and analysis, including generating figures, can be found at https://github.com/OceanParcels/SCARIBOS_3DtransportCuracao. CTD data used for water mass analysis are available in Mienis and Bertoncelj (2025) via https://doi.org/10.25850/nioz/7b.b.1j.
ACKNOWLEDGMENTS
This publication is part of the project “Land, Sea, and Society: Linking terrestrial pollutants and inputs to nearshore coral reef growth to identify novel conservation options for the Dutch Caribbean (SEALINK)” conducted within the research program “Caribbean Research: A Multidisciplinary Approach.” We sincerely acknowledge the crew of RV Pelagia during the 64PE529 expeditions for their support in collecting CTD observations. Furthermore, we sincerely thank two anonymous referees for their valuable comments and suggestions, which significantly enhanced the clarity, precision, and overall quality of the paper.
REFERENCES
-
Andrade, I., Sangrà, P., Hormazabal, S. & Correa-Ramirez, M. 2014. Island mass effect in the Juan Fernández Archipelago, Southeastern Pacific. Deep Sea Research Part I: Oceanographic Research Papers, 84, 86-99. DOI: https://doi.org/10.1016/j.dsr.2013.10.009
» https://doi.org/10.1016/j.dsr.2013.10.009 -
Auclair, F., Benshila, R., Bordois, L., Boutet, M., Brémond, M., Caillaud, M., Cambon, G., Capet, X., Debreu, L., Ducousso, N., Dufois, F., Dumas, F., Ethé, C., Gula, J., Hourdin, C., Illig, S., Jullien, S., Le Corre, M., Le Gac, S., Le Gentil, S., Lemarié, F., Marchesiello, P., Mazoyer, C., Morvan, G., Nguyen, C., Penven, P., Person, R., Pianezze, J., Pous, S., Renault, L., Roblou, L., Sepulveda, A. & Theetten, S. 2023. Coastal and Regional Ocean COmmunity model (1.3.1). Zenodo. DOI: https://doi.org/10.5281/zenodo.11036034
» https://doi.org/10.5281/zenodo.11036034 -
Bak, R. P. M., Nieuwland, G. & Meesters, E. H. 2005. Coral reef crisis in deep and shallow reefs: 30 years of constancy and change in reefs of Curacao and Bonaire. Coral Reefs, 24, 475-479. DOI: https://doi.org/10.1007/s00338-005-0009-1
» https://doi.org/10.1007/s00338-005-0009-1 -
Bertoncelj, V. 2025. SCARIBOS hydrodynamic model outputs. NIOZ, 3. DOI: https://doi.org/10.25850/nioz/7b.b.7
» https://doi.org/10.25850/nioz/7b.b.7 -
Bertoncelj, V., Mienis, F., Stocchi, P. & Van Sebille, E. 2025a. Flow patterns, hotspots, and connectivity of land-derived substances at the sea surface of Curaçao in the southern Caribbean. Ocean Science, 21(3), 945-964. DOI: https://doi.org/10.5194/os-21-945-2025
» https://doi.org/10.5194/os-21-945-2025 -
Bertoncelj, V., Mienis, F. & Van Sebille, E. 2025b. Seasonal patterns of the Caribbean Current and its influence on the small island of Curaçao. ESS Open Archive. DOI: https://doi.org/10.22541/essoar.176365854.46687144/v1
» https://doi.org/10.22541/essoar.176365854.46687144/v1 -
Blanke, B., Arhan, M., Madec, G. & Roche, S. 1999. Warm water paths in the equatorial Atlantic as diagnosed with a general circulation model. Journal of Physical Oceanography, 29, 2753-2768. DOI: https://doi.org/10.1175/1520-0485(1999)029<2753:WWPITE>2.0.CO;2
» https://doi.org/10.1175/1520-0485(1999)029<2753:WWPITE>2.0.CO;2 -
Cetina-Heredia, P., Roughan, M., Van Sebille, E., Keating, S. & Brassington, G. B. 2019. Retention and leakage of water by mesoscale eddies in the East Australian Current system. Journal of Geophysical Research: Oceans, 124, 2485-2500. DOI: https://doi.org/10.1029/2018JC014482
» https://doi.org/10.1029/2018JC014482 -
Corredor, J. E. & Morell, J. M. 2001. Seasonal variation of physical and biogeochemical features in eastern Caribbean Surface Water. Journal of Geophysical Research, 106(C3), 4517-4525. DOI: https://doi.org/10.1029/2000JC000291
» https://doi.org/10.1029/2000JC000291 -
Dai, A. & Trenberth, K. E. 2002. Estimates of freshwater discharge from continents: Latitudinal and seasonal variations. Journal of Hydrometeorology, 3, 660-687. DOI: https://doi.org/10.1175/1525-7541(2002)003<0660:EOFDFC>2.0.CO;2
» https://doi.org/10.1175/1525-7541(2002)003<0660:EOFDFC>2.0.CO;2 -
Dauhajre, D. P., McWilliams, J. C. & Renault, L. 2019. Nearshore Lagrangian connectivity: Submesoscale influence and resolution sensitivity. Journal of Geophysical Research: Oceans , 124(7), 5180-5204. DOI: https://doi.org/10.1029/2019JC014943
» https://doi.org/10.1029/2019JC014943 -
De Falco, C., Desbiolles, F., Bracco, A. & Pasquero, C. 2022. Island mass effect: a review of oceanic physical processes. Frontiers in Marine Science, 9, 894860. DOI: https://doi.org/10.3389/fmars.2022.894860
» https://doi.org/10.3389/fmars.2022.894860 -
Delandmeter, P. & Van Sebille, E. 2019. The parcels v2.0 lagrangian framework: new field interpolation schemes. Geoscientific Model Development, 12(8), 3571-3584. DOI: https://doi.org/10.5194/gmd-12-3571-2019
» https://doi.org/10.5194/gmd-12-3571-2019 -
Devlin, M. J. & Brodie, J. 2005. Terrestrial discharge into the Great Barrier Reef Lagoon: nutrient behavior in coastal waters. Marine Pollution Bulletin, 51(1-4), 9-22. DOI: https://doi.org/10.1016/j.marpolbul.2004.10.037
» https://doi.org/10.1016/j.marpolbul.2004.10.037 -
Döös, K., Nycander, J. & Coward, A. C. 2008. Lagrangian decomposition of the Deacon Cell. Journal of Geophysical Research: Oceans , 113(C7). DOI: https://doi.org/10.1029/2007JC004351
» https://doi.org/10.1029/2007JC004351 -
Droghei, R., Buongiorno Nardelli, B. & Santoleri, R. 2016. Combining in-situ and satellite observations to retrieve salinity and density at the ocean surface. Journal of Atmospheric and Oceanic Technology, 33(6), 1211-1223. DOI: https://doi.org/10.1175/JTECH-D-15-0194.1
» https://doi.org/10.1175/JTECH-D-15-0194.1 -
Egbert, G. D. & Erofeeva, S. Y. 2002. Efficient inverse modeling of barotropic ocean tides. Journal of Atmospheric and Oceanic Technology , 19(2), 183-204. DOI: https://doi.org/10.1175/1520-0426(2002)019<0183:EIMOBO>2.0.CO;2
» https://doi.org/10.1175/1520-0426(2002)019<0183:EIMOBO>2.0.CO;2 -
Fairall, C. W., Bradley, E. F., Hare, J. E., Grachev, A. A. & Edson, J. B. 2003. Bulk parameterization of air-sea fluxes: Updates and verification for the COARE algorithm. Journal of Climate, 16(4), 571-591. DOI: https://doi.org/10.1175/1520-0442(2003)016<0571:BPOASF>2.0.CO;2
» https://doi.org/10.1175/1520-0442(2003)016<0571:BPOASF>2.0.CO;2 -
Falter, J. L., Lowe, R. J., Zhang, Z. & Mcculloch, M. 2013. Physical and biological controls on the carbonate chemistry of coral reef waters: effects of metabolism, wave forcing, sea level, and geomorphology. PLoS ONE, 8, e53303. DOI: https://doi.org/10.1371/journal.pone.0053303
» https://doi.org/10.1371/journal.pone.0053303 -
GEBCO Bathymetric Compilation Group. 2023. The GEBCO_2023 Grid - a continuous terrain model of the global oceans and land. NERC EDS British Data Centre NOC. Available from: Available from: https://doi.org/10.5285/1c44ce99-0a0d-5f4f-e063-7086abc0ea0f Access date: 2025 May 22.
» https://doi.org/10.5285/1c44ce99-0a0d-5f4f-e063-7086abc0ea0f -
Gove, J. M., Merrifield, M. A. & Brainard, R. E. 2006. Temporal variability of current‐driven upwelling at Jarvis Island. Journal of Geophysical Research: Oceans , 111(C12). DOI: https://doi.org/10.1029/2005JC003161
» https://doi.org/10.1029/2005JC003161 -
Gove, J. M., McManus, M. A., Neuheimer, A. B., Polovina, J. J., Drazen, J. C., Smith, C. R., Merrifield, M. A., Friedlander, A. M., Ehses, J. S., Young, C. W., Dillon, A. K. & Williams, G. J. 2016. Near-island biological hotspots in barren ocean basins. Nature Communications, 7(10581). DOI: https://doi.org/10.1038/ncomms10581
» https://doi.org/10.1038/ncomms10581 -
Guinehut, S., Dhomps, A.-L., Larnicol, G. & Le Traon, P.-Y. 2012. High resolution 3-D temperature and salinity fields derived from in situ and satellite observations. Ocean Science , 8(5), 845-857. DOI: https://doi.org/10.5194/os-8-845-2012
» https://doi.org/10.5194/os-8-845-2012 -
Hamner, W. M. & Hauri, I. R. 1981. Effects of Island Mass: Water flow and plankton pattern around a reef in the Great Barrier Reef lagoon, Australia. Limnology and Oceanography, 26(6), 1084-1102. DOI: https://doi.org/10.4319/lo.1981.26.6.1084
» https://doi.org/10.4319/lo.1981.26.6.1084 -
Hernández-Guerra, A. & Joyce, T. M. 2000. Water masses and circulation in the surface layers of the Caribbean at 66 W. Geophysical Research Letters, 27(21), 3497-3500. DOI: https://doi.org/10.1029/1999GL011230
» https://doi.org/10.1029/1999GL011230 -
Hersbach, H., Bell, B., Berrisford, P., Hirahara, S., Horányi, A., Muñoz-Sabater, J., Nicolas, J., Peubey, C., Radu, R., Schepers, D., Simmons, A., Soci, C., Abdalla, S., Abellan, X., Balsamo, G., Bechtold, P., Biavati, G., Bidlot, J., Bonavita, M., De Chiara, G., Dahlgren, P., Dee, D., Diamantakis, M., Dragani, R., Flemming, J., Forbes, R., Fuentes, M., Geer, A., Haimberger, L., Healy, S., Hogan, R. J., Hólm, E., Janisková, M., Keeley, S., Laloyaux, P., Lopez, P., Lupu, C., Radnoti, G., De Rosnay, P., Rozum, I., Vamborg, F., Villaume, S. & Thépaut, J. N. 2020. The ERA5 global reanalysis. Quarterly Journal of the Royal Meteorological Society, 146(730), 1999-2049. DOI: https://doi.org/10.1002/qj.3803
» https://doi.org/10.1002/qj.3803 -
Hirsh, H. K., Oliver, T. A., Barkley, H. C., Drupp, P. S., Mackenzie, F. T., Rivest, E. B., Walker, S. J., Young, C. W. & Sutton, A. J. 2023. Predicting coral reef carbonate chemistry through statistical modeling: constraining nearshore residence time around Guam. Aquatic Geochemistry, 29, 73-94. DOI: https://doi.org/10.1007/s10498-023-09411-6
» https://doi.org/10.1007/s10498-023-09411-6 -
Jin, S., Nie, X., Wang, G., Teng, F. & Xu, T. 2023. Analysis of the distribution and seasonal variability of the South China Sea water masses based on the K-means cluster method. Journal of Marine Science and Engineering, 11(3), 485. DOI: https://doi.org/10.3390/jmse11030485
» https://doi.org/10.3390/jmse11030485 -
Kruijssen, T. P., Wit, M. R. J., Van Breukelen, B. M., Van Der Ploeg, M. & Bense, V. F. 2024. Hydrogeological conceptualization of a small island groundwater system using historical data. Netherlands Journal of Geosciences, 103, e27. DOI: https://doi.org/10.1017/njg.2024.21
» https://doi.org/10.1017/njg.2024.21 -
Large, W. G., McWilliams, J. C. & Doney, S. C. 1994. Oceanic vertical mixing: A review and a model with a nonlocal boundary layer parameterization. Reviews of Geophysics, 32(4), 363-403. DOI: https://doi.org/10.1029/94RG01872
» https://doi.org/10.1029/94RG01872 -
Lellouche, J.-M., Greiner, E., Bourdallé-Badie, R., Garric, G., Melet, A., Drévillon, M., Bricaud, C., Hamon, M., Le Galloudec, O., Regnier, C., Candela, T., Testut, C.-E., Gasparin, F., Ruggiero, G., Benkiran, M., Drillet, Y. & Le Traon, P.-Y. 2021. The Copernicus global 1/12° oceanic and sea ice GLORYS12 reanalysis. Frontiers in Earth Science, 9, 698876. DOI: https://doi.org/10.3389/feart.2021.698876
» https://doi.org/10.3389/feart.2021.698876 -
Liu, Y., Xie, L., Morrison, J., Kamykowski, D. & Sweet, W. 2014. Ocean circulation and water mass characteristics around the Galápagos Archipelago simulated by a multiscale nested ocean circulation model. International Journal of Oceanography, 2014(1), 198686. DOI: https://doi.org/10.1155/2014/198686
» https://doi.org/10.1155/2014/198686 -
Lowe, R. J. & Falter, J. L. 2015. Oceanic forcing of coral reefs. Annual Review of Marine Science, 7, 43-66. DOI: https://doi.org/10.1146/annurev-marine-010814-015834
» https://doi.org/10.1146/annurev-marine-010814-015834 -
Mienis, F. & Bertoncelj, V. 2025. Depth, potential T, practical S, density data 64PE52. NIOZ, 1. DOI: https://doi.org/10.25850/nioz/7b.b.1j
» https://doi.org/10.25850/nioz/7b.b.1j -
Monismith, S. G. 2007. Hydrodynamics of coral reefs. Annual Review of Fluid Mechanics, 39, 37-55. DOI: https://doi.org/10.1146/annurev.fluid.38.050304.092125
» https://doi.org/10.1146/annurev.fluid.38.050304.092125 -
Nelson, C. E., Alldredge, A. L., Mccliment, E. A., Amaral-Zettler, L. A. & Carlson, C. A. 2011. Depleted dissolved organic carbon and distinct bacterial communities in the water column of a rapid-flushing coral reef ecosystem. ISME Journal, 5(8), 1374-1387. DOI: https://doi.org/10.1038/ismej.2011.12
» https://doi.org/10.1038/ismej.2011.12 -
Painter, S. C., Artioli, Y., Amir, F. H., Arnull, J., Ganeshram, R. S., Ibrahim, N., Jickells, T. D., Johnson, M., Le Moigne, F. A. C., Mawji, E., Mcneill, S., Mimura, T., Panton, A., Rees, A. P., Robinson, C., Sakamoto, C. M., Sanders, R., Stinchcombe, M. C., Turrell, E., Wihsgott, J. U. & Woodward, E. M. S. 2023. Anthropogenic nitrogen pollution threats and challenges to the health of South Asian coral reefs. Frontiers in Marine Science , 10, 1187804. DOI: https://doi.org/10.3389/fmars.2023.1187804
» https://doi.org/10.3389/fmars.2023.1187804 -
Randall, C. J., Toth, L. T., Leichter, J. J., Maté, J. L. & Aronson, R. B. 2020. Upwelling buffers climate change impacts on coral reefs of the eastern tropical Pacific. Ecology, 101(2), e02918. DOI: https://doi.org/10.1002/ecy.2918
» https://doi.org/10.1002/ecy.2918 -
Richmond, R. H. 1993. Coral reefs: present problems and future concerns resulting from anthropogenic disturbance. American Zoologist, 33(6), 524-536. DOI: https://doi.org/10.1093/icb/33.6.524
» https://doi.org/10.1093/icb/33.6.524 -
Rio, M.-H., Mulet, S. & Picot, N. 2014. Beyond GOCE for the ocean circulation estimate: Synergetic use of altimetry, gravimetry, and in situ data provides new insight into geostrophic and Ekman currents. Geophysical Research Letters , 41(24), 8918-8925. DOI: https://doi.org/10.1002/2014GL061773
» https://doi.org/10.1002/2014GL061773 -
Rogers, J. S., Mayer, F. T., Davis, K. A. & Fringer, O. B. 2022. On internal tides driving residual currents and upwelling on an island. Journal of Geophysical Research: Oceans , 127(7), e2021JC018261. DOI: https://doi.org/10.1029/2021JC018261
» https://doi.org/10.1029/2021JC018261 -
Roughan, M., Macdonald, H. S., Baird, M. E. & Glasby, T. M. 2011. Modelling coastal connectivity in a western boundary current: seasonal and inter-annual variability. Deep Sea Research Part II: Topical Studies in Oceanography, 58, 628-644. DOI: https://doi.org/10.1016/j.dsr2.2010.06.004
» https://doi.org/10.1016/j.dsr2.2010.06.004 -
Rueda-Roa, D. T., Ezer, T. & Muller-Karger, F. E. 2018. Description and mechanisms of the mid-year upwelling in the southern Caribbean Sea from remote sensing and local data. Journal of Marine Science and Engineering , 6(2), 36. DOI: https://doi.org/10.3390/jmse6020036
» https://doi.org/10.3390/jmse6020036 -
Rühs, S., Schwarzkopf, F. U., Speich, S. & Biastoch, A. 2019. Cold vs. warm water route-sources for the upper limb of the Atlantic Meridional Overturning Circulation revisited in a high-resolution ocean model. Ocean Science , 15(3), 489-512. DOI: https://doi.org/10.5194/os-15-489-2019
» https://doi.org/10.5194/os-15-489-2019 -
Saint-Amand, A., Lambrechts, J. & Hanert, E. 2023. Biophysical models resolution affects coral connectivity estimates. Scientific Reports, 13(9414). DOI: https://doi.org/10.1038/s41598-023-36158-5
» https://doi.org/10.1038/s41598-023-36158-5 -
Sánchez Barranco, V., Bertoncelj, V., Mienis, F., Reichart, G. J., Vermeij, M. J. A. & De Nooijer, L. J. 2025a. Environmental and anthropogenic causes for seasonal and spatial variability in dissolved substances in the coastal waters of Curaçao (Caribbean Sea). Journal of Marine Systems. DOI: http://dx.doi.org/10.2139/ssrn.5496135
» http://dx.doi.org/10.2139/ssrn.5496135 -
Sánchez Barranco, V., Schellenber, L., Mienis, F., Brussaard, C. P. D., Haas, A. F. & De Nooijer, L. J. 2025b. Seasonal changes in bay water column properties and their influence on the distribution of dissolved and particulate substances along the south coast of Curaçao (Caribbean Sea). Marine Pollution Bulletin , 212, 117545. DOI: http://dx.doi.org/10.1016/j.marpolbul.2025.117545
» http://dx.doi.org/10.1016/j.marpolbul.2025.117545 -
Sandin, S. A., Alcantar, E., Clark, R., De León, R., Dilrosun, F., Edwards, C. B., Estep, A. J., Eynaud, Y., French, B. J. & Fox, M. D. 2022. Benthic assemblages are more predictable than fish assemblages at an island scale. Coral Reefs , 41, 1031-1043. DOI: https://doi.org/10.1007/s00338-022-02272-5
» https://doi.org/10.1007/s00338-022-02272-5 -
Silva, M., Araujo, M., Geber, F., Medeiros, C., Araujo, J., Noriega, C. & Costa Da Silva, A. 2021. Ocean dynamics and topographic upwelling around the Aracati Seamount-North Brazilian Chain from in situ observations and modeling results. Frontiers in Marine Science , 8, 609113. DOI: https://doi.org/10.3389/fmars.2021.609113
» https://doi.org/10.3389/fmars.2021.609113 -
Spring, D. L. & Williams, G. J. 2023. Influence of upwelling on coral reef benthic communities: a systematic review and meta-analysis. Proceedings of the Royal Society B, 290(1995), 20230023. DOI: https://doi.org/10.1098/rspb.2023.0023
» https://doi.org/10.1098/rspb.2023.0023 -
Steward, R., Chopin, P. & Verburg, P. H. 2025. Impact-driven spatial planning for future-proofing small island states: A scenario-based land model analysis in Curaçao. Applied Geography, 178, 103604. DOI: https://doi.org/10.1016/j.apgeog.2025.103604
» https://doi.org/10.1016/j.apgeog.2025.103604 -
Tamsitt, V., Drake, H. F., Morrison, A. K., Talley, L. D., Dufour, C. O., Gray, A. R., Griffies, S. M., Mazloff, M. R., Sarmiento, J. L., Wang, J. & Weijer, W. 2017. Spiraling pathways of global deep waters to the surface of the Southern Ocean. Nature Communications , 8(172). DOI: https://doi.org/10.1038/s41467-017-00197-0
» https://doi.org/10.1038/s41467-017-00197-0 -
Valcarcel, A., O’Callaghan, J. & Vermeij, M. J. A. 2025. Interplay of wind-driven processes and subsurface oscillations along the leeward coastline of a tropical reef island. Frontiers in Marine Science , 12, 1546596. DOI: https://doi.org/10.3389/fmars.2025.1546596
» https://doi.org/10.3389/fmars.2025.1546596 -
Van Duyl, F. C., Post, V. E. A., Van Breukelen, B. M., Bense, V., Visser, P. M., Meesters, E. H., Koeniger, P. & Vermeij, M. J. A. 2024. Composition and distribution of the near-shore waters bordering the coral reefs of Aruba, Bonaire, and Curaçao in the Southern Caribbean. Marine Pollution Bulletin , 209, 117297. DOI: https://doi.org/10.1016/j.marpolbul.2024.117297
» https://doi.org/10.1016/j.marpolbul.2024.117297 -
Van Sebille, E., England, M. H., Zika, J. D. & Sloyan, B. M. 2012. Tasman leakage in a fine-resolution ocean model. Geophysical Research Letters , 39(6), L06601. DOI: https://doi.org/10.1029/2012GL051004
» https://doi.org/10.1029/2012GL051004 -
Van Sebille, E., Spence, P., Mazloff, M. R., England, M. H., Rintoul, S. R. & Saenko, O. A. 2013. Abyssal connections of Antarctic Bottom Water in a Southern Ocean state estimate. Geophysical Research Letters , 40(10), 2177-2182. DOI: https://doi.org/10.1002/grl.50483
» https://doi.org/10.1002/grl.50483 -
Van Sebille, E., Sprintall, J., Schwarzkopf, F. U., Sen Gupta, A., Santoso, A., England, M. H., Cronin, M. F. & Keating, S. R. 2014. Pacific‐to‐Indian Ocean connectivity: Tasman leakage, Indonesian Throughflow, and the role of ENSO. Journal of Geophysical Research: Oceans , 119(2), 1365-1382. DOI: https://doi.org/10.1002/2013JC009525
» https://doi.org/10.1002/2013JC009525 -
Van Sebille, E., Griffies, S. M., Abernathey, R., Adams, T. P., Berloff, P., Biastoch, A., Blanke, B., Chassignet, E. P., Cheng, Y., Cotter, C. J., Deleersnijder, E., Döös, K., Drake, H. F., Drijfhout, S., Gary, S. F., Heemink, A. W., Kjellsson, J., Koszalka, I. M., Lange, M., Lique, C., Macgilchrist, G. A., Marsh, R., Mayorga Adame, C. G., Mctague, R., Msadek, R., Paldor, N., Paris, C. B., Piggott, M. D., Polton, J. A., Rühs, S., Shah, S. H. A. M., Thomas, M. D., Wang, J., Wolfram, P. J., Zanna, L. & ZIKA, J. D. 2018. Lagrangian ocean analysis: Fundamentals and practices. Ocean Modelling, 121, 49-75. DOI: https://doi.org/10.1016/j.ocemod.2017.11.008
» https://doi.org/10.1016/j.ocemod.2017.11.008 -
Vermeij, M. J., Bakker, J., Van Der Hal, N. & Bak, R. P. 2011. Juvenile coral abundance has decreased by more than 50% in only three decades on a small Caribbean island. Diversity, 3(3), 296-307. DOI: https://doi.org/10.3390/d3030296
» https://doi.org/10.3390/d3030296 -
Waitt Institute. 2017. Marine scientific assessment: the state of Curaçao’s coral reefs. La Jolla, Wait Institute. Available from: Available from: https://www.researchstationcarmabi.org/wp-content/uploads/2017/08/Waitt-2017-Status-of-Curacaoan-reefs_Low-Res-1.pdf Access date: 2025 May 22.
» https://www.researchstationcarmabi.org/wp-content/uploads/2017/08/Waitt-2017-Status-of-Curacaoan-reefs_Low-Res-1.pdf -
Wall, M., Putchim, L., Schmidt, G. M., Jantzen, C., Khokiattiwong, S. & Richter, C. 2015. Large-amplitude internal waves benefit corals during thermal stress. Proceedings of the Royal Society B: Biological Sciences, 282, 20140650. DOI: https://doi.org/10.1098/rspb.2014.0650
» https://doi.org/10.1098/rspb.2014.0650 -
Wang, Y. H., Dai, C. F. & Chen, Y. Y. 2007. Physical and ecological processes of internal waves on an isolated reef ecosystem in the South China Sea. Geophysical Research Letters , 34(18), L18. DOI: https://doi.org/10.1029/2007GL030658
» https://doi.org/10.1029/2007GL030658 -
Wear, S. L. & Thurber, R. V. 2015. Sewage pollution: mitigation is key for coral reef stewardship. Annals of the New York Academy of Sciences, 1355(1), 15-30. DOI: https://doi.org/10.1111/nyas.12785
» https://doi.org/10.1111/nyas.12785 -
Winter, G., Castelle, B., Lowe, R. J., Hansen, J. E. & McCall, R. 2020. When is flow re-entrainment important for the flushing time in coastal reef systems? Continental Shelf Research, 206, 104194. DOI: https://doi.org/10.1016/j.csr.2020.104194
» https://doi.org/10.1016/j.csr.2020.104194 -
Yit Sen Bull, C. & Van Sebille, E. 2016. Sources, fate, and pathways of Leeuwin Current water in the Indian Ocean and Great Australian Bight: A Lagrangian study in an eddy‐resolving ocean model. Journal of Geophysical Research: Oceans , 121(3), 1626-1639. DOI: https://doi.org/10.1002/2015JC011486
» https://doi.org/10.1002/2015JC011486
-
AI USE STATEMENT
Artificial intelligence tool (Claude by Anthropic) was used exclusively to refine the English language of this manuscript. No AI tools were used for data analysis, interpretation or content generation. The content was carefully reviewed by the authors to ensure consistency and correctness, and the authors are fully responsible for the final version of the manuscript.
-
FUNDING
This research has been supported by the Nederlandse Organisatie voor Wetenschappelijk Onderzoek (grant no. NWOCA.2019.003).