Strengthening ITF and weakening AMOC: time series evidence of trends and causal pathways to Agulhas variability
ABSTRACT
Multi-decadal observations and reanalysis products of major ocean circulation systems reveal contrasting trends and complex inter-basin connectivity patterns that challenge traditional conceptualizations of global ocean circulation. Using non-parametric trend analysis, multi-method causality testing, and wavelet coherence techniques, we analyzed volume transport time series spanning 1984-2023 for the Indonesian Throughflow (ITF), Agulhas Current system, and Atlantic Meridional Overturning Circulation (AMOC). The ITF demonstrates statistically significant strengthening, with geostrophic (ITF-G) and salinity (ITF-S) components increasing by 0.79 and 0.28 Sv decade-1, respectively (p<0.05). The temperature component (ITF-T) shows a positive but non-significant trend. Conversely, the AMOC at 26ºN from reanalysis exhibits robust weakening of -1.61 Sv decade-1 (p<0.0001), while satellite-derived Agulhas transport proxies show no significant long-term trends despite substantial interannual variability. Causality analysis reveals four statistically significant pathways linking ITF components to Agulhas variability with lag times of 0-18 months, supported by consensus across maximum cross-correlation, convergent cross mapping, and transfer entropy methods. However, no direct causal connections emerge between either Indo-Pacific system and the AMOC at 26ºN, indicating regional forcing dominance over global-scale coupling on observable timescales. Wavelet coherence analysis identifies dominant annual-scale coupling (0.87-1.30 years) in ITF-Agulhas relationships, with enhanced coherence during major climate events including the 1997-98 El Niño. These findings suggest that contemporary ocean circulation responds primarily to regional forcing mechanisms - intensified Maritime Continent rainfall driving ITF strengthening and weakened North Atlantic convection controlling AMOC decline - rather than operating as a tightly coupled global conveyor belt. The identified statistical relationships provide critical observational constraints for ocean circulation models and highlight the need for sustained monitoring as anthropogenic forcing continues to reshape ocean gateway dynamics.
Keywords:
Agulhas Current; Atlantic Meridional Overturning circulation; Indonesian throughflow; Ocean transport variability; Statistical causality
INTRODUCTION
The ocean’s meridional overturning circulation constitutes Earth’s primary mechanism for redistributing heat from equatorial to polar regions, fundamentally shaping global climate patterns and regional weather systems. This vast circulation network, comprising interconnected currents across all ocean basins, has emerged as a critical focus of climate studies due to mounting evidence of ongoing changes in response to contemporary climate forcing. Understanding the variability and trends of major ocean currents - particularly the Atlantic Meridional Overturning Circulation (AMOC), the Indonesian Throughflow (ITF), and the Agulhas Current system - has become essential for characterizing the evolution of the global ocean circulation system and its connections across ocean basins.
The modern understanding of ocean circulation rests upon theoretical foundations established over seven decades ago. Stommel (1948) provided the first mathematical explanation for the westward intensification of ocean currents, demonstrating that the latitudinal variation of the Coriolis parameter causes powerful western boundary currents such as the Gulf Stream and Kuroshio Current. This fundamental insight explained why ocean gyres exhibit asymmetric circulation patterns, with swift, narrow currents on western boundaries and broad, diffuse return flows in ocean interiors. Subsequently, Stommel (1961) demonstrated that thermohaline circulation could exist in multiple stable states, introducing the concept that ocean circulation might exhibit different equilibrium modes - a theoretical foundation that continues to inform contemporary ocean circulation studies.
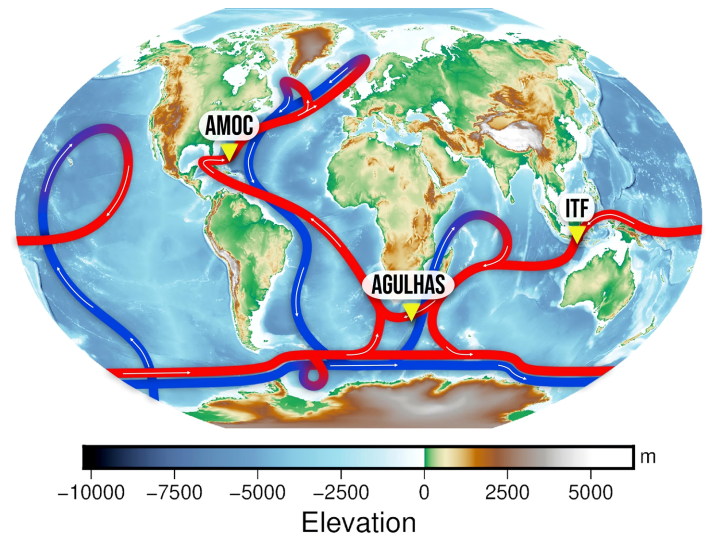
Building upon Stommel’s theoretical framework, Broecker (1987) conceptualized the global ocean circulation as a “great ocean conveyor belt”, a metaphor that captured both scientific and public imagination. This paradigm, elaborated in Broecker (1991), visualized ocean circulation as a continuous loop transporting warm surface waters poleward and cold deep waters equatorward, connecting all ocean basins in a coherent overturning circulation (Figure 1). While subsequent studies have revealed greater complexity than this simplified model suggests (Gordon, 1986), the conveyor belt concept established important links between ocean circulation variability and climate changes recorded in paleoclimate archives.

Global ocean conveyor belt circulation system, modified from Broecker (1991). Red pathways indicate warm surface currents; blue represents cold deep water circulation. The three analyzed current systems are labeled: AMOC, ITF, and Agulhas Current. Base map from SRTM15+V2.7 (Tozer et al., 2019) rendered using PyGMT (Wessel et al., 2019).
The global overturning circulation depends critically on three major current systems that facilitate interocean exchange and maintain the planetary-scale redistribution of heat and salt. The ITF represents the sole low-latitude pathway connecting the Pacific and Indian Oceans, with significant implications for Indo-Pacific climate dynamics. Early quantitative estimates by Wyrtki (1961) established the seasonal variability of ITF transport, while subsequent observations revealed its role as a “mix master” transforming Pacific waters through intense tidal mixing (Gordon, 2005). The landmark INSTANT program provided the first simultaneous measurements across all ITF passages, establishing a mean transport of approximately 15 Sverdrups (1 Sv≡106 m3 s-1) with significant interannual variability (Sprintall et al., 2009). Recent studies have documented ITF variability in response to intensified rainfall patterns (Huand and Sprintall, 2017), with Feng et al. (2018) synthesizing evidence for long-term changes linked to both regional and global climate forcing.
The connection between the ITF and Agulhas Current operates through complex pathways across the Indian Ocean. Durgadoo et al. (2017) demonstrated that ITF waters require 10-20 years to reach the Agulhas retroflection region via deep ocean pathways, though faster upper-ocean routes and atmospheric teleconnections may provide additional coupling mechanisms on shorter timescales. Understanding these ITF-Agulhas connections is crucial for assessing how Pacific-Indian Ocean exchange influences the Atlantic through Agulhas leakage.
The Agulhas Current system, Earth’s most powerful western boundary current, plays an equally important role in the global circulation through its unique retroflection process. Lutjeharms and van Ballegooyen (1988) provided the seminal description of how the Agulhas Current dramatically turns back upon itself south of Africa, shedding massive rings that carry warm, salty Indian Ocean water into the Atlantic. Note that while the Agulhas is not the only current that retroflects (the Brazil Current and East Australian Current also exhibit retroflection), its retroflection is the most pronounced and dynamically important for inter-ocean exchange. This “Agulhas leakage” constitutes an important component of the global thermohaline circulation, potentially influencing Atlantic overturning by supplying salt that affects North Atlantic water mass properties (Biastoch et al., 2008; Gordon, 1986). Observational programs have revealed the Agulhas Current extends to depths exceeding 2200 meters with transport around 70 Sv, though recent evidence suggests broadening rather than strengthening of the current system (Beal and Elipot, 2016). Climate model simulations indicate that poleward shifts in Southern Hemisphere westerlies could modify Agulhas leakage, with potential impacts on Atlantic circulation (Biastoch et al., 2009; Durgadoo et al., 2017).
The AMOC has emerged as a component of global ocean circulation showing significant response to contemporary climate change. Building upon theoretical predictions and modeling studies (Rahmstorf, 1995), observational evidence now indicates changes in AMOC strength. Caesar et al. (2018) identified a characteristic sea surface temperature pattern associated with AMOC variability, suggesting approximately 15% weakening since the mid-twentieth century. This finding has been corroborated by proxy reconstructions indicating that current AMOC strength represents relatively weak conditions compared to the past millennium (Caesar et al., 2021; Thornalley et al. 2021).
Recent assessments of AMOC variability have employed diverse methodological approaches. Lenton et al. (2008) identified the AMOC among several components of the Earth system that could undergo significant transitions. Boers (2021) analyzed multiple AMOC proxy records, examining statistical indicators of circulation 98 changes. van Westen et al. (2024) used climate model simulations to investigate AMOC stability, identifying freshwater transport at 34ºS as a relevant diagnostic indicator. Ditlevsen and Ditlevsen (2023) applied statistical methods to project potential future AMOC evolution, though their specific timelines remain subject to scientific discussion.
Importantly, recent work has revealed that the AMOC lacks strong meridional coherence, with variations at different latitudes showing limited correlation (Lozier, 2023). This finding has significant implications for understanding connections between the AMOC at 26ºN (where it is most extensively monitored) and potential influences from the South Atlantic, including Agulhas leakage. The lack of meridional coherence suggests that local and regional processes may dominate AMOC variability at specific latitudes, potentially obscuring far-field influences from the Indo-Pacific sector.
Despite theoretical advances and expanding observational evidence, quantifying ocean circulation changes remains challenging. Direct observations of ocean currents are spatially and temporally limited, necessitating reliance on indirect proxies and model-based reconstructions. The inherent variability of ocean circulation on multiple timescales - from seasonal to multidecadal - complicates detection of long-term trends. Furthermore, systematic differences between climate models and observations, particularly in representing freshwater transport and water mass formation processes, introduce uncertainty in projections. Inter-basin connections through both oceanic pathways and atmospheric teleconnections add complexity, as changes in one region can influence the global circulation system (McGregor et al., 2014; Sun and Thompson, 2020).
Given the critical importance of ocean circulation for global climate and the need to better understand ongoing changes, comprehensive statistical analysis of variability and trends in major ocean currents has become essential. This study presents an integrated examination of the ITF, Agulhas Current system, and AMOC, employing multiple statistical techniques to quantify long-term trends and investigate potential relationships between these systems. By analyzing these current systems within a unified statistical framework, we aim to characterize their temporal evolution over recent decades through robust trend analysis, identify and quantify statistical causal pathways and teleconnections between ocean basins, examine the time-frequency characteristics of inter-basin coupling, and assess the degree of connectivity within the global ocean circulation system. Through systematic application of complementary analytical methods - including non-parametric trend detection, multi-method causality analysis, and wavelet coherence - this study provides empirical evidence for understanding how major ocean currents respond to contemporary climate forcing and interact across basin scales.
METHODS
DATA ACQUISITION
Monthly AMOC volumetric transport data were obtained from the Ocean Monitoring Indicator (OMI) of the Copernicus Marine Environment Monitoring Service (CMEMS), specifically the AMOC timeseries at 26ºN from Reanalysis (E.U. Copernicus Marine Service Information (CMEMS), 2024a) spanning January 1993 to December 2023. This reanalysis product combines multiple ocean models validated against direct observations from the RAPID array (Duchez et al., 2016; Moat et al., 2025), with demonstrated strong agreement (monthly correlation r=0.82, annual correlation r=0.96) as documented in the official CMEMS Quality Information Document (Jackson, 2024). The ensemble approach utilizes the Global Ocean Reanalysis and Simulation version 2 volume 4 (GLORYS2V4) from Mercator Ocean (Lellouche et al., 2013), the Copernicus Global Ocean Reanalysis (C-GLORS) from the Centro Euro-Mediterraneo sui Cambiamenti Climatici (CMCC) (Storto et al., 2016), Ocean Reanalysis System 5 (ORAS5) from the European Centre for Medium-Range Weather Forecasts (ECMWF) (Zuo et al., 2017), and the Global Seasonal forecasting system version 5 (GloSea5) (MacLachlan et al., 2015). These four reanalyses were employed to calculate time series of the AMOC maximum transport and climatological mean profiles, which were subsequently combined to form the Global Ocean Ensemble Physics Reanalysis (E.U. Copernicus Marine Service Information (CMEMS) 2024b) with an ensemble mean and spread calculated as twice the ensemble standard deviation in comparison with the RAPID observational AMOC data.
ITF volumetric transport data were obtained from the updated observational estimates of Guo et al. (2023), specifically the monthly time series of total ITF geostrophic transport (ITF-G), temperature component (ITF-T), and salinity component (ITF-S) at the IX1 section between Indonesia and Australia spanning January 1984 to December 2017. These components represent the decomposition of total geostrophic transport into contributions from temperature and salinity variations, with ITF-G representing the total, ITF-T the temperature-driven component, and ITF-S the salinity-driven component, following Guo et al. (2023)’s geostrophic decomposition methodology where the temperature and salinity components together constitute the total geostrophic transport. These transport estimates were derived from expendable bathythermo-graph (XBT) deployments and complementary observational data including mechanical bathythermographs, conductivity-temperature-depth profiles, bottle samples, moored buoys, gliders, and Argo floats, totaling 764,481 profiles with comprehensive bias corrections applied following Cheng et al. (2014) for XBT data and Gouretski and Cheng (2020) for mechanical bathythermograph data. The salinity effect was incorporated using two versions of the Institute of Atmospheric Physics (IAP) monthly gridded salinity datasets (Cheng et al., 2020, Tian et al., 2022).
Agulhas Current volume transport data were derived from the satellite altimetry proxy dataset of Beal and Elipot (2016), who developed 22-year proxy time series spanning September 1992 to December 2014. The transport estimates were constructed by combining three years of in situ measurements from the Agulhas Current Time-series (ACT) mooring array deployed across the current at 34ºS with coincident along-track satellite altimeter data from the TOPEX/Poseidon, Jason-1, and Jason-2 missions. Two distinct transport metrics were utilized: the streamwise jet transport (Agulhas Jet), representing the southwestward component integrated to the first maximum beyond the half-width of the mean jet at 110 km offshore, and the boundary layer transport (Agulhas Box), representing the net transport integrated across the full 219 km width of the current system. The resulting proxy estimates explained 55% of the variance for Agulhas Jet and 61% of the variance for Agulhas Box during the three-year validation period, with mean transport values of -84±24 Sv for the jet transport and -77±32 Sv for the boundary layer transport, where negative values indicate southwestward flow.
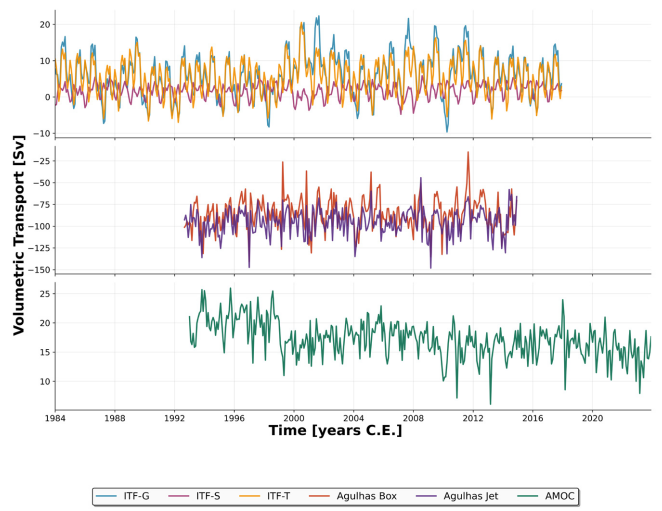
Figure 2 presents the complete time series of volume transport data used in this study. All datasets were processed to monthly resolution to enable direct comparison.

Time series of oceanic volume transport data from 1984 to 2022. Upper panel: ITF components including Geostrophic (ITF-G, blue), Salinity (ITF-S, purple), and Temperature (ITF-T, orange) transports. Middle panel: Agulhas Current transports showing Agulhas Box (red) and Agulhas Jet (purple) components. Lower panel: AMOC (green). All data are presented at monthly resolution with transport units in Sv. For ITF, positive values indicate transport toward the Indian Ocean. For Agulhas Current, negative values represent the characteristic southwestward flow. For AMOC, values indicate the strength of the meridional overturning circulation.
STATISTICAL ANALYSIS METHODS
DESCRIPTIVE STATISTICS AND TREND ANALYSIS
comprehensive descriptive statistics were computed for all oceanic volume transport time series to characterize their distributional properties. For robust trend detection, we employed the Theil-Sen estimator (Theil, 1950; Sen, 1968), a non-parametric regression method that calculates the median of all pairwise slopes between data points. This approach is particularly suitable for oceanographic time series as it: (1) makes no assumptions about error distributions, (2) is resistant to outliers that are common in ocean transport data, and (3) does not require calculation of confidence intervals as the estimator itself represents a robust central tendency. Statistical significance was assessed using the Mann-Kendall test (Mann, 1945; Kendall, 1975) at the α=0.05 level. Trends are reported in Sv per decade for consistency with oceanographic literature conventions. To address concerns about differing temporal coverage among datasets, we performed sensitivity analyses using the common overlap period (1993-2014) for all time series. Detailed mathematical formulations are provided in Appendix A.
STATISTICAL CAUSALITY ANALYSIS
The statistical causal relationships between ocean transport systems were investigated using a multi-method approach combining three complementary techniques (Runge et al., 2019): Maximum Cross-Correlation (MCC) for linear lagged relationships (Bretherton et al., 1992), Convergent Cross Mapping (CCM) for nonlinear causality (Sugihara et al., 2012), and Transfer Entropy (TE) for information-theoretic coupling (Schreiber, 2000). Statistical significance was assessed through block bootstrap resampling (500-1000 surrogates) that preserves the autocorrelation structure inherent in oceanographic time series (Efron and Tibshirani, 1994; Romano, 1994). Pathways achieving consensus across at least two methods (consensus score≥2) were considered robust. This multi-method consensus framework provides greater confidence in identifying genuine ocean teleconnections while reducing the likelihood of spurious detections that might arise from any single method’s limitations or assumptions (Runge et al., 2019).
WAVELET COHERENCE ANALYSIS
Time-frequency characteristics of statistically significant causal pathways were examined using wavelet coherence analysis following Torrence and Compo (1998) and Grinsted et al. (2004). We employed the Morlet wavelet with central frequency ω0=6, which provides optimal balance between time and frequency localization as established in previous oceanographic applications (Farge, 1992). Statistical significance was assessed using Monte Carlo methods with AR(1) surrogate data (Torrence and Webster, 1999). Complete mathematical frameworks for all methods are provided in Appendix A.
RESULTS
DESCRIPTIVE STATISTICS OF OCEAN VOLUME TRANSPORT
The descriptive statistical analysis reveals distinct distributional characteristics across the three major ocean circulation systems examined (Table 1, Figure 3).

Kernel density estimation (KDE) distributions of oceanic volume transport for all analyzed components. Top panel: ITF components showing ITF-G (red), ITF-T (green), and ITF-S (blue). Middle panel: Agulhas Current transports displaying Agulhas Box (purple) and Agulhas Jet (orange). Bottom panel: Atlantic Meridional Overturning Circulation (AMOC, cyan). The distributions illustrate the probability density of transport values, with ITF and AMOC showing positive transport values and Agulhas Current exhibiting negative values indicative of southwestward flow.The ITF components exhibit high variability, with coefficients of variation exceeding 90% for all components. ITF-S shows the smallest absolute transport values but the highest relative variability (CV=118.0%), indicating substantial fluctuations relative to its mean. The distribution displays moderate negative skewness (-0.569), indicating a left-skewed pattern. The AMOC demonstrates the most stable transport characteristics with the lowest coefficient of variation (18.1%), while the Agulhas system shows intermediate variability with strong mean southwestward flow exceeding 85 Sv. The comparative analysis of robust versus classical statistics reveals consistent patterns across all transport components, with trimmed means showing minimal deviation from arithmetic means (typically less than 2%), suggesting limited influence from extreme values despite the presence of outliers in several time series.
ANNUAL CYCLE CHARACTERISTICS
Seasonal patterns reveal pronounced variability across different current systems (Figure 4). The ITF components display strong seasonal cycles with peak transports during the Southeast Monsoon (July-September) and minima in April. ITF-G reaches its peak transport of 13.0 Sv in September, while its minimum occurs in April at -0.3 Sv, resulting in a seasonal amplitude of 13.3 Sv. The Agulhas Current system shows opposite seasonality, with strongest southwestward flow in March and weakest in July. The AMOC exhibits modest seasonal variation with maximum in November (18.7 Sv) and minimum in April (15.2 Sv), creating a seasonal amplitude of 3.5 Sv.

Monthly climatological mean volume transport for all ocean current components. Top panel: ITF components (ITF-G in orange, ITF-T in teal, ITF-S in blue). Middle panel: Agulhas Current transports (Agulhas Box in green, Agulhas Jet in purple). Bottom panel: Atlantic Meridional Overturning Circulation (AMOC in red). Shaded areas represent standard errors around the monthly means. All values are in Sv.
LONG-TERM TRENDS
Analysis of multi-decadal transport trends using the Theil-Sen estimator reveals significant changes in half of the examined current systems (Table 2, Figure 5).

Long-term trends in oceanic volume transport from 1984-2023. Top panel: ITF components (ITF-G in red, ITF-T in cyan, ITF-S in blue). Middle panel: Agulhas Current transports (Agulhas Box in purple, Agulhas Jet in orange). Bottom panel: AMOC (cyan). Individual monthly data points are shown with Theil-Sen regression trends over the available data periods. Solid lines indicate statistically significant trends (p<0.05), dashed lines indicate non-significant trends. All transport values in Sv.
The ITF shows significant strengthening in geostrophic (0.79 Sv/decade, p=0.012) and salinity (0.28 230 Sv/decade, p=0.007) components, while the temperature component shows a positive but non-significant trend. The AMOC exhibits highly significant weakening (-1.61 Sv/decade, p<0.0001), representing the only significant negative trend detected. The Agulhas Current system shows no statistically significant trends during the observation period. Sensitivity analysis using the common period (1993-2014) confirms the robustness of these findings, with ITF-G maintaining significant strengthening (0.72 Sv/decade, p=0.024) and AMOC showing consistent weakening (-1.48 Sv/decade, p<0.001).
STATISTICAL CAUSAL RELATIONSHIPS BETWEEN CURRENT SYSTEMS
The causality analysis reveals multiple significant connections linking the Indonesian Throughflow and Agulhas system, but notably no connections to the AMOC at 26ºN (Table 3).
Four robust pathways emerge from ITF components to Agulhas transport with varying lag times (0-18 months), suggesting multiple mechanisms of interaction. The geostrophic component of the ITF emerges as a key driver of Agulhas variability through two distinct pathways. The absence of significant connections to the AMOC is consistent with documented lack of meridional coherence in Atlantic overturning (Lozier, 2023). TE values remain relatively uniform across all pathways, ranging from 0.162 to 0.192 normalized bits, with the ITF-T to Agulhas Jet pathway showing the highest information flow despite lacking statistical significance.
WAVELET COHERENCE OF SIGNIFICANT CAUSAL PATHWAYS
Wavelet coherence analysis of the four statistically significant pathways reveals dominant coupling at annual periods (Figure 6).

Wavelet coherence between ITF components and Agulhas transport metrics. (a) ITF Salinity and Agulhas Box transport. (b) ITF Temperature and Agulhas Box transport. (c) ITF Geostrophic and Agulhas Jet transport. (d) ITF Geostrophic and Agulhas Box transport. The magnitude-squared coherence is shown by the color scale (0-1), with warmer colors indicating stronger coherence. Black arrows indicate phase relationships, displayed only where coherence exceeds 0.7. Rightward arrows indicate in-phase behavior, leftward arrows indicate anti-phase relationships, and vertical arrows indicate quadrature. The white dashed lines delineate the cone of influence where edge effects become significant.
All pathways show concentration of coherent power between 0.87-1.30 years, corresponding to annual-scale variability. For the ITF Salinity-Agulhas Box pathway (Figure 6a), the average coherence across all time-frequency space is 0.315, with 6.8% of the region exhibiting coherence values above 0.7. The five most dominant periods show average coherence values ranging from 0.545 to 0.599, with the strongest occurring at 1.23 years. High coherence episodes coincide with major climate events, particularly the 1997-98 El Niño (visible as enhanced coherence across all panels during 1997-1999) and the early 2000s Indo-Pacific regime shift. The approximately in-phase relationships (phase angles<11º) suggest near-simultaneous responses to common forcing rather than slow oceanic propagation. The temporal clustering of high coherence during 1995-1998, 1999-2004, and 2012-2014 appears consistently across multiple pathways.
DISCUSSION
The analysis of multi-decadal ocean transport time series reveals significant trends and teleconnections within the global circulation system, with important implications for understanding climate variability and change. Our findings demonstrate strengthening of the ITF, weakening of the AMOC, and robust statistical causal connections between the ITF and Agulhas Current system, though notably without direct linkages to the AMOC at 26ºN.
The observed strengthening trends in ITF-G (0.79 Sv/decade) and ITF-S (0.28 Sv/decade) align remarkably well with recent observational evidence. Hu & Sprintall (2017) reported ITF strengthening linked to rainfall intensification over the Maritime Continent, while Feng et al. (2018) documented a centennial strengthening trend of approximately 1 Sv/decade. Our results fall within this range, though slightly lower than the 1.33 Sv/decade reported for more recent periods. The dominance of the geostrophic component in driving the overall trend suggests that large-scale pressure gradient changes, rather than local wind forcing, control the long-term ITF evolution. This finding has profound implications for understanding how regional climate changes translate into basin-scale ocean circulation adjustments.
The strong seasonal variability observed across all ITF components, with peak transports occurring during the Southeast Monsoon period, corroborates the established understanding of monsoonal control 273 on ITF variability (Gordon, 2005). What makes our findings particularly striking is the coefficient of variation exceeding 100% for ITF-G and ITF-S, indicating that interannual variability rivals the mean transport. This extreme variability, consistent with strong ENSO modulation documented by Sprintall et al. (2009), suggests that detecting long-term trends requires careful consideration of natural climate oscillations superimposed on anthropogenic signals.
The use of the Theil-Sen estimator provides robust trend estimates without requiring assumptions about confidence intervals. As a non-parametric method that computes the median of all pairwise slopes, it inherently accounts for data variability and outliers common in oceanographic time series. The Mann-Kendall test complements this by providing rigorous significance testing without parametric assumptions. This approach is particularly appropriate given the non-normal distributions and extreme events evident in several transport time series.
Turning to the Atlantic sector, the highly significant weakening trend of -1.61 Sv/decade in the AMOC represents one of the most robust findings in this study. This decline exceeds the -1.0 Sv/decade reported from the RAPID array for 2004-2023 (McCarthy et al. 2025), though differences may arise from the longer time period and reanalysis methodology used here versus direct observations. Caesar et al. (2018) identified a 15% weakening since the mid-20th century using fingerprint analysis, which translates to approximately 2-3 Sv total decline - a figure consistent with our findings when extrapolated over similar timescales. The relatively low coefficient of variation for AMOC compared to other transport components indicates a more stable baseline state, making the detection of long-term trends particularly robust. This stability, combined with the high statistical significance of the trend, provides compelling evidence for systematic AMOC weakening during the recent warming period.
The identification of four dominant causal pathways from ITF components to Agulhas transport reveals complex, scale-dependent teleconnections operating through the Indian Ocean. The varying lag times - from instantaneous coupling for ITF-T to Agulhas Box, to 18-month lags for ITF-G to Agulhas Box - suggest multiple physical mechanisms at play. While Durgadoo et al. (2017) demonstrated that ITF waters require 10-20 years to reach the Agulhas retroflection region via the classical deep oceanic pathway, our shorter lag times likely reflect faster, upper-ocean pathways or atmospheric teleconnections that modify both systems coherently. The opposite signs of correlation between ITF-G and the two Agulhas metrics reveal an intriguing dynamic: increased ITF transport may enhance the Agulhas Current core velocity while broadening the current, thereby reducing the integrated transport across the fixed Box section. This interpretation aligns with theoretical predictions by Biastoch et al. (2009) who showed that enhanced ITF can modify the Agulhas Current structure through changes in Indian Ocean thermocline depth.
Perhaps most intriguing is the complete absence of statistically significant causal connections between either ITF or Agulhas components and the AMOC at 26ºN. This null result challenges simple conceptual models of a continuous global conveyor belt where enhanced ITF would directly influence Atlantic overturning. Several factors may explain this unexpected finding. The oceanic pathway from the Indian to Atlantic Ocean involves complex transformations, with Biastoch et al. (2008) demonstrating that Agulhas leakage waters undergo substantial modification in the South Atlantic through mixing and air-sea interaction that obscures source water properties. Additionally, Weijer et al. (2019) showed that AMOC variability is dominated by high-latitude processes in the North Atlantic, potentially overwhelming far-field influences from the Indo-Pacific sector. Most importantly, Lozier (2023) demonstrated that the AMOC lacks strong meridional coherence, with correlations between 26ºN and 34.5ºS being particularly weak. This lack of meridional coherence means that even if Agulhas leakage influences South Atlantic overturning, this signal may not propagate to 26ºN where our AMOC measurements are made.
This lack of direct connections does not preclude indirect influences operating through atmospheric tele-connections. Recent work by McGregor et al. (2014) demonstrated that Atlantic warming can influence Pacific climate through atmospheric bridges, suggesting similar processes might operate in reverse. Furthermore, Sun and Thompson (2020) found centennial-scale connections between ITF and AMOC in model simulations, indicating that our 22-year analysis period may be insufficient to detect these longer-timescale relationships. The ocean’s memory at these timescales extends far beyond our observational window, highlighting the 323 critical need for sustained observations and paleoceanographic reconstructions.
The absence of connections also does not preclude influences operating through the South Atlantic. The absence of connections does not preclude influences operating through the South Atlantic. South Atlantic AMOC measurements might reveal stronger connections to Agulhas leakage due to proximity and reduced water mass transformation. Unfortunately, continuous South Atlantic AMOC observations of sufficient length for robust statistical analysis are not yet available, representing an important avenue for future studies as observational networks expand. The development of sustained monitoring systems in the South Atlantic, similar to the RAPID array at 26ºN, would enable direct testing of Agulhas-AMOC connections at latitudes where the influence might be strongest.
The concentration of significant wavelet coherence at periods between 0.87-1.30 years across all ITF-Agulhas pathways reveals a fundamental annual-scale coupling mechanism. This coherence likely reflects the monsoon system’s pervasive influence on both the ITF and Indian Ocean circulation (Schott et al., 2009). The approximately in-phase relationships, with phase angles ranging from merely 1.6 to 10.4 degrees, suggest near-simultaneous responses to common forcing. This timing is more consistent with basin-scale atmospheric forcing than with slow oceanic wave propagation, which would introduce substantial phase lags. The temporal clustering of high coherence during specific periods - 1995-1998, 1999-2004, and 2012-2014 - coincides with major climate events including the 1997-98 El Niño, the early 2000s Indo-Pacific regime shift, and the 2014-16 warming event. This episodic coherence suggests that the strength of ITF-Agulhas coupling varies dramatically with the background climate state, potentially explaining some of the complexity in the causal relationships we observe.
The multi-method causality approach employed here provides robust detection of ocean teleconnections while accounting for both linear and nonlinear relationships. By combining MCC, CCM, and TE, we capture different aspects of dynamical coupling that single methods might miss. The consensus requirement reduces false positive rates inherent in multiple testing, while the application of block bootstrap methods preserves the autocorrelation structure critical for oceanographic time series (Sugihara et al., 2012). However, several limitations warrant consideration. The varying temporal coverage of different datasets introduces potential biases in trend estimates and limits the overlap period for causality analysis. The monthly resolution, while appropriate for detecting seasonal to interannual relationships, may miss higher-frequency coupling mechanisms that could reveal additional dynamical pathways. Additionally, the use of different measurement approaches - geostrophic calculations for ITF, satellite altimetry for Agulhas, and reanalysis for AMOC - introduces methodological uncertainties that complicate inter-basin comparisons.
Our results support a view of the global ocean circulation as a complex, multi-scale system rather than a simple conveyor belt. The simultaneous strengthening of ITF and weakening of AMOC, yet their apparent dynamical decoupling on the timescales analyzed, suggests that regional processes dominate over global-scale connections. Enhanced rainfall and wind forcing in the Maritime Continent drive ITF changes (Hu and Sprintall, 2017), while weakened deep convection in the North Atlantic controls AMOC variability (Thornalley et al., 2018). These regional drivers appear to overwhelm any direct inter-basin coupling, at least on the timescales accessible to current observations.
The robust ITF-Agulhas connections indicate that changes in Pacific-Indian Ocean exchange do propagate into the South Atlantic gateway, potentially preconditioning the Atlantic for longer-term changes. The 12-18 month lag times for some pathways suggest that ITF variations could provide predictability for Agulhas ransport and potentially South Atlantic climate. This predictability, if properly harnessed, could improve seasonal to interannual forecasts for regions influenced by Agulhas leakage, including South Atlantic tropical cyclone development and Benguela upwelling dynamics. As the climate continues to warm and these circulation systems evolve, monitoring these critical ocean gateways becomes increasingly important for understanding and predicting changes in global ocean circulation and regional climate impacts. Future work should focus on extending these time series to detect longer-period variability, investigating atmospheric teleconnections between ocean basins, incorporating South Atlantic observations as they become available, and developing process-based understanding of the mechanisms underlying the statistical relationships identified here.
CONCLUSION
This comprehensive statistical analysis of ocean transport variability reveals fundamental characteristics of the global ocean circulation system and its response to contemporary climate forcing. Through systematic application of non-parametric trend analysis, multi-method causality testing, and wavelet coherence examination, we identified contrasting behaviors across ocean basins: significant strengthening of the ITF, robust weakening of the AMOC, and stable but highly variable Agulhas Current transport. The causality analysis uncovered multiple statistically significant pathways linking ITF components to Agulhas transport variability with lag times of 0-18 months, yet notably absent were any direct connections to the AMOC at 26ºN, challenging traditional paradigms of a tightly coupled global conveyor belt. The dominant annual-scale coherence in ITF-Agulhas coupling, with episodic strengthening during major climate events, indicates that monsoon-driven atmospheric forcing provides the primary teleconnection mechanism rather than slow oceanic advection. These findings support a paradigm wherein regional forcing mechanisms - enhanced Maritime Continent rainfall for ITF and weakened North Atlantic convection for AMOC - dominate over global-scale connectivity on observable timescales.
Future investigations should expand this statistical framework through comprehensive spatio-temporal climate field analysis to identify coherent patterns of variability across ocean basins and elucidate whether the identified connections manifest as propagating subsurface anomalies or atmospheric forcing patterns. Process-oriented modeling experiments with controlled perturbations could distinguish between oceanic and atmospheric teleconnection pathways, while paleoclimate analog studies, particularly of the mid-Pliocene Warm Period and Heinrich events, may reveal precedents for the simultaneous ITF strengthening and AMOC weakening observed in the contemporary ocean. Extended temporal analyses combining proxy reconstructions and long-term numerical model simulations are essential to detect potential centennial-scale inter-basin connections beyond our current observational window. As anthropogenic forcing continues to perturb the climate system, understanding both the regional responses and evolving connectivity of ocean currents becomes increasingly critical for projecting future climate trajectories and informing adaptation strategies, with the framework developed here providing a robust approach for monitoring these changes as they unfold.
DATA AVAILABILITY STATEMENT
The following datasets were utilized in this study:
-
Agulhas Current data: https://beal-agulhas.earth.miami.edu/data-and-products/index.html
-
Atlantic Meridional Overturning Circulation (AMOC) data: https://doi.org/10.48670/moi-00232
-
Indonesian Throughflow (ITF) data: http://doi.org/10.12157/IOCAS.20221214.001
SUPPLEMENTARY MATERIAL
All derived datasets, analytical code, visualization scripts, statistical outputs, and figure generation routines are publicly available in the GitHub repository at https://github.com/sandyherho/amocITFAghulasTimeSeries, released under the WTFPL (Do What The F*ck You Want To Public License).
ACKNOWLEDGMENTS
We thank the anonymous reviewers for their insightful suggestions that improved this manuscript.
REFERENCES
-
Beal, L. M. & Elipot, S. 2016. Broadening not strengthening of the Agulhas Current since the early 1990s. Nature, 540(7634), 570-573. DOI: https://doi.org/10.1038/nature19853
» https://doi.org/10.1038/nature19853 -
Biastoch, A., Böning, C. W. & Lutjeharms, J. R. E. 2008. Agulhas leakage dynamics affects decadal variability in Atlantic overturning circulation. Nature, 456, 489-492. DOI: https://doi.org/10.1038/nature07426
» https://doi.org/10.1038/nature07426 -
Biastoch, A., Böning, C. W., Schwarzkopf, F. U. & Lutjeharms, J. R. E. 2009. Increase in Agulhas leakage due to poleward shift of Southern Hemisphere westerlies. Nature, 462, 495-498. DOI: https://doi.org/10.1038/nature08519
» https://doi.org/10.1038/nature08519 -
Boers, N. 2021. Observation-based early-warning signals for a collapse of the Atlantic Meridional over-turning circulation. Natural Climate Change, 11(8), 680-688. DOI: https://doi.org/10.1038/s41558-021-01097-4
» https://doi.org/10.1038/s41558-021-01097-4 -
Bretherton, C. S., Smith, C. & Wallace, J. M. 1992. An intercomparison of methods for finding coupled patterns in climate data. Journal of Climate, 5(6), 541-560. DOI: https://doi.org/10.1175/1520-0442(1992)509-005<0541:AIOMFF>2.0.CO;2
» https://doi.org/10.1175/1520-0442(1992)509-005<0541:AIOMFF>2.0.CO;2 -
Broecker, W. S. 1987. Unpleasant surprises in the greenhouse?. Nature, 328(6126), 123-126. DOI: https://doi.org/10.1038/328123a0
» https://doi.org/10.1038/328123a0 -
Broecker, W. S. 1991. The great ocean conveyor. Oceanography, 4(2), 79-89. DOI: https://doi.org/10.5670/ oceanog.1991.07
» https://doi.org/10.5670/ oceanog.1991.07 -
Caesar, L., Mccarthy, G. D., Thornalley, D. J. R., Cahill, N. & Rahmstorf, S. 2021. Current Atlantic Meridional overturning circulation weakest in last millennium. Nature Geoscience, 14, 118-120. DOI: https://doi.org/10.1038/s41561-021-00699-z
» https://doi.org/10.1038/s41561-021-00699-z -
Caesar, L., Rahmstorf, S., Robinson, A., Feulner, G. & Saba, V. 2018. Observed fingerprint of a weakening Atlantic Ocean overturning circulation. Nature, 556, 191-196. DOI: https://doi.org/10.1038/s41586-018-0006-5
» https://doi.org/10.1038/s41586-018-0006-5 -
Cheng, L., Trenberth, K., Gruber, N., Abraham, J., Fasullo, J., Li, G., Mann, M., Zhao, X. & Zhu, J. 2020. Improved Estimates of Changes in Upper Ocean Salinity and the Hydrological Cycle. Journal Climate, 33(23), 10357-10381. DOI: https://doi.org/10.1175/JCLI-D-20-0366.1
» https://doi.org/10.1175/JCLI-D-20-0366.1 -
Cheng, L., Zhu, J., Cowley, R., Boyer, T. & Wijffels, S. 2014. Time, Probe Type, and Temperature Variable Bias Corrections to Historical Expendable Bathythermograph Observations. Journal of Atmospheric and Oceanic Technology, 31(8), 1793-1825. DOI: https://doi.org/10.1175/JTECH-D-13-00197.1
» https://doi.org/10.1175/JTECH-D-13-00197.1 -
Ditlevsen, P. & Ditlevsen, S. 2023. Warning of a forthcoming collapse of the Atlantic meridional overturning circulation. Nature Communications, 14(1), 4254. DOI: https://doi.org/10.1038/s41467-023-39810-w
» https://doi.org/10.1038/s41467-023-39810-w -
Duchez, A., Courtois, P., Harris, E., Josey, S. A., Kanzow, T., Marsh, R., Smeed, D. A. & Hirschi, J. J.-M. 2016. Potential for seasonal prediction of Atlantic sea surface temperatures using the RAPID array at 26ºN. Climate Dynamics, 46, 3351-3370. https://doi.org/10.1007/s00382-015-2918-1
» https://doi.org/10.1007/s00382-015-2918-1 -
Durgadoo, J. V., Rühs, S., Biastoch, A. & Böning, C. W. B. 2017. Indian Ocean sources of Agulhas leakage. Journal of Geophysical Research Oceans, 122(4), 3481-3499. DOI: https://doi.org/10.1002/2016JC012676
» https://doi.org/10.1002/2016JC012676 -
Efron, B. & Tibshirani, R. J. 1994. An introduction to the bootstrap, Chapman and Hall/CRC, New York. DOI: https://doi.org/10.1201/9780429246593
» https://doi.org/10.1201/9780429246593 -
E.U. Copernicus Marine Service Information (CMEMS) 2024a. Atlantic meridional overturning circulation AMOC timeseries at 26N from Reanalysis. DOI: https://doi.org/10.48670/moi-00232
» https://doi.org/10.48670/moi-00232 -
E.U. Copernicus Marine Service Information (CMEMS) 2024b. Global ocean ensemble physics reanalysis. DOI: https://doi.org/10.48670/moi-00024
» https://doi.org/10.48670/moi-00024 -
Farge, M. 1992. Wavelet transforms and their applications to turbulence. Annual Review of Fluid Mechanics, 24(1), 395-458. DOI: https://doi.org/10.1146/annurev.fl.24.010192.002143
» https://doi.org/10.1146/annurev.fl.24.010192.002143 -
Feng, M., Zhang, N., Liu, Q. & Wijffels, S. 2018. The Indonesian throughflow, its variability and centennial change. Geoscience Letters, 5, 3. DOI: https://doi.org/10.1186/s40562-018-0102-2
» https://doi.org/10.1186/s40562-018-0102-2 -
Gordon, A. L. 1986. Interocean exchange of thermocline water. Journal of Geophysical Research Oceans, 91(C4), 5037-5046. DOI: https://doi.org/10.1029/JC091iC04p05037
» https://doi.org/10.1029/JC091iC04p05037 -
Gordon, A. L. 2005. Oceanography of the Indonesian Seas and their throughflow. Oceanography, 18(4), 14-27. DOI: https://doi.org/10.5670/oceanog.2005.01
» https://doi.org/10.5670/oceanog.2005.01 -
Gouretski, V. & Cheng, L. 2020. Correction for Systematic Errors in the Global Dataset of Temperature Profiles from Mechanical Bathythermographs. Journal of Atmospheric and Oceanic Technology, 37(5), 841-855. DOI: https://doi.org/10.1175/JTECH-D-19-0205.1
» https://doi.org/10.1175/JTECH-D-19-0205.1 -
Grinsted, A., Moore, J. C. & Jevrejeva, S. 2004. Application of the cross wavelet transform and wavelet coherence to geophysical time series. Nonlinear Processes in Geophysics, 11(5/6), 561-566. DOI: https://doi.org/10.5194/npg-11-561-2004
» https://doi.org/10.5194/npg-11-561-2004 -
Guo, Y., Li, Y., Cheng, L., Chen, G., Liu, Q., Tian, T., Hu, S., Wang, J. & Wang, F. 2023. An updated estimate of the indonesian throughflow geostrophic transport: interannual variability and salinity effect. Geophysical Research Letters, 50(13), e2023GL103748. DOI: https://doi.org/10.1029/2023GL103748
» https://doi.org/10.1029/2023GL103748 -
Hu, S. & Sprintall, J. 2017. Observed strengthening of interbasin exchange via the Indonesian Seas due to rainfall intensification. Geophysical Research Letters, 44(3), 1448-1456. DOI: https://doi.org/10.1002/2016GL072494
» https://doi.org/10.1002/2016GL072494 -
Jackson, L. C. 2024. Quality Information Document: Ocean Monitoring Indicator (OMI) of the Copernicus Marine Environment Monitoring Service - Atlantic Meridional Overturning Circulation. Mercator Ocean International, Toulouse, France. Available from: https://documentation.marine.copernicus.eu/QUID/CMEMS-GLO-OMI-QUID-AMOC.pdf
» https://documentation.marine.copernicus.eu/QUID/CMEMS-GLO-OMI-QUID-AMOC.pdf - Kendall, M. G. 1975. Rank correlation methods. 4 edn. Charles Griffin, London.
-
Lellouche, J.-M., Le Galloudec, O., Drévillon, M., Régnier, C., Greiner, E., Garric, G., Ferry, N., Desportes, C., Testut, C.-E., Bricaud, C., Bourdallé-Badie, R., Tranchant, B., Benkiran, M., Drillet, Y., Daudin, A. & De Nicola, C. 2013. Evaluation of global monitoring and forecasting systems at Mercator Océan. Ocean Science, 9(1), 57-81. DOI: https://doi.org/10.5194/os-9-57-2013
» https://doi.org/10.5194/os-9-57-2013 -
Lenton, T. M., Held, H., Kriegler, E., Hall, J. W., Lucht, W., Rahmstorf, S. & Schellnhuber, H. J. 2008. Tipping elements in the Earth’s climate system. Sustainability Science, U.S.A 105(6), 1786-1793. https://doi.org/10.1073/pnas.0705414105
» https://doi.org/10.1073/pnas.0705414105 -
Lozier, M. S. 2023. Overturning in the subpolar North Atlantic: a review. Philosophical Transactions of the Royal Society, 381(2262), 20220191. DOI: https://doi.org/10.1098/rsta.2022.0191
» https://doi.org/10.1098/rsta.2022.0191 -
Lutjeharms, J. R. E. & Van Ballegooyen, R. C. 1988. The retroflection of the Agulhas Current. Journal of Physical Oceanography, 18(11), 1570-1583. DOI: https://doi.org/10.1175/1520-0485(1988)018<1570:TROTAC>2.0.CO;2
» https://doi.org/10.1175/1520-0485(1988)018<1570:TROTAC>2.0.CO;2 -
Maclachlan, C., Arribas, A., Peterson, K. A., Maidens, A., Fereday, D., Scaife, A. A., Gordon, M., Vellinga, M., Williams, A., Comer, R. E., Camp, J., Xavier, P. & Madec, G. 2015. Global Seasonal forecast system version 5 (GloSea5): a high-resolution seasonal forecast system. Quarterly Journal of the Royal Meteorological Society, 141(689), 1072-1084. DOI: https://doi.org/10.1002/qj.2396
» https://doi.org/10.1002/qj.2396 -
Mann, H. B. 1945. Nonparametric tests against trend. Econometrica, 13(3), 245-259. DOI: https://doi.org/10. 2307/1907187
» https://doi.org/10. 2307/1907187 -
Mccarthy, G. D. et al. 2025. Signal and Noise in the Atlantic Meridional overturning circulation at 26ºN. Geophysical Research Letters, 52, e2025GL115055. DOI: https://doi.org/10.1029/2025GL115055
» https://doi.org/10.1029/2025GL115055 -
Mcgregor, S., Timmermann, A., Stuecker, M. F., England, M. H., Merrifield, M., Jin, F.-F. & Chikamoto, Y. 2014. Recent Walker circulation strengthening and Pacific cooling amplified by Atlantic warming. Nature Climate Change, 4, 888-892. DOI: https://doi.org/10.1038/nclimate2330
» https://doi.org/10.1038/nclimate2330 -
Moat, B., Smeed, D., Rayner, D., Johns, W., Smith, R., Volkov, D., Elipot, S., Petit, T., Kajtar, J., Baringer, M. & Collins, J. 2025. Atlantic meridional overturning circulation ob-served by the RAPID-MOCHA-WBTS (RAPID-Meridional Overturning Circulation and Heatflux Array-Western Boundary Time Series) array at 26N from 2004 to 2023 (v2023.1a). NERC EDS British Oceanographic Data Centre NOC, Liverpool. DOI: https://doi.org/10.5285/33826d6e-801c-b0a7-e063-7086abc0b9db
» https://doi.org/10.5285/33826d6e-801c-b0a7-e063-7086abc0b9db -
Politis, D. N. & Romano, J. P. 1994. The stationary bootstrap. Journal of the American Statistical Association, 89(428), 1303-1313. DOI: https://doi.org/10.1080/01621459.1994.10476870
» https://doi.org/10.1080/01621459.1994.10476870 -
Rahmstorf, S. 1995. Bifurcations of the Atlantic thermohaline circulation in response to changes in the hydrological cycle. Nature, 378(6553), 145-149. DOI: https://doi.org/10.1038/378145a0
» https://doi.org/10.1038/378145a0 -
Runge, J., Nowack, P., Kretschmer, M., Flaxman, S. & Sejdinovic, D. 2019. Detecting and quantifying causal associations in large nonlinear time series datasets. Science Advances, 5(11), eaau4996. DOI: https://doi.org/10.1126/sciadv.aau4996
» https://doi.org/10.1126/sciadv.aau4996 -
Schott, F. A., Xie, S.-P. & Mccreary Jr., J. P. 2009. Indian Ocean circulation and climate variability. Reviews of Geophysics, 47, RG1002. DOI: https://doi.org/10.1029/2007RG000245
» https://doi.org/10.1029/2007RG000245 -
Schreiber, T. 2000. Measuring information transfer. Physical Review Letters, 85(2), 461-464. https://doi.org/10.1103/PhysRevLett.85.461
» https://doi.org/10.1103/PhysRevLett.85.461 -
Sen, P. K. 1968. Estimates of the regression coefficient based on Kendall’s tau. Journal of the American Statistical Association, 63(324), 1379-1389. DOI: https://doi.org/10.1080/01621459.1968.10480934
» https://doi.org/10.1080/01621459.1968.10480934 -
Sprintall, J., Wijffels, S. E., Molcard, R. & Jaya, I. 2009. Direct estimates of the Indonesian Throughflow entering the Indian Ocean: 2004-2006. Journal of Geophysical Research Oceans, 114, C07001. DOI: https://doi.org/10.1029/2008JC005257
» https://doi.org/10.1029/2008JC005257 -
Stommel, H. 1948. The westward intensification of wind-driven ocean currents, Eos. Transactions American Geophysical Union, 29(2), 202-206. DOI: https://doi.org/10.1029/TR029i002p00202
» https://doi.org/10.1029/TR029i002p00202 -
Stommel, H. 1961. Thermohaline convection with two stable regimes of flow. Tellus, 13(2), 224-230. DOI: https://doi.org/10.3402/tellusa.v13i2.9491
» https://doi.org/10.3402/tellusa.v13i2.9491 -
Storto, A., Masina, S. & Navarra, A. 2016. Evaluation of the CMCC eddy-permitting global ocean physical reanalysis system (C-GLORS, 1982-2012) and its assimilation components. Quarterly Journal of the Royal Meteorological Society, 142(695), 738-758. DOI: https://doi.org/10.1002/qj.2673
» https://doi.org/10.1002/qj.2673 -
Sugihara, G., May, R., Ye, H., Hsieh, C. H., Deyle, E., Fogarty, M. & Munch, S. 2012. Detecting causality in complex ecosystems. Science, 338(6106), 496-500. DOI: https://doi.org/10.1126/science.1227079
» https://doi.org/10.1126/science.1227079 -
Sun, S. & Thompson, A. F. 2020. Centennial changes in the Indonesian throughflow connected to the Atlantic Meridional overturning circulation. Geophysical Research Letters, 47, e2020GL090615. DOI: https://doi.org/10.1029/2020GL090615
» https://doi.org/10.1029/2020GL090615 -
Theil, H. 1950. A rank-invariant method of linear and polynomial regression analysis. Proceedings of the Koninklijke Nederlandse Akademie van Wetenschappen 53, 386-392 (Part I), 521-525 (Part II), 1397-1412 (Part III). Available from: Available from: https://mathscinet.ams.org/mathscinet-getitem?mr=0036489 Access date: 2025 Nov. 17.
» https://mathscinet.ams.org/mathscinet-getitem?mr=0036489 -
Thornalley, D. J. R, Oppo, D. W., Ortega, P., Robson, J. I., Brierley, C. M., Davis, R., Hall, I. R., Moffa-Sanchez, P., Rose, N. L., Spooner, P. T., Yashayaev, I. & Keigwin, L. D. 2018. Anomalously weak Labrador Sea convection and Atlantic overturning during the past 150 years. Nature, 556, 227-230. DOI: https://doi.org/10.1038/s41586-018-0007-4
» https://doi.org/10.1038/s41586-018-0007-4 -
Tian, T., Cheng, L., Wang, G., Abraham, J., Wei, W., Ren, S., Zhu, J., Song, J. & Leng, H. 2022. Reconstructing ocean subsurface salinity at high resolution using a machine learning approach. Earth System Science Data, 14(11), 5037-5060. DOI: https://doi.org/10.5194/essd-14-5037-2022
» https://doi.org/10.5194/essd-14-5037-2022 -
Torrence, C. & Compo, G. P. 1998. A practical guide to wavelet analysis. Bulletin of the American Meteorological Society, 79(1), 61-78. DOI: https://doi.org/10.1175/1520-0477(1998)079<0061:APGTWA>2.0.CO;2
» https://doi.org/10.1175/1520-0477(1998)079<0061:APGTWA>2.0.CO;2 -
Torrence, C. & Webster, P. J. 1999. Interdecadal changes in the ENSO-Monsoon system. Journal of Climate, 12(8), 2679-2690. DOI: https://doi.org/10.1175/1520-0442(1999)012<2679:ICITEM>2.0.CO;2
» https://doi.org/10.1175/1520-0442(1999)012<2679:ICITEM>2.0.CO;2 -
Tozer, B., Sandwell, D. T., Smith, W. H. F., Olson, C., Beale, J. R. & Wessel, P. 2019. Global bathymetry and topography at 15 arc sec: Srtm15+. Earth and Space Science, 6(10), 1847-1864. DOI: https://doi.org/10.1029/2019EA000658
» https://doi.org/10.1029/2019EA000658 -
Van Westen, R. M., Kliphuis, M. & Dijkstra, H. A. 2024. Physics-based early warning signal shows that AMOC is on tipping course. Science Advances, 10(6), eadk1189. DOI: https://doi.org/10.1126/sciadv.adk1189
» https://doi.org/10.1126/sciadv.adk1189 -
Weijer, W., Cheng, W., Garuba, O. A., Hu, A. & Nadiga, B. T. 2019. CMIP6 models predict significant 21st century decline of the Atlantic Meridional overturning circulation. Geophysical Research Letters, 46, 12360-12368. DOI: https://doi.org/10.1029/2019GL085075
» https://doi.org/10.1029/2019GL085075 -
Wessel, P., Luis, J. F., Uieda, L., Scharroo, R., Wobbe, F., Smith, W. H. F. & Tian, D. 2019. The generic mapping tools version 6. Geochemistry, Geophysics, Geosystems, 20(11), 5556-5564. DOI: https://doi.org/10. 1029/2019GC008515
» https://doi.org/10. 1029/2019GC008515 - Wyrtki, K. 1961. Physical oceanography of the Southeast Asian waters. Scientific results of marine investigations of the South China Sea and the Gulf of Thailand. NAGA Report, 2, 1-195.
-
Zuo, H., Balmaseda, M. A. & Mogensen, K. 2017. The new eddy-permitting ORAP5 ocean reanalysis: description, evaluation and uncertainties in climate signals. Climate Dynamics, 49, 791-811. DOI: https://doi.org/10.1007/s00382-015-2675-1
» https://doi.org/10.1007/s00382-015-2675-1
-
AI USE DISCLOSURE
During the preparation of this manuscript, the authors used Claude Sonnet 4, a commercial large language model (LLM) developed by Anthropic, to improve the English grammar, syntax, and readability of the text. The AI tool was employed solely for language editing and correction purposes. All scientific content, methodology, analysis, interpretation of results, and intellectual contributions remain entirely the work of the authors. The authors have reviewed and take full responsibility for the accuracy and integrity of the final manuscript content.
-
FUNDING
This work was supported by the Dean’s Distinguished Fellowship from the University of California, Riverside’s College of Natural and Agricultural Sciences (2023) awarded to S.H.S.H., and the Bandung Institute of Technology Research, Community Service and Innovation Program (PPMI-ITB 2025) awarded to I.P.A.
APPENDIX A: STATISTICAL FORMULATIONS
TREND ANALYSIS METHODS
The Theil-Sen estimator calculates the slope (βTS) as:
where xi and xj are transport observations (in Sv) at times ti and tj (in years), and the subscript i<j indicates all pairs where i<j. The intercept (αTS) is:
where xi are the transport values and ti are the corresponding time points.
The Mann-Kendall test statistic S is:
where n is the number of observations and sgn(·) is the sign function defined as:
Under the null hypothesis of no trend, the variance of S is:
The standardized test statistic Z is:
The p-value is calculated as:
where Φ(·) is the cumulative distribution function of the standard normal distribution.
CAUSALITY ANALYSIS METHODS
MAXIMUM CROSS-CORRELATION
For standardized time series x(t) and y(t), the cross-correlation at lag τ is:
where is the standardized series with mean and standard deviation σx, similarly for y’(t), and n is the number of observations. The lag τ is in months, with positive values indicating that x leads y.
The maximum cross-correlation is:
where τmax=24 months in our analysis.
CONVERGENT CROSS MAPPING
The time-delay embedding creates a phase space representation:
where E is the embedding dimension (set to 3 in our analysis) and τ is the delay (1 month).
Predictions are generated through distance-weighted averaging:
where wi=exp(-di)/Σjexp(-dj) are exponential weights based on Euclidean distances di in the embedded space, ti are the time indices of the E+1 nearest neighbors, and My denotes the attractor manifold of y.
The CCM strength is:
where cor[·, ·] denotes the Pearson correlation coefficient.
TRANSFER ENTROPY
The transfer entropy from time series x to y is:
where is the k-length history vector (with k=1 in our analysis), defined, and p(·) denotes probability distributions estimated from the data.
The normalized transfer entropy is:
where H(yt+1)=-Σip(yi)logp(yi) is the Shannon entropy of the target variable.
WAVELET COHERENCE
The continuous wavelet transform of a time series x(t) is:
where s is the scale parameter (related to period), τ is the translation parameter (time), and ψ* is the complex conjugate of the mother wavelet.
The Morlet wavelet is:
where ω0=6 is the central frequency providing optimal time-frequency localization.
The cross-wavelet transform between series x and y is:
The wavelet coherence is:
where angle brackets <·> denote smoothing in both time and scale domains, yielding values between 0 (no coherence) and 1 (perfect coherence).
The phase relationship is:
where ( and ℛ denote imaginary and real parts, respectively. Phase angles near 0º indicate in-phase behavior, while angles near±180º indicate anti-phase relationships.