Conservative behavior of δ13C values of dissolved inorganic carbon in the Cananéia-Iguape estuarine-lagoon complex (southeastern Brazil)
ABSTRACT
The carbon isotope composition of Dissolved Inorganic Carbon (δ13CDIC) is a useful tool to study the carbon budget in estuarine settings. Here we present the first set of δ13CDIC data from the Cananéia-Iguape Estuarine Complex (São Paulo, Brazil), a changing environment undergoing freshening at a rate of the order of 770 m3 s-1. We measured δ13CDIC values of water at 15 stations distributed across the area, both during neap and spring tide, in May 2015 and April 2017. The spatio-temporal variability of δ13CDIC suggests a conservative mixing of two water endmembers, freshwater with δ13CDIC = −10 ‰ (V-PDB) and seawater with δ13CDIC = +2.0 ‰ (V-PDB). Linear regression of δ13CDIC vs. salinity predicts the δ13CDIC values of open ocean surface water from the nearby Santos Basin and suggests that the freshwater and seawater endmembers mix at 1:1 proportion in the estuarine complex. Mixing was the dominant process governing the behavior of δ13CDIC values, whereas photosynthesis, degradation of organic matter, and CO2 uptake or outgassing did not play a significant role. In particular, phytoplankton production had no impact on δ13CDIC, suggesting that the ecosystem was exempt from eutrophication. Long-term freshening in the NE sector of the estuary did not significantly impact the δ13C values of DIC. These results underline the need for long-term measurements of δ13CDIC in the study area to contribute to the understanding of the evolution of the estuarine complex, whose freshening trend could be enhanced by extreme precipitation events linked to climate change.
Keywords:
Carbon isotopes; Water geochemistry; Tidal mixing; Freshwater input
INTRODUCTION
Dissolved inorganic carbon (DIC) is defined as the sum of the concentrations of the dissolved forms of H2CO3 (carbonic acid), CO2(aq) (aqueous carbon dioxide), HCO3 - (bicarbonate ion), and CO3 2- (carbonate ion) (Zeebe and Wolf-Gladrow, 2001). DIC is a key component of the global and oceanic carbon biogeochemical cycle, taking part in fundamental processes, such as the precipitation and dissolution of calcium carbonate, photosynthesis, respiration, and decay of organic matter (e.g., Yakir, 2003).
The carbon isotope composition (13C/12C abundance ratio) of DIC is a well-established tracer of ocean water masses. Primary producers preferentially assimilate 12C during photosynthesis (biological fractionation), leaving the DIC of the surface ocean enriched in 13C. Remineralization of sinking biogenic carbon (depleted in 13C) results in a 13C-depletion of intermediate and deep water DIC (Deuser and Hunt, 1969). This biological fractionation is accompanied by the isotope effect linked to CO2 exchange at the air-sea interface (Lynch-Stieglitz et al., 1995). During CO2 exchange, thermodynamic isotope equilibrium results in a 13C-enrichment of DIC relative to atmospheric CO2. In contrast, the uptake or the outgassing of CO2 at the air-sea interface results respectively in a gain or loss of 12CO2 by surface water DIC (Mook et al., 1974; Inoue and Sugimura, 1985; Ortiz et al., 2000). These processes characterize the carbon isotope composition of DIC in the surface ocean and in deepwater masses formed by cooling and sinking of surface water at high latitudes. As a result, the path of water masses can be traced owing to their distinct carbon isotope composition of DIC (Kroopnick, 1985; Schmittner et al., 2013; Bass et al., 2014; Ge et al., 2022).
In transitional environments, like estuaries, the carbon isotope composition of DIC is a useful tool to study the carbon budget resulting from primary production, degradation of organic matter, and CO2 uptake/outgassing (Alling et al., 2012). In general, the carbon isotope composition of estuarine DIC may co-vary linearly with salinity, thereby reflecting conservative mixing of freshwater and seawater with distinct isotopic composition of DIC. Deviation from this conservative behavior can be attributed to the net carbon isotope budget, which reflects the prevailing process responsible for the enrichment or depletion of 13C (Jones et al., 2001; Bhavya et al., 2018). Importantly, the mass and isotopic balance of DIC gives insights into the tendency of the estuarine environment to serve as source or sink of CO2 to the atmosphere (Alling et al., 2012; Bhavya et al., 2018).
The Cananéia-Iguape estuarine-lagoon complex receives a significant input of freshwater from the Ribeira River, which interplays with the tidal input of seawater from the South Atlantic Ocean. This makes the site a natural laboratory to evaluate the use of carbon isotopes and study the drivers of DIC budget in tropical transitional environments. In this paper, we address the question about what factors govern the carbon isotope composition of DIC in the study area based on a set of isotope data of DIC collected from May 2015 to April 2017. To the best of our knowledge, this is the first report on carbon isotope data of DIC in the Cananéia-Iguape complex. The variability pattern of DIC isotope composition offers the opportunity to observe how freshwater-seawater mixing influences the DIC pool. This can be considered a piece in a broader puzzle that represents the understanding of the carbon budget evolution in the study area, considering that the NE sector of the estuary is undergoing significant freshening, mainly via the Valo Grande artificial waterway, estimated to introduce freshwater at an average flux of ~770 m3 s-1 (Bérgamo, 2000). In a broader perspective, the question arises as to what extent freshening will affect the local DIC pool, and consequently the local carbon budget, in a scenario of climate change leading to more frequent extreme hydrological events.
METHODS
STUDY AREA AND WATER SAMPLING
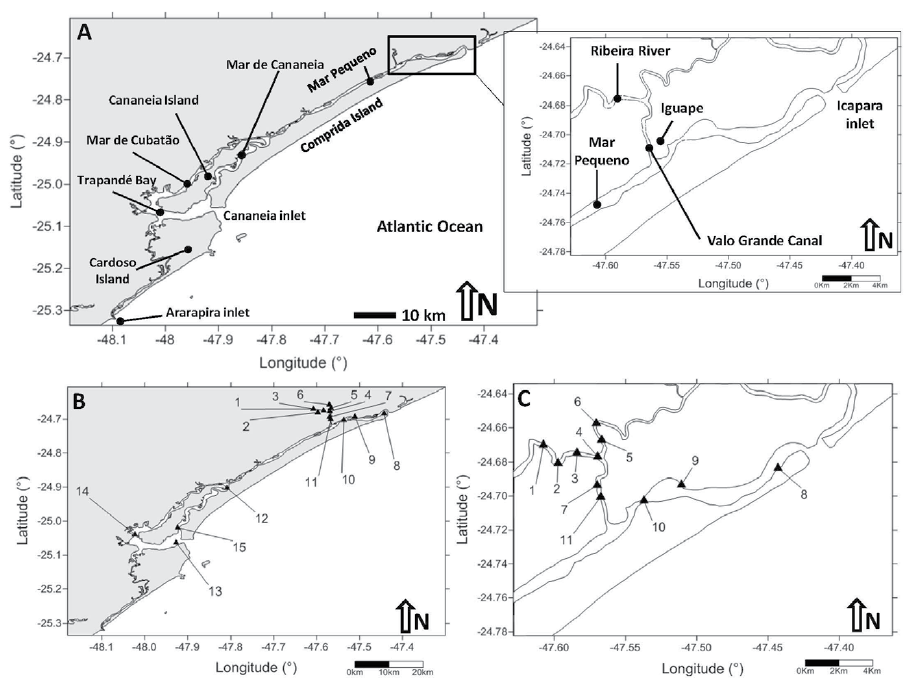
The Cananéia-Iguape estuarine-lagoon complex is located in the State of São Paulo (SE Brazil), between the latitudes 24° 50’S and 25° 40’S and the longitudes 47° 20’W and 48° 20’W (Figure 1). The system is constituted by channels with a prevalent SW-NE trend, the largest of which are named Mar Pequeno and Mar de Cubatão, separated by islands, the most prominent being Ilha do Cardoso, Ilha de Cananeia, and Ilha Comprida (Figure 2).

General map of the study area. Red rectangle indicates location of the Cananéia-Iguape estuarine-lagoon complex. Symbols indicate positions of open ocean stations included in the study. Contour lines are 40, 80, and 200 m isobaths.

(A) map of the Cananéia-Iguape estuarine-lagoon complex. Inset shows the NE sector of the complex, near the city of Iguape. (B) Sampling stations. (C) Detail of stations in the NE sector of the complex, including the Ribeira River (Stations 1-6), the Valo Grande Canal (Stations 7 and 11), and the area near Icapara (Stations 8-10).
Seawater enters through three tidal inlets, called Barra de Ararapira (nearby Ilha do Cardoso), Barra de Cananéia (near the city of Cananéia), and Barra de Icapara (near the city of Iguape) (Figure 2 A). Tide is semidiurnal, with spring and neap tide average heights of 120 cm and 26 cm, respectively (Mesquita and Harari, 1983). Freshwater enters through the Valo Grande Canal, linked to the Ribeira River (Figure 2 A). The Valo Grande Canal is 4 km long, 250 m wide, and 8 m deep, and causes an annual average freshwater discharge of about 770 m3 s-1 into the estuarine-lagoon complex (Bérgamo, 2000). As a result, the sector nearby Iguape is turning into a freshwater environment (Mahiques et al., 2009, 2013, 2014).
To characterize the δ13CDIC variability in the estuarine system, we collected water samples during field trips on board the research boat Albacora, on May 20th-21st 2015, April 26th 2016, and April 25th 2017. In 2015, we collected water at 15 stations (Figure 2 B-C) with different salinities during neap tide. Sampling started from the Ribeira River near the confluence with Valo Grande, continued along the Valo Grande, then at the Icapara tidal inlet, and finally at four stations around the Island of Cananéia. Depending on the local depth, we collected water at 0, 5, 8, and 10 m. In 2016 and 2017, water was collected at 0 and 5 m depth, with the boat anchored at Station 15 (Figure 2 B), during part of a spring tidal cycle from ~8.00 AM to ~5.30 PM. Astronomic tidal excursions for the periods under study were obtained from the Tide Tables available in the website of the Instituto Oceanográfico of the University of São Paulo (IOUSP) (io.usp.br/index.php/tabuas-das-mares.html).
Shoaling made impossible the navigation of the Albacora through the tidal inlets due to severe grounding risk. Thus, in order to characterize the seawater endmember interacting with estuarine water, surface water samples were collected at three open ocean stations (Stations 311, 312, and 313, Figure 1) on December 13th-14th 2016, in the framework of the FAPESP Project no. 2016/03381-3 “Evolution of contourite-drift deposits in the late Quaternary and their interaction with water masses in the Santos Basin, Southwestern Atlantic” during the cruise “CNT,” aboard the R/V Alpha Crucis. Detailed information for sampling stations is reported in Tables 1-3. We also used data from the compilation of Schmittner et al. (2013), specifically from Station 3 of Cruise 49NZ20031106 (November 2013) (Figure 1).
Station number, geographic coordinates, time (day, month, hour), water depth, salinity (S), δ13CDIC values of triplicate samples, and Chl a content of water collected in the Cananeia−Iguape Estuarine Lagoon Complex in 2015. Mean δ13CDIC values and 1-σ Standard Deviation of triplicate δ13CDIC measurements are given.
Time (day, month, year, hour), water depth, salinity (S), δ13CDIC values of triplicate samples, and Chl a content of water collected at Station 15 in the Cananeia-Iguape Estuarine Lagoon Complex in 2016 and 2017. Mean δ13CDIC values and 1-σ Standard Deviation of triplicate δ13CDIC measurements are given.
Water samples were collected using van Dorn (in the Ribeira River) or Niskin bottles (at the other stations). For the determination of salinity, water was transferred into 250 mL hermetic amber glass bottles, overflowing the bottle volume to eliminate air bubbles and prevent evaporation.
For the determination of the carbon isotope composition of DIC (δ13CDIC), each water sample was transferred from the Niskin bottle to a 30 mL plastic syringe without piston, which was previously removed, and with a tip capped with a 20 µm nylon filter (Analítica, Brazil, model 2202225 500C, diameter = 25 mm, non-sterile) to prevent the introduction of microorganisms. The syringe was filled using a flexible plastic tube connected to the tap of the Niskin bottle and capped with a pipet tip. After filling the syringe, the upper water layer was discarded to avoid the presence of water that could have exchanged gas with the atmosphere during the operation. After plugging the piston to the syringe, the water sample was injected (through the 20 µm filter) into an autoclaved 12 mL Exetainer® vial (Labco, UK), filling the whole vial volume to ensure the absence of air bubbles. Once full, the vial was capped with an Exetainer® rubber septum. The absence of air bubbles is essential to avoid CO2 exchange between water and air, which could alter the original 13C/12C ratio in the water sample. For the same reason, the use of both autoclaved Exetainer® vials and 20 µm nylon filters prevented the presence of microorganisms capable of contaminating the samples with metabolic CO2. Water samples were collected in triplicate, using a new filter for each sample. Samples were kept refrigerated (4 °C) in the dark until analysis. The samples from the estuarine complex were analyzed within three weeks, whereas the open ocean samples were analyzed two months after collection.
For the determination of Chlorophyll a, water samples were collected with a Van Dorn bottle, temporarily stored in 2 L polypropylene bottles, kept in the dark under ice, and then filtered with 45 µm Whatman® GF/F glass-fiber filters (previously combusted at 450 °C for 4h 30 min to eliminate organic matter) a few hours after collection.
SALINITY, CARBON ISOTOPES, AND CHLOROPHYLL ANALYSES
Salinity (S, expressed in practical salinity units, psu) was determined from water conductivity following a well-established standard method (Fofonoff and Millard, 1983), using an inductive salinometer Beckman® RS-10 in the Laboratory of Ocean Biogeochemistry of Nutrients, Micronutrients, and Trace Elements (LABNUT) of IOUSP.
The carbon isotope composition of DIC was determined by automated headspace CO2 sampling and gas chromatography-continuous flow isotope ratio mass spectrometry (GC-IRMS) at the Stable Isotope Laboratory (LES) of the Institute of Geosciences of the University of São Paulo (IGC-USP), following the method of (Torres et al., 2005), and developments by (Assayag et al., 2006). In brief, a fixed volume of water sample (1 mL for samples of the 2015 and 2017 field trips, 3 mL for samples of the 2016 field trip, and 0.5 mL for samples collected in the open ocean stations in 2016) was withdrawn from the respective Exetainer® vial and injected in a new Exetainer® vial, previously loaded with 0.3 mL of 100% orthophosphoric acid (H3PO4) and filled with ultrapure helium gas (2.5 bar) using the flushing system of a Thermo-Finnigan (Germany) GasBench II preparation module. Water withdrawal was carried out using two 5 mL syringes with steel needles. One of the syringes was empty, whereas the other one was filled with ultrapure helium gas introduced by piercing the (gas-tight) cap septum of a clean Exetainer® vial, previously flushed with an excess of ultrapure helium at a pressure of 2.5 bar, which instantaneously filled the syringe due to overpressure. The use of two syringes allowed withdrawal of the desired water volume, replacing the sampled water with an equivalent volume of helium (Assayag et al., 2006).
In the Exetainer® vial loaded with orthophosphoric acid, the injected water sample underwent a decrease in pH that converts DIC species to dissolved and gaseous CO2. These two CO2 phases were let equilibrate isotopically during 18 hours at constant temperature (25 °C), after which the headspace CO2 was analyzed using a Thermo-Finnigan Delta V gas-source GC-IRMS, coupled to the GasBench II headspace autosampler including a gas chromatograph column (Chrompac® Column Type 99960).
The carbon isotope composition of DIC was conventionally expressed with the δ13C notation, defined as the difference in parts per mil (‰) between the 13C/12C ratio of the sample and that of the international reference Vienna-Pee Dee Belemnite (V-PDB). Raw δ13C values were corrected using a calibration line based on the analyses of the NBS 19 international standard (δ13C = +1.95 ‰, V-PDB) and three internal laboratory standards (powdered calcite). All standards were prepared adding ~200 µg of calcite standard to an amount of deionized water equal to the volume of water samples analyzed. Standards were intercalated with water samples during analysis. To verify that the δ13C value of the deionized water used for the isotopic standards did not alter their isotope values, we also run samples of deionized water (serving as analytical blanks), prepared exactly as the rest of the water samples. These blanks yielded analytical peaks systematically below detection limit, and thus did not interfere in the measurements.
Water samples, isotopic standards, and blanks were all run in triplicates and under the same conditions during each analytical run. On average (n = 69), the reproducibility of triplicate δ13C analyses was of ±0.08‰ (1σ-standard deviation) (Tables 1-3).
Chlorophyll a (Chl a) was extracted from the Whatman® filters using 90% acetone and was determined spectrophotometrically at LABNUT-IOUSP using a Thermo Scientific® (Germany) Evolution 201 spectrophotometer, following Jeffrey and Humphrey (1975).
RESULTS
SPATIAL AND TEMPORAL VARIATION OF SALINITY
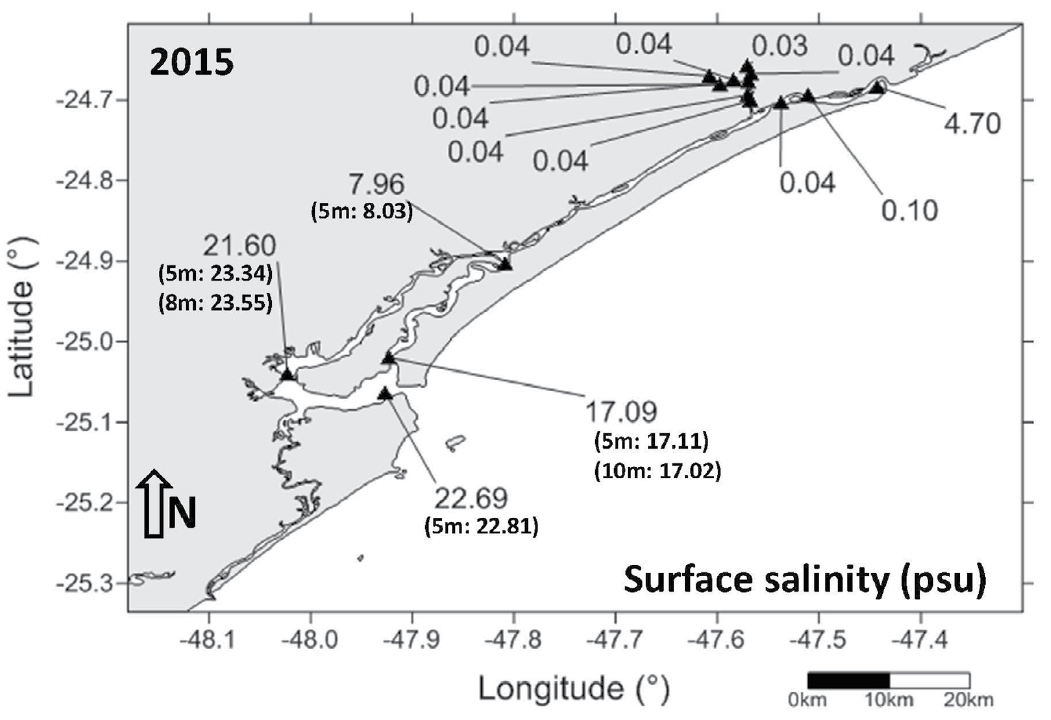
Figure 3 shows surface S at the stations of the 2015 field trip. S increased from the sector near the Ribeira River and Valo Grande (S= 0.03 to 0.04 psu) to values of 0.10 and 4.70 psu nearby the Icapara tidal inlet. S also increased southwestward, reaching values from 17.09 to 22.69 psu in Mar de Cananéia, due to mixing between freshwater form the Valo Grande and seawater from the Cananéia tidal inlet. Figure 3 also shows subsurface and bottom water S (values in parentheses), which are slightly higher than surface S, indicating a partially-mixed to well-mixed estuarine environment with the presence of weak saline wedges both in the Trapandé Bay and in Mar de Cananéia during neap tide.

Surface salinity value measured in the Cananéia-Iguape estuarine-lagoon complex during the 2015 field trip. Subsurface and bottom water salinity values (at 5, 8, or 10 m water depth) are given in parentheses.
Figure 4 shows S variation at 0 and 5 m water depth at Station 15 (fixed station) over the spring tide cycle during the field trips of 2016 (Figure 4 A-B) and 2017 (Figure 4 C-D). Overall, S increased with tide height. In 2016, surface S decreased from 28.34 to 23.86 psu during ebb tide (from 7:00 AM to 12:00 PM) and then increased to 32.39 psu during flood tide (from 12:00 PM to 18:00 PM). Salinity at 5 m followed a similar pattern, decreasing from 32.87 to 25.70 psu from 7:00 AM to 11:00 AM, and approaching surface S during flood tide (Figure 4 A-B). In 2017, surface S remained low during flood tide, decreasing from 21.73 to 19.77 psu from 8:00 AM to 13:10 PM, and increasing rapidly to 33.25 psu at high tide (from 15:00 PM onwards). Over the same time window, S at 5 m increased progressively from 21.11 psu (9:00 AM), converging to the value of surface S during high tide (Figure 4 C-D).

(A) Tidal height and (B) Salinity variation at 0 and 5 m water depth at Station 15 (fixed station) during the 2016 field trip. (C) and (D) show the same parameters for the 2017 field trip.
δ13C VALUES OF DIC AND THEIR RELATIONSHIP WITH SALINITY
We performed scatter plots for δ13CDIC and S to evaluate their relationship via regression analysis. δ13CDIC values always correlated positively with S (Figure 5). The results from the 2015 field trip (Figure 5A) showed lowest δ13CDIC values from −11.9 to −10.0 ‰ in freshwater samples (S = 0.03 to 0.10 psu) from the Ribeira River (Stations 1-6), Valo Grande (Stations 7 and 11), and in the NE sector of the Mar Pequeno to the east of the Valo Grande outlet (Stations 9 and 10) (Table 1). At the Icapara tidal inlet (Station 8), S increasing to 4.70 psu matched a less negative δ13CDIC value of −9.1 ‰. This trend was confirmed in the remaining stations, with δ13CDIC values becoming progressively less negative (from −6.8 to −1.8 ‰) as S increased from 8.03 to 25.81 psu (Table 1). Linear regression of δ13CDIC values against S yields the following relationship (Eqn. 1) (Figure 5 A):
In which R2 is the determination coefficient of the linear regression.

Cross-plots of salinity vs. δ13CDIC, and their respective best-fit lines and linear equations (Eqn. 1-3) obtained during field trips in (A) 2015; (B) 2016; (C) 2017 (notice two outliers not included in the linear correlation). (D) Best-fit linear regression and respective equation (Eqn. 4) obtained including all the data in (A) (black open circles), (B) (red open squares), and (C) (green open triangles), except for the two outliers (green solid triangles in (C)). Dashed line in the upper-right corner of (D) is the prolongation of the solid regression line, drawn to show that the data points of open ocean stations 311 (blue solid square), 312 (black open diamond), 313 (blue solid diamond), and 3 (yellow solid circle) fall on the same regression line as those from Cananéia-Iguape.
The co-variability of S and δ13CDIC was confirmed during the 2016 and 2017 field trips, both conducted at a fixed station (Station 15) (Table 2). In 2016, the observed S excursion from 23.86 to 33.29 psu matched a positive excursion of δ13CDIC values from −2.4 to +0.9 ‰ (Figure 5 B), whereas in 2017, S varied from 19.25 to 33.45 psu and δ13CDIC from −3.9 to +0.6 ‰ (Figure 5 C). The δ13CDIC vs. S linear regressions for 2016 and 2017 (Eqn. 2 and 3) are similar to Eqn. 1, despite the latter including a large number of freshwater samples:
In total, two out of 16 data points from the 2017 data set stood out in the δ13CDIC vs. S linear relationship of Eqn. (3) and were discarded as outliers (not considered in the linear best-fit of Figure 5 C).
Figure 5 D shows the δ13CDIC vs. S relationship obtained using all the data from the three field trips (2015-2017, excluding the two outliers mentioned above). The resulting linear-regression (Eqn. 4) reads as follows:
Interestingly, the prolongation of the regression line of Eqn. (4) for S > 33.5 psu (dashed blue segment in the upper right part of Figure 5 D) falls close to the data points of open ocean stations 311, 312, and 313 (Station 311: depth= 0 m, S = 35.60 psu, δ13CDIC = +1.2 ‰; Station 312: depth= 0 m, S = 37.25 psu, δ13CDIC = +1.0 ‰; Station 313: depth= 0 m, S = 37.00 psu, δ13CDIC = +1.1 ‰), to which we added a data point found in the literature, which is the only near-surface δ13CDIC value available nearby stations 311, 312 and 313. This additional data point corresponds to open ocean water sampled at 9 m at Station 3 of Cruise 49NZ20031106 on November 8th, 2013 (Schmittner et al., 2013) (Station 3: depth= 9 m, S= 36.38 psu, δ13CDIC = +1.5 ‰) (Figure 1 and Table 3). This datum from the literature was retrieved from the data compilation of Schmittner et al. (2013), available at the Web Accessible Visualization and Extraction System (WAVES) of the Carbon Dioxide Information Analysis Center (CDIAC).
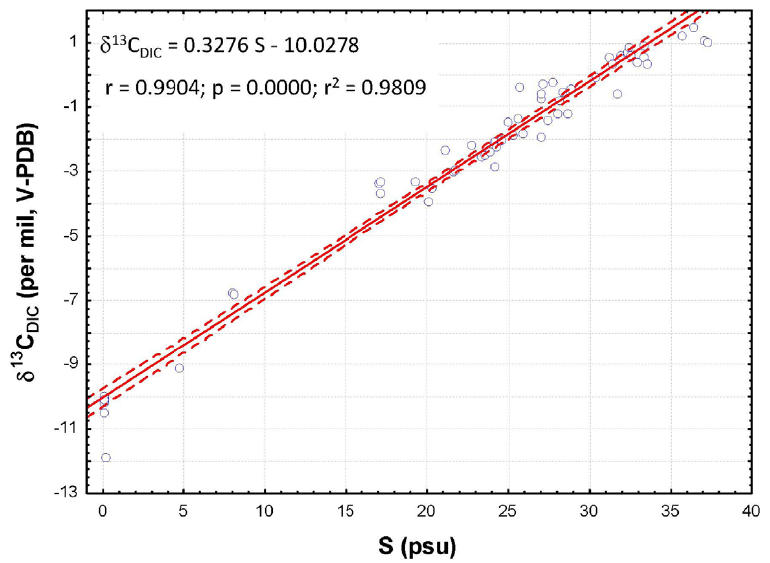
Figure 6 shows a general S vs. δ13CDIC linear regression obtained using all data (including those from the four ocean stations 3, 311, 312, and 313). The significance of this general correlation was assessed performing a regression analysis with the software Statistica®. The linear regression exhibits a relatively narrow 95% confidence interval and p-value = 0, indicating that it is statistically significant. The resulting equation is the following (Eqn. 5):

General linear regression of salinity vs. δ13CDIC based on all data (including those from the four ocean stations 3, 311, 312, and 313). Dashed curves show the 95% confidence interval. Statistical parameters (determination coefficients r and r2, and p-value are indicated). The equation δ13CDIC = 0.3276 S −10.0278 corresponds to Eqn. (5) (see Discussion section), which gives the general δ13CDIC vs. S relationship over the whole salinity range (from pure freshwater to pure seawater). Graph obtained with the software Statistica®.
The Shapiro-Wilk test was run to assess the normality of the distribution of raw residuals (i.e., the difference between measured δ13CDIC values and those resulting from Eqn. 5) using the software Statistica®. The result of the test was W = 0.96896 (W = 1 in a perfectly normal distribution) and p = 0.10 (p >0.05 in a perfectly normal distribution), confirming that raw residuals were normally distributed and corroborating the significance of the general linear relationship between δ13CDIC and S given in Eqn. 5.
CHLOROPHYLL CONTENT AND RELATIONSHIP WITH δ13C VALUES OF DIC
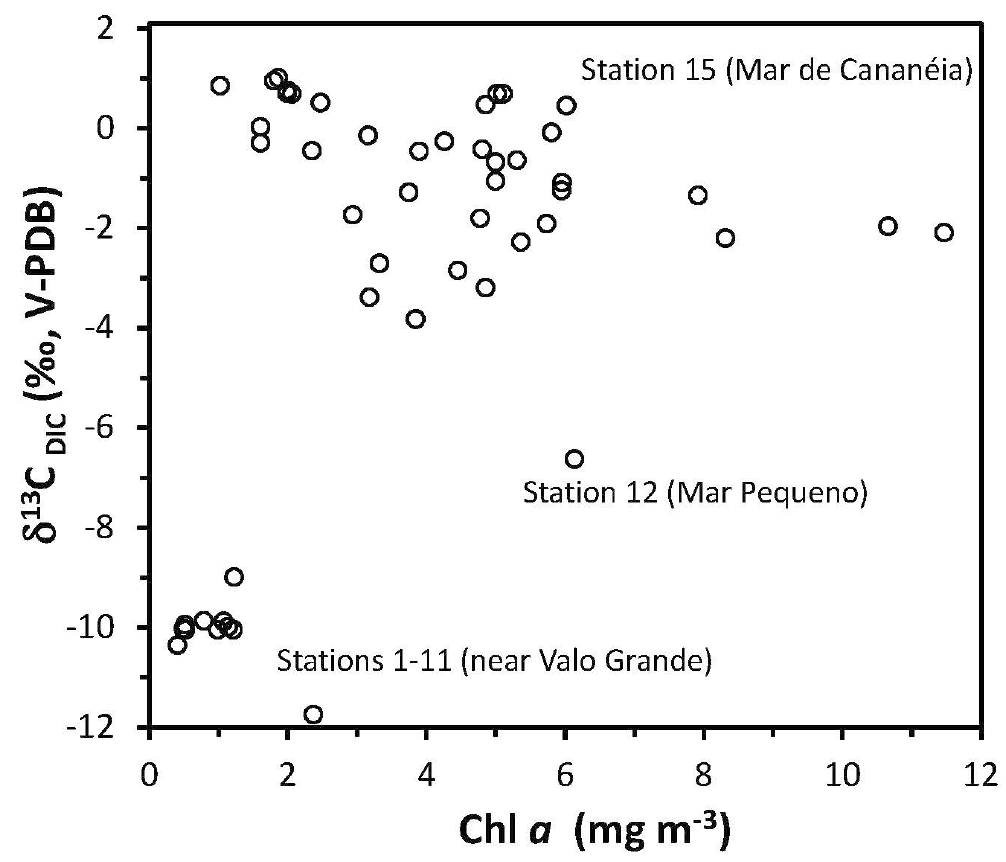
Chl a concentration increased from the low salinity area nearby Valo Grande toward the saltier waters of Mar de Cananéia. At the stations near Valo Grande (Stations 1-11, 2015 field trip) Chl a varied from 0.4 to 2.4 mg m-3, whereas Station 12 (Mar Pequeno) yielded a Chl a content of 6.1 mg m-3 (Table 1). In the Mar de Cananéia (Station 15), Chl a varied from 1.0 to 11.5, and from 3.2 to 8.3 mg m-3 during the 2016 and 2017 field trips, respectively (Table 2). No definite correlation between δ13CDIC and Chl a was observed over the period investigated (Figure 7).

Cross-plot of Chlorophyll a vs. δ13CDIC. Station numbers for each set of data points are given (see Figure 2 for locations).
DISCUSSION
The temporal variation of S over the tidal excursions in the period investigated (Figure 4) reveals the typical behavior of partially-mixed to well-mixed estuaries, in which lower water layers remain saltier than surface water, except during high tide, when the whole water column shows a salinity maximum. In this context, δ13CDIC presents a conservative behavior in the Cananéia-Iguape estuarine-lagoon complex. This is supported by three lines of evidence:
-
δ13CDIC correlates linearly with S;
-
The linear equations of the δ13CDIC vs. S relationship (Eqn. 1-3) show little variation in the period investigated (2015-2017);
-
Equation (4), which was obtained using all the δ13CDIC vs. S data from the Cananéia-Iguape complex, predicts the δ13CDIC vs. S relationship of open ocean surface water in the Santos Basin (distant from the Cananéia-Iguape complex). This enabled us to use all the data available (both from estuarine and from open sea stations) to obtain the general Eqn. (5), which gives the δ13CDIC vs. S relationship over the whole salinity range, from pure freshwater to pure seawater.
The observation of a conservative behavior of δ13CDIC suggests that δ13CDIC values in the Cananéia-Iguape estuarine-lagoon complex resulted from mixing between freshwater and seawater, whereas photosynthesis, degradation of organic matter, and CO2 uptake or outgassing did not play a significant role. The conclusion that photosynthesis and primary productivity did not have a significant bearing on the variability of δ13CDIC is corroborated by the lack of correlation between δ13CDIC and Chl a (Figure 7). The preferential uptake of 12C during photosynthesis would cause a positive correlation between δ13CDIC and Chl a (Jones et al., 2001; Filipsson et al., 2017; Hauksson et al., 2023). This correlation, observed particularly in eutrophic tropical settings, like the Guanabara Bay (Rio de Janeiro), occurs when phytoplankton blooms match increasing δ13CDIC (Cotovicz et al., 2019). In this respect, the carbon isotope behavior of DIC in the Cananéia-Iguape estuary reveals no sign of ecosystem eutrophication.
The linearity of the δ13CDIC vs. S relationship gives qualitative information about the relative contributions of freshwater and seawater DIC when DIC concentration data are not available. In the case of conservative mixing of freshwater and seawater, S can be expressed by the following mass balance equation (Bhvya et al., 2018) (Eqn. 6):
In which fw and sw indicate freshwater and seawater, respectively, Smix is the salinity resulting from the mixing between a pure freshwater endmember and a pure seawater endmember, and Ffw indicates the fraction of the freshwater endmember. Likewise, the concentration of DIC ([DIC]) can be expressed by the following equation (Alling et al., 2012) (Eqn. 7):
From which it follows that the δ13C value of DIC during conservative mixing is (Alling et al., 2012) (Eqn. 8):
Figure 8 shows a cross-plot of δ13CDIC vs. S, with three theoretical curves obtained by plotting δ13Cmix values (Eqn. (8)) against their corresponding values of Smix (Eqn. (6)), with Ffw varying from 0 to 1, Sfw = 0.0, Ssw = 36.56 (i.e., the mean of S values measured at open ocean stations 311, 312, 313, and 3), and δ13Cfw and δ13Csw estimated from Eqn. (5) (using Sfw = 0 and Ssw = 36.56, respectively). Since [DIC]fw and [DIC]sw were not measured, the three theoretical curves were obtained by inserting in Eqn. (8) arbitrary DIC concentrations, pre-setting only the relative proportion of [DIC]sw and [DIC]fw, namely, [DIC]sw = 4 [DIC]fw (dark gray curve), [DIC]sw = [DIC]fw (black line), and [DIC]sw = 0.5 [DIC]fw (light gray curve). The black line obtained considering [DIC]sw = [DIC]fw is the only one that reflects the linear trend of measured δ13CDIC values, from which we can conclude that the freshwater and seawater endmembers mixed at 1:1 proportion in the period investigated.

Cross-plots of salinity vs. δ13CDIC showing three theoretical lines obtained with Eqn. (8), prescribing arbitrarily three relative proportions (1:4; 1:1, and 1:0.5) between seawater DIC concentration [DIC]sw and freshwater DIC concentration [DIC]fw. The two water endmembers were estimated using Eqn. (5), suggesting that the Cananéia-Iguape complex is characterized by a pure freshwater endmember (S = 0) with a δ13CDIC value of the order of −10 ‰, and an ocean water endmember (S ≈ 36.6 psu) with a δ13CDIC value of the order of +2.0 ‰. The black straight line is the one that best reflects the observed S vs. δ13CDIC relationship, predicting that the actual proportion between seawater and freshwater DIC concentrations in the study area is 1:1.
Eqn. (5) provides an estimate of the δ13CDIC values of the two water endmembers characterizing the Cananéia-Iguape estuarine complex, namely a pure freshwater endmember (S = 0) with a δ13CDIC value of the order of −10 ‰, and an ocean water endmember (S ≈ 36.6 psu) with a δ13CDIC value of the order of +2.0 ‰.
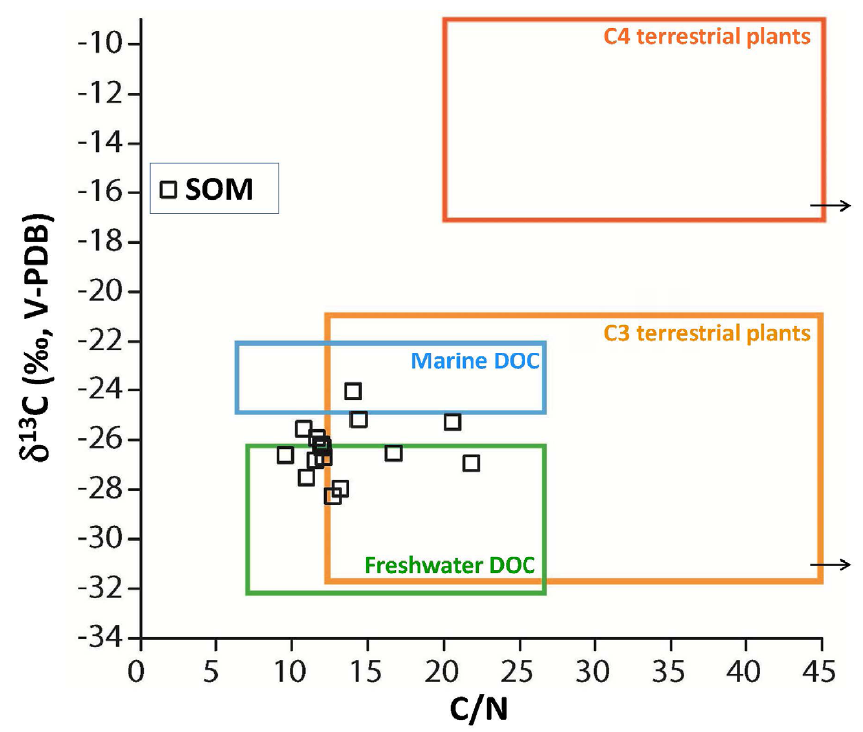
The low δ13CDIC value of the freshwater endmember suggests that the dominant process contributing to DIC formation in the tributaries of the Cananéia-Iguape estuarine system is the degradation of organic matter derived from plants (Cotovicz et al., 2019). This is consistent with previous studies showing that the range of δ13C values (−24 to −28 ‰) and C/N ratios (from 10 to 23) of sedimentary organic matter (SOM) in the study area (Figure 9) reflects the contribution of both marine and terrestrial sources, among which emerges the signature of C3 plants (Millo et al., 2021).

C/N vs. δ13CDIC diagram of sedimentary organic matter (SOM, open squares) in the Cananéia-Iguape estuarine-lagoon complex (modified from Millo et al., 2021). Rectangles indicate the characteristic fields of C3 and C4 terrestrial plants, marine DOC, and freshwater DOC (after Lamb et al., 2006).
The δ13CDIC value of the seawater endmember is in line with global compilation of oceanic δ13CDIC values. For example, the results of the GEOSECS expedition (Kroopnick, 1985) pointed out a typical δ13CDIC value of surface ocean waters of +2.0 ‰. Moreover, the data compilation by Schmittner et al. (2013) gives for the surface of the western South Atlantic a δ13CDIC value ranging from +0.5 and +2.0 ‰, whereas Cotovicz et al., (2019) reported a compilation of global, open ocean δ13CDIC values in the range of −1.13 to +2.31‰.
CONCLUSION
In this study we presented the first set of δ13CDIC data measured in the Cananéia-Iguape estuarine-lagoon complex. The carbon isotope composition of estuarine DIC indicated that the conservative mixing of a freshwater and a seawater endmember, with salinities of 0 and 36.56 psu, respectively, is the major factor governing the variability of δ13CDIC values. The linear regression of δ13CDIC values over the period investigated (2015-2017) yielded an equation suitable to predict δ13CDIC values of offshore surface water in the nearby Santos Basin, in line with measured δ13CDIC values from four open ocean stations. The linear behavior of δ13CDIC suggests that freshwater and seawater DIC mixed at a 1:1 proportion during the period investigated. This, in turn, suggests that freshening of the NE sector of the Cananéia-Iguape complex did not overwhelm the isotopic signature of seawater entering the system from the SW during tidal cycles. Phytoplankton production showed no impact on the variability of δ13CDIC, suggesting that the ecosystem was exempt from eutrophication. The question remains open as to how climate change and the possible intensification of rainfall will affect the processes governing the δ13C value of DIC in the near future. This calls for more long-term measurements of δ13CDIC in the study area to contribute to the understanding of the freshening evolution of this estuarine complex.
ACKNOWLEDGMENTS
This study received funding from the Conselho Nacional de Desenvolvimento Científico e Tecnológico (CNPq Grants 478890/2011-7 and 305288/2009-1 to E.S.B.) and from the Fundação de Amparo à Pesquisa do Estado de São Paulo (FAPESP Grant 2016/03381-3 to S.H.M.S.). We acknowledge the student exchange program of Université La Rochelle (France) for scholarships to A.G. and E.O.. We would like to thank M. Bouyer (former student at Université La Rochelle) for contributing with analysis and data processing, V. Duarte Moreno for the maps of Figure 1, Dr. F.W. Cruz Jr. and A. Barros (IGC-USP) for the isotope analyses, the Captain and the crew of R/V Albacora, and the staff of the IOUSP Ocean Station at Cananéia. We are grateful to Dr. Rubens Lopes (Editor-in-Chief) and to the three anonymous reviewers for their constructive and insightful comments, which significantly improved the quality of the manuscript.
REFERENCES
- Alling, V., Porcelli, D., mörth, C. m., Anderson, L. G., Sanchez-Garcia, L., Gustafsson, Ö., Andersson, P. S. & Humborg, C. 2012. Degradation of terrestrial organic carbon, primary production and out-gassing of CO2 in the Laptev and East Siberian Seas as inferred from δ13C values of DIC. Geochimica et Cosmochimica Acta, 95, 143-159.
- Assayag, N., Rivé, K., Ader, m., Jézéquel, D. & Agrinier, P. 2006. Improved method for isotopic and quantitative analysis of dissolved inorganic carbon in natural water samples. Rapid Communications in mass Spectrometry, 20, 2243-2251.
- Bass, A. m., munksgaard, N. C., O’grady, D., Williams, m. J. m., Bostock, H. C., Rintoul, S. R. & Bird, m. I. 2014. Continuous shipboard measurements of oceanic δ18O, δD and δ13CDIC along a transect from New Zealand to Antarctica using cavity ring-down isotope spectrometry. Journal of marine Systems, 137, 21-27.
- Bérgamo, A. L. 2000. Caraterística da hidrografia, circulação e transporte de sal: Barra de Cananéia, sul do mar de Cananéia e Baia do Trapandé (Tese de mestrado). São Paulo: Universidade de São Paulo.
- Bhavya, P. S., Kumar, S., Gupta, G. V. m., Sudharma, K. V. & Sudheesh, V. 2018. Spatio-temporal variation in δ13CDIC of a tropical eutrophic estuary (Cochin estuary, India) and adjacent Arabian Sea. Continental Shelf Research, 153, 75-85.
- Cotovicz, L. C., Knoppers, B. A., Deirmendjian, L. & Abril, G. 2019. Sources and sinks of dissolved inorganic carbon in an urban tropical coastal bay revealed by δ13C-DIC signals. Estuarine, Coastal and Shelf Science, 220, 185-195.
- De mahiques, m. m., Figueira, R. C., Alves, D. P., Italiani, D. m., martins, C. C. & Dias, J. m. 2014. Coastline changes and sedimentation related with the opening of an artificial channel: the Valo Grande Delta, SE Brazil. Anais da Academia Brasileira Ciências, 86(4), 1597-1607.
- De mahiques, m. m., Figueira, R. C. L., Salaroli, A. B., Alves, D. P. V. & Gonçalves, C. 2013. 150 years of anthropogenic metal input in a Biosphere Reserve: the case study of the Cananéia-Iguape coastal system, Southeastern Brazil. Environmental Earth Sciences, 68, 1073-1087.
- Deuser, W. G. & Hunt, J. m. 1969. Stable isotope ratios of dissolved inorganic carbon in the Atlantic. Deep Sea Research and Oceanographic Abstracts, 16, 221-225.
- Filipsson, H. L., mccorkle, D. C., mackensen, A., Bernhard, J. m., Andersson, L. S., Naustvoll, L.-J., Caballero-Alfonso, A. m., Nordberg, K. & Danielssen, D. S. 2017. Seasonal variability of stable carbon isotopes (δ13CDIC) in the Skagerrak and the Baltic Sea: Distinguishing between mixing and biological productivity. Palaeogeography, Palaeoclimatology, Palaeoecology, 483, 15-30.
- FOFONOFF, P. & MILLARD, R. C. 1983. TR Algorithms for computation of fundamental propetries of seawater. UNESCO Technical Papers in Marine Sciences, 44, pp. 58
- Ge, T., Luo, C., Ren, P., Zhang, H., Fan, D., Chen, H., Chen, Z., Zhang, J. & Wang, X. 2022. Stable carbon isotopes of dissolved inorganic carbon in the Western North Pacific Ocean: Proxy for water mixing and dynamics. Frontiers in marine Science, 9.
-
Hauksson, N. E., Xu, X., Pedron, S., martinez, H. A., Lewis, C. B., Glynn, D. S., Glynn, C., Garcia, N., Flaherty, A., Thomas, K., Griffin, S. & Druffel, E. R. m. 2023. Time series of surface water dissolved inorganic carbon isotopes from the southern California Bight. Radiocarbon, 1-16. https://doi.org/10.1017/RDC.2023.73
» https://doi.org/https://doi.org/10.1017/RDC.2023.73 - Inoue, H. & Sugimura, Y. 1985. Carbon isotopic fractionation during the CO2 exchange process between air and sea water under equilibrium and kinetic conditions. Geochimica et Cosmochimica Acta , 49, 2453-2460.
- Jeffrey, S. W. & Humphrey, G. F. 1975. New spectrophotometric equations for determining chlorophylls a, b, c1 and c2 in higher plants, algae and natural phytoplankton. Biochemie und Physiologie der Pflanzen, 167, 191-194.
- Jones, R. I., Grey, J., Quarmby, C. & Sleep, D. 2001. Sources and fluxes of inorganic carbon in a deep, oligotrophic lake (Loch Ness, Scotland). Global Biogeochemical Cycles, 15, 863-870.
- Kroopnick, P. m. 1985. The distribution of 13C of ΣCO2 in the world oceans. Deep Sea Research Part A. Oceanographic Research Papers, 32, 57-84.
- Lamb, A. L., Wilson, G. P. & Leng, m. J. 2006. A review of coastal palaeoclimate and relative sea-level reconstructions using δ13C and C/N ratios in organic material. Earth-Science Reviews, 75, 29-57.
- Lynch-Stieglitz, J., Stocker, T. F., Broecker, W. S. & Fairbanks, R. G. 1995. The influence of air-sea exchange on the isotopic composition of oceanic carbon: Observations and modeling. Global Biogeochemical Cycles , 9, 653-665.
- Mahiques, m. m. D., Burone, L., Figueira, R. C. L., Lavenére-Wanderley, A. A. D. O., Capellari, B., Rogacheski, C. E., Barroso, C. P., Samaritano Dos Santos, L. A., Cordero, L. m. & Cussioli, m. C. 2009. Anthropogenic influences in a lagoonal environment: a multiproxy approach at the valo grande mouth, Cananéia-Iguape system (SE Brazil). Brazilian Journal of Oceanography, 57, 325-337.
- Mesquita, A. R. & Harari, J. 1983. Tides and Tide gauges of Cananeia and Ubatuba. Relatorio interno do Instituto Oceanográfico da USP, 1, 14.
- Millo, C., Bravo, C., Covelli, S., Pavoni, E., Petranich, E., Contin, m., De Nobili, m., Crosera, m., Otero Sutti, B., Das mercês Silva, C. & De Santis Braga, E. 2021. metal Binding and Sources of Humic Substances in Recent Sediments from the Cananéia-Iguape Estuarine-Lagoon Complex (South-Eastern Brazil). Applied Sciences, 11.
- Mook, W. G., Bommerson, J. C. & Staverman, W. H. 1974. Carbon isotope fractionation between dissolved bicarbonate and gaseous carbon dioxide. Earth and Planetary Science Letters, 22, 169-176.
- Ortiz, J. D., mix, A. C., Wheeler, P. A. & Key, R. m. 2000. Anthropogenic CO2 invasion into the northeast Pacific based on concurrent δ13CDIC and nutrient profiles from the California Current. Global Biogeochemical Cycles , 14, 917-929.
- Schmittner, A., Gruber, N., mix, A. C., Key, R. m., Tagliabue, A. & Westberry, T. K. 2013. Biology and air–sea gas exchange controls on the distribution of carbon isotope ratios (δ13C) in the ocean. Biogeosciences, 10, 5793-5816.
- Torres, m. E., mix, A. C. & Rugh, W. D. 2005. Precise δ13C analysis of dissolved inorganic carbon in natural waters using automated headspace sampling and continuous-flow mass spectrometry. Limnology and Oceanography: methods, 3, 349-360.
- YAKIR, Z. 2003. The Stable Isotopic Composition of Atmospheric CO2 In: HOLLAND, H. D. & TUREKIAN, K. K. (eds.) Treatise in Geochemistry. Amsterdam, Elsevier.
- Zeebe, R. E., Wolf-Gladrow, D. 2001. Chapter 1 Equilibrium. In: Zeebe, R. E. & Wolf-Gladrow, D. (eds.) Elsevier Oceanography Series (pp. 1-84). Amsterdam: Elsevier.