Influence of Microstructure on the Mechanical Properties of Low Carbon UNS S41003 Stainless Steel
Abstract
UNS S41003 stainless steel is a lean stainless steel with 10.5-11% Cr, low carbon (<0.03%C), and small Ni addition. The composition is such that, depending on the processing route, the microstructure can be ferritic, martensitic, or ferritic-martensitic. Specimens acquired from the steelmaker were produced by hot rolling, with and without batch annealing. Two other sets of specimens were created by heat treating at 1000°C followed by water quenching. The microstructures of the four groups of specimens were characterized by scanning electron microscopy (SEM) with electron backscattered scanning diffraction (EBSD). The mechanical properties were measured by tensile tests, hardness, and impact toughness. This study demonstrates the optimal combination of mechanical resistance and toughness in hot rolling samples, which presented a fine grain size of martensite with fine carbides and 23.3% of elongated δ-ferrite. The hot rolled samples show a yield strength 6.2% higher than the quenched samples, and 152.1% higher than the annealed ones. The hot rolled steel presents a higher impact toughness, 31.7 J, 16.1% superior to the annealed material. The quenching heat treatments decreased the %δ ferrite and increased the grain size. The material annealed has a microstructure of equiaxial α-ferrite grains and intergranular chromium carbides.
Keywords:
Mechanical properties; microstructure; stainless steel; EBSD
1. Introduction
The UNS S41003 (UNS - unified numbering system) steel grade is a lean stainless steel (SS) derived from the traditional and popular AISI 410 (AISI - American Iron and Steel Institute) (UNS S41000). The main compositional changes to create the UNS S41003 were the reduction of the Cr (10.5% minimum, wt.%), and the limitation of the interstitials C and N to less than 0.03% each. Ni may be added (up to 1.5%) to increase the austenitic loop and make the steel hardenable by martensitic transformation. On the other hand, if the steel is annealed in the 650 – 800 °C range, the microstructure obtained is ferritic.
Both grades, UNS S41000 and S41003, can present microstructures varying from martensite to ferrite with carbides1. Consequently, the mechanical behavior, wear, and corrosion resistance of these steels can undergo a great variation2.
The UNS S41003 steel is a potential candidate to replace carbon and low alloy steels in services where atmospheric corrosion resistance is needed. Its chemical composition corresponds to the American Society for Testing and Materials (ASTM) A-709 grade 50CR3 (old ASTM A-1010). Russian and Ocel4 proposed the use of this steel in bridges, in place of zinc coated steels and uncoated weathering steels. A complete evaluation of the advantages and disadvantages of ASTM A-709 50CR as structural components for bridges in the United States is presented by Hebdon and Provines5. Besides bridge structures, UNS S41003 (ASTM A-709 50CR) has been selected for railroad cars, electrical transmission towers, and mining equipment6.
Microstructural modifications and chromium carbide precipitation can occur when stainless steel undergoes heat treatment and welding1,7. Li et al1. examined the effect of annealing temperature on the microstructure and corrosion resistance of a ferritic stainless steel X2CrNi12. The samples were annealed at 700 °C, 740 °C, 770 °C, 850 °C, and 950 °C, with a heating rate of 15 °C/min, held at the target temperature for 60 minutes, and then air-cooled. The research showed that the increased formation of the martensitic phase significantly suppressed chromium carbide precipitation, thereby improving corrosion resistance.
Faria et al.2 studied the effect of the volume fraction of martensite and ferrite in UNS S41003 steel and concluded that a greater amount of martensite increased the hardness and tensile and fatigue strength of the steel. However, this gain in mechanical resistance is accompanied by a reduction in ductility and fracture toughness.
Given the growing demand for UNS S41003 as a structural material, it is important to study the processing-microstructure-properties relationships of this steel, as they have not been fully explored in the literature. This work focuses on the correlation of mechanical properties and microstructure of UNS S41003 SS. The tensile, hardness and impact properties of the hot rolled steel and the batch annealed material were compared. Two additional conditions were obtained by quenching the steel from the hot rolled and annealed states. This study provides a comprehensive analysis of processing-microstructure-mechanical properties relationships, particularly focusing on the roles of delta (δ) ferrite, martensite packet size, and geometrically necessary dislocation (GND) density.
2. Experimental
Samples of 3.0 mm thick coils of UNS S41013 steel were purchased in two different processing conditions: (i) as hot rolled (HR) and (ii) as batch annealed (AN). The steelmaker produces the HR material in a Steckel hot rolling mill with low coiling temperature (< 400 °C). The batch annealing is carried out in a reducing atmosphere (H2) with a long duration thermal cycle (∼24h) in temperatures between 800 °C and 650 °C. The chemical compositions of the two samples received are presented in Table 1, and they are very similar and in agreement with the UNS S41003 specification8. Chemical analysis was conducted using elemental analyzer equipment for C, S, and N and by optical emission spectroscopy (OES) for other elements. C and S analyses were performed in a Leco equipment model 744 series. N analysis was made using a Leco equipment model 736 series. And the OES analysis used a Bruker instrument model Q4 POLO.
Chemical composition of HR and AN materials, and comparison to UNS S41003 specification8. Balance in Fe [wt%].
Two additional groups of samples, named AN-Q and HR-Q, were produced by heating at 1000 °C and quenching in water.
Samples from the 4 groups (conditions) were cut and machined into sub-size tensile specimens according to ASTM A-3709 (gauge length Lo = 25 mm), and subsize V-notched Charpy specimens of ASTM E-2310 (2.5 × 10 × 55 mm3). Tensile specimens were made with the longitudinal axis parallel to the rolling direction (RD). For the AN and HR conditions, both longitudinal and transverse Charpy impact specimens were machined, while for the HR-Q and AN-Q conditions, only longitudinal specimens were tested.
The tensile tests were performed in a universal testing system manufactured by INSTRON – EMIC, model 68TM-10, with 10 kN of capacity. The tests used a constant velocity of 0.5 mm/min, and were made in duplicate. The nominal stress (σN) versus nominal strain (εN) were constructed to obtain the strength and ductility parameters of each sample. The true stress (σV) versus true strain (εV) curves were constructed and modelled by Hollomon’s11, Ludwik’s12 and Voce’s13Equations 1, 2 and 3, respectively:
where KH and nH are independent parameters in the Hollomon Equation 1, KL and nL are independent parameters of Ludwik’s model (2), and a, b and c are independent parameters in Voce’s Equation 3. Also, in Equations 2 and 3 σo is the proportional limit, the stress value in which the plastic flow begins. The three models were tested in order to determine the parameters and evaluate the best method for each material according to the R2 correlation coefficient.
Charpy impact tests were carried out in a universal pendulum with a 300 J capacity manufactured by Zwick Roell, model HIT300P. The fracture surfaces were analyzed in a scanning electron microscopy model TM-4000, manufactured by Hitachi.
Vickers hardness tests were carried out with 10 kgf of load in a hardness machine manufactured by Innovatest, model NEXUS 7700G2. The tests were made in accordance with ISO 6507-114.
All mechanical tests were performed at room temperature (22.0 ± 1.0 °C).
The microstructures were characterized by light optical (LOM) (Olympus GX-51 microscope) and scanning electron microscopy (SEM) (Jeol JSM 7100F microscope). For a general view of the microstructure, in line with the literature15-17, the specimens were prepared by grinding, manual polishing, and etching with Villela’s reagent (95 ml ethanol, 5 ml HCl, and 1g of picric acid). Electrolytic etching with 10% NaOH solution was used to reveal the delta ferrite in HR, AN-Q, and HR-Q specimens. NaOH solution is used to characterize duplex stainless steel, and as presented, it performs well in the characterization of delta ferrite in martensitic steels18.
Electron backscattered diffraction (EBSD) was used to obtain the grain size and geometrically necessary dislocation densities19,20. Specimens for EBSD were prepared by grinding, polishing with diamond paste (6 μm, 3 μm and 1 μm) and colloidal silica for 2 h at least. The EBSD images were taken at a scanning step size of 300 nm in a scanning electron microscope, Tescan Amber. The EBSD scans were treated and analyzed with Channel 5 (Oxford Instruments) and ATEX software21. MTEX 5.10.0 software was used to reconstruct the previous austenite grains (PAG).
3. Results and Discussion
Figure 1a-c shows the LOM images of the four specimens, AN, HR, HR-Q, and AN-Q, where the first one (Figure 1a) is quite different from the others as it features ferrite equiaxial grains decorated with Cr carbides, as will be shown in SEM analysis. Specimens HR, HR-Q, and AN-Q present a microstructure with predominance of martensite phase. However, elongated grains, typical of delta ferrite, can be observed in the microstructures, mainly in the HR sample (Figure 1b). The electrolytic attack of NaOH colors the delta ferrite, while the austenite and martensite are not attacked18,19. Thus, the NaOH solution was used to quantify the delta ferrite present in the martensitic matrix in HR, HR-Q, and AN-Q specimens. LOM images of HR, HR-Q, and AN-Q etched in this manner are shown in Figure 2a-c, and the amounts of δ-ferrite quantified with Image J22 were 23.3 ± 0.5%, 6.6 ± 2.7% and 0.9 ± 0.3% respectively. The amount of δ ferrite in the specimen AN-Q was very small, and the high statistical error reflects how heterogeneous was the distribution of δ-ferrite islands in this sample.


Specimens electrolytically etched with 15%NaOH solution (3V, 30s) showing δ ferrite islands: (a) HR; (b) HR-Q; (c) AN-Q. Rolling direction (RD) is indicated.
SEM images of specimens etched with Villela’s reagent are presented in Figure 3a-d. In Figure 3a, the presence of intergranular precipitates is shown in the ferrite matrix. Those precipitates are characterized as chromium carbides in previous work19. In Figure 3b, fine precipitates can be found in the HQ sample. Those fine precipitates were characterized by fine Cr carbides by Khan et al.23. These fine carbides are also observed in the quenched specimens, HR-Q and AN-Q, as shown in Figure 3c, d.

The Ms temperature of the steel samples can be estimated by the empirical Equation 424.
According to (4), the Ms of samples AN and HR are 399 °C and 401 °C, respectively. The presence of fine carbides in the steel after quenching indicates that a self-tempering process has occurred, as is typical from steels with such high Ms temperature.
The measurement of grain size is not an easy task in martensitic stainless steel samples. Only the α-ferrite phase can be measured by LOM images (Figure 1a); the martensitic microstructure needs to be analyzed by EBSD. The inverse pole figure (IPF) was used to determine the grain size of the α-ferrite phase in AN samples, and the size of martensite packets25 in the HR, HR-Q, and AN-Q samples. The MTEX 5.10.026 software was used to determine the previous austenite grains (PAG).
The grain size of α-ferrite phase in the specimen AN can be easily determined from the images of LOM (Figure 1a). However, the grain size of martensitic structures in the specimens HR, HR-Q and AN-Q could not be measured precisely from the LOM images. EBSD analysis was carried out to obtain the martensite packets25 grain sizes of these samples. Figure 4a-d compares the IPFs (inverse pole figure) of specimens AN, HR and HR-Q, which were used to determine the grain sizes with a minimum misorientation angle of 15o. In the IPF, a region is considered a grain boundary if two neighboring areas present a misorientation higher than a specified angle, which is selected in the software (Channel 5). As such, EBSD analysis can detect both high-angle and low-angle grain boundaries depending on the select minimum misorientation threshold27. In this study, EBSD analyses using a misorientation threshold 15° were employed to emphasize the high-angle grain boundaries (HAGBs)28,29.

The grain sizes of samples AN, HR-Q and AN-Q, determined from the IPFs correspond to the martensitic phase, specifically to martensite blocks or packets25. The PAGs is another critical microstructural parameter in quenched and tempered steels. Since martensite forms from austenite (the parent phase), the PAGs are inherently larger than the martensitic packets or blocks.
The quantification of PAG using LOM requires specialized sample preparation, including specific etching techniques to reveal the previous austenite grain boundaries. Alternatively, EBSD data can be employed to reconstruct the PAGs. This reconstruction is performed using an algorithm proposed by Niessen et al.30, implemented through a graph-based method in MTEX 5.10.026.
Figure 5a, b illustrates the reconstructed PAGs of HR-Q and AN-Q. However, the reconstruction was unsuccessful for the HR specimen due to its high amount of δ-ferrite (23.3%).

Table 2 presents the results of grain size quantification and a description of the microstructures of the four specimens. The AN steel exhibits the largest grain size, and in this case, the quantification methods using LOM and EBSD yielded similar results, considering the confidence intervals. Notably, this grain size corresponds to the α-ferrite phase.
The other samples, HR, AN-Q and HR-Q, predominantly display martensitic structures with varying amounts of δ-ferrite. The HR specimen has the smallest martensitic grain size, which corresponds to the size of the martensite blocks or packets. This fine grain size is attributed to the thermomechanical treatment applied during hot rolling.
Specimens of HR and AN, when subjected to quenching from 1000 °C, develop martensitic structures with larger grain sizes compared to the HR specimen. Heating the HR sample to 1000 °C leads to the formation of the austenite phase with an average grain size 17.0 μm and partially dissolves the δ-ferrite. After quenching, the martensite packets/blocks average 5.5μm in size - twice the size observed in the unquenched HR specimen - while the δ-ferrite content decreased from 23.3% to 6.2%.
Compared to HR-Q, the AN-Q specimen has a larger PAGs (24.6μm). This is because the ferritic microstructure of AN has a lower density of crystalline defects for (gamma) γ-phase nucleation compared to the martensite structure of HR. The amount δ-ferrite in AN-Q is significantly lower than in HR-Q, as the batch annealing process reduces δ-ferrite phase. The higher austenite grain size in AN-Q results in a higher average martensite blocks/packets size (6.1μm) in comparison to HR-Q.
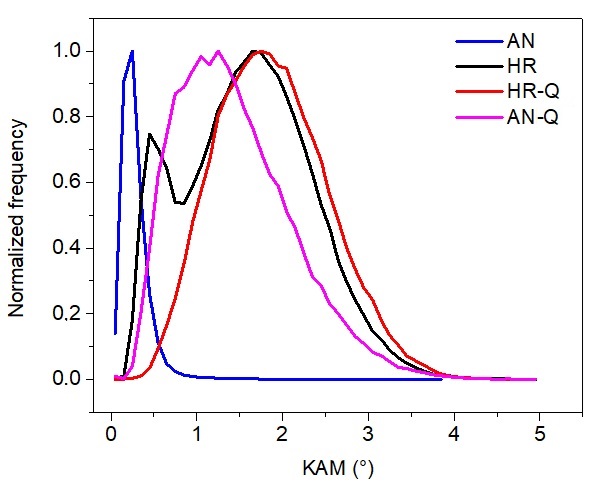
EBSD was employed to generate kernel average misorientation (KAM) maps and calculate geometrically necessary dislocation (GND) densities. Figure 6a-d shows the KAM maps, while Figure 7 presents the corresponding KAM histograms. The AN specimen exhibits the lowest KAM values, attributed to the annealing process that produces recrystallized α-ferrite grains with minimal strain. In Figure 6b and the histogram for the HR specimen, the δ-ferrite islands show much lower KAM values compared to the martensite phase. The KAM histogram of HR sample has two peaks, the first one, with lower values of KAM, around 0.5º, associated with the ferrite phase. And the second peak with higher values, around 2.0º, is associated with martensite phase. However, the peak KAM value in the ferrite phase is higher than that of the AN specimen, as the martensitic transformation induces expansion and microstresses, straining the pre-existent δ-ferrite islands. The KAM maps for the HR-Q and AN-Q specimens reveal similar patterns, although the histogram for HR-Q is shifted toward higher KAM values. In the AN-Q specimen, no KAM peak corresponding to the δ-ferrite phase is observed because the amount of this phase is less than 1%. For HR-Q, the average δ-ferrite content is 6.6%, but in the specific image field analyzed (Figure 6d), only a few δ-ferrite particles are visible (indicated by arrows), resulting in the absence of distinct δ-ferrite peak in the histogram. The average KAM value for HR-Q is higher than that of AN-Q, reflecting the influence of the PAGS, which is smaller in the HR-Q specimen.


According to Gao and Huang31, geometrically necessary dislocations (GND) can be defined as an extra storage of dislocations required to accommodate the lattice straining due to a non-uniform plastic deformation. GND density (ρGND) is calculated with ATEX software, using Equation 532,33.
where θ corresponds to the misorientation angle, u is the step size and b is the Burgers vector modulus.
The GND measurement performed by EBSD, as well as the dislocation density measurement performed by XRD, are important measures to understand the behavior of dislocations in materials34,35. Table 3 and Figures 8 and 9 present the results for the GND density (ρGND). The AN specimen exhibits the lowest ρGND, due to its microstructure formed by recrystallized and stress-relieved α-ferrite grains. The HR specimen exhibits the highest ρGND, 4.7 × 10¹⁴ m-2. This sample is formed by δ-ferrite and martensite grains, the δ-ferrite grains in the HR sample have the same ρGND as the AN sample (Table 3). However, the martensite phase has a ρGND greater than ferrite, 7.5 × 10¹⁴ m-2. The samples after the quenching process show a ρGND between the AN and HR samples. This trend can be attributed to two factors. First, ρGND, is known to increase as the grain decreases36,37, and the HR specimen has the smallest average martensite packet size. Second, the presence of a second phase (δ-ferrite) contributes to an increase in ρGND because dislocations are generated near the interface between the two phases to accommodate the lattice straining34,36.


Figure 10a, b show the engineering curves from the tensile tests and the flow stress curves (true stress vs. true strain). Table 4 summarizes the tensile mechanical properties and hardness results. Tensile tests were performed in duplicate, with specimens labeled “1” and “2” for each condition. The AN specimens exhibited the highest ductility and lowest strength, consistent with their annealed microstructure. In contrast, the AN-Q and HR-Q specimens displayed high and similar strength levels due to the water-quenching heat treatment. The HR specimens demonstrated the highest yield strength (σYS) and ultimate tensile strength (σUTS) while maintaining higher total elongation compared to HR-Q and AN-Q. This is attributed to the smaller grain size and higher GND density of the HR specimens.

(a) Engineering curves (Nominal stress versus nominal strain); (b) True stress versus true strain curves.
Tensile properties and hardness of AN, HR, HR-Q, and AN-Q. (σYS is the yield strength at 0.2%, σUTS is the ultimate tensile strength, and area σxε is the area of the σxε engineering curve, corresponding to a toughness measure).
Table 5 provides the results of modeling using Equations 1 and 2, along with their respective correlation coefficients. The flow curves of AN specimens (annealed), containing α-ferrite grains, were better described by Ludwik’s equation12, with correlation coefficients (R2) close to 1.000. For the HR, HR-Q and AN-Q specimens, modelling with the Hollomon equation11 (σ = kεn) yielded higher correlation coefficients than Ludwik’s equation. Hollomon’s model effectively captured the initial strain-hardening behavior in martensitic specimens, while Ludwik’s equation provided the best fit for the AN condition due to its low GND density and high uniform elongation.
The work-hardening exponents (nH and nL) were higher in the α-ferritic microstructure (AN (1) and AN (2)), which corresponds to greater uniform elongation and lower σYS/σUTS ratio in these specimens.
To improve the fit for flow curves of specimens with martensite and martensite + δ-ferrite structures, Voce’s equation13 was tested. In Voce’s model, the independent parameters are the stiffness coefficient a, the strain hardening coefficient b, and the strain-hardening exponent c. As shown in Table 6, the correlation coefficients obtained using this equation were significantly better for these specimens. However, Ludvik’s equation still provided the best fit for the AN specimens.
Table 7 exhibits the impact toughness results of sub-size specimens. The HR specimens showed higher impact toughness compared to AN, and both results translate to high toughness values when converted to standard-size specimens (10 × 10 × 55 mm3) per ASTM A370. The fracture surfaces of the samples are shown in Figure 11. Both conditions, AN (Figure 11a) and HR (Figure 11b), show a ductile fracture mechanism with the presence of dimples. Longitudinal specimens exhibited higher toughness than transverse specimens, as expected. Prior studies on supermartensitic stainless steel38 suggest that δ-ferrite islands in HR specimens could act as embrittlement factors, particularly in transverse specimens where crack propagation aligns with δ-ferrite islands. This effect is observed in HR specimens and also in transverse AN specimens, even though the latter lacks δ-ferrite.
Impact toughness results with sub-size (2.5 × 10 × 55 mm) specimens (average of 3 tests per condition).

Fracture surface of longitudinal Charpy samples. SEM images: (a) AN; (b) HR; (c) AN-Q and (d) HR-Q.
The higher impact toughness of HR specimens compared to AN is attributed to the extra-low carbon, the refined martensitic microstructure and high GND density, which enhance crack propagation resistance. These factors outweigh the embrittlement effects of δ-ferrite. Interestingly, the AN specimens demonstrated the highest toughness under tensile testing (area under σ × ε curves) but exhibited lower impact toughness compared to HR. It can be concluded that the α-ferrite microstructure of AN specimens is more strain and notch-sensitive, leading to lower impact toughness despite superior ductility.
The quenching treatment applied to HR-Q specimens reduced impact toughness by approximately 10%, along with small reductions in σYS, σUTS and total elongation. In this case, the reduction of δ-ferrite content did not increase impact toughness, but the grain coarsening likely caused the decrease in impact toughness and strength. Lower GND density typically reduces dislocation hindrance, which aligns with the observed decrease in strength. However, the results indicate that reduced ρGND did not enhance the ductility or toughness of the soft martensite in UNS S41003 steel.
When quenching was performed on the AN condition to produce AN-Q specimens, both tensile properties and impact toughness decreased. The impact toughness of this specimen is the lowest among all conditions tested. This result is related to the larger average martensite packets and PAGs. Also, the small content of δ-ferrite in AN-Q compared to HR and HR-Q suggests that the reduction of this phase did not improve the impact toughness in the UNS S41003 steel studied.
Despite the reduction in toughness, both samples after quenching heat treatment remained ductile (Figure 11c and d), with fractography of the fracture surfaces showing the presence of dimples. Future studies must explore the effects of tempering treatments on HR, HR-Q, and AN-Q specimens.
4. Conclusions
The effects of microstructure on the mechanical properties of a lean stainless steel UNS S41003 were investigated. Samples hot rolled (HR), annealed (AN), hot rolled and quenched (HR-Q) and annealed and quenched (AN-Q) were analyzed. The main conclusions are:
-
The best combination of mechanical strength and impact toughness was found in the hot rolled material (HR), whose microstructure is composed of extra low carbon martensite, 23.3% of δ-ferrite islands, and fine chromium carbides. The small size of martensite packets contributes to the excellent mechanical properties achieved. The flow stress curve of this material was best fitted by Voce’s equation.
-
The AN specimens, with a microstructure of α-ferrite equiaxial grains and intergranular chromium carbides, present the highest total and uniform elongation, but the smallest yield and ultimate tensile strengths.
-
The HR-Q and AN-Q specimens had microstructures of martensite (M) and 6.6% and 0.9% of δ-ferrite, respectively. Those materials present mechanical properties slightly inferior to the HR samples.
5. Acknowledgments
Authors acknowledge the Brazilian research agencies Conselho Nacional de Desenvolvimento Científico e Tecnológico (CNPq) (308244/2022-2); and Fundação Carlos Chagas Filho de Amparo à Pesquisa do Estado do Rio de Janeiro (FAPERJ) (E-26/211.412/2021; E-26/200.525/2025; E-26/200.423/2023) for financial support.
6. References
-
1 Li R, Fu B, Dong T, Li G, Li J, Zhao X, et al. Effect of annealing treatment on microstructure, mechanical property and anti-corrosion behavior of X2CrNi12 ferritic stainless steel. J Mater Res Technol. 2022;18:448-60. http://doi.org/10.1016/j.jmrt.2022.02.117
» http://doi.org/10.1016/j.jmrt.2022.02.117 -
2 Faria GL, Godefroid LB, Nunes IP, Lacerda JC. Effect of martensite volume fraction on the mechanical behavior of an UNS S41003 dual-phase stainless steel. Mater Sci Eng A. 2020;797:140208. http://doi.org/10.1016/j.msea.2020.140208
» http://doi.org/10.1016/j.msea.2020.140208 - 3 ASTM: American Society for Testing and Materials. ASTM A709/A709M: standard specification for structural steel for bridges. West Conshohocken: ASTM International; 2021.
-
4 Russian O, Ocel J. Mechanical performance of welds using ASTM A709 grade 50CR steel as base metal. J Construct Steel Res. 2020;170:106121. http://doi.org/10.1016/j.jcsr.2020.106121
» http://doi.org/10.1016/j.jcsr.2020.106121 -
5 Hebdon MH, Provines J. The use of ASTM A1010 (A709 GR50CR) stainless steel for bridges in the United States. J Perform Constr Facil. 2020;34(6):04020108. http://doi.org/10.1061/(ASCE)CF.1943-5509.0001498
» http://doi.org/10.1061/(ASCE)CF.1943-5509.0001498 -
6 Provines JT, Sharp SR, Moruza AK. Documentation and evaluation of ASTM A709 Grade 50CR steel bridges on Virginia’s eastern shore [Internet]. Charlottesville: Virginia Transportation Research Council; 2023 [cited 2025 Jan 30]. Available from: https://vtrc.virginia.gov/media/vtrc/vtrc-pdf/vtrc-pdf/24-R2.pdf
» https://vtrc.virginia.gov/media/vtrc/vtrc-pdf/vtrc-pdf/24-R2.pdf -
7 Lacerda JC, Teixeira RLP, Rocha AG, Silva DFR, Sousa VSR. Effect of metal inert gas arc welding on mechanical properties of a UNS S41003 stainless steel. e-TECH. 2023;16(1):1-18. http://doi.org/10.18624/etech.v16i1.1276
» http://doi.org/10.18624/etech.v16i1.1276 - 8 ASTM: American Society for Testing and Materials. ASTM A240/A240M: standard specification for chromium and chromium-nickel stainless steel plate, sheet, and strip for pressure vessels and for general applications. West Conshohocken: ASTM International; 2023.
-
9 ASTM: American Society for Testing and Materials. ASTM A370: standard test methods and definitions for mechanical testing of steel products. West Conshohocken: ASTM International; 2022. http://doi.org/10.1520/A0370-21
» http://doi.org/10.1520/A0370-21 -
10 ASTM: American Society for Testing and Materials. ASTM E23: standard test methods for notched bar impact testing of metallic materials. West Conshohocken: ASTM International; 2018. http://doi.org/10.1520/E0023-18
» http://doi.org/10.1520/E0023-18 - 11 Hollomon JH. Tensile deformation. TransAIME. 1945;162:268-90.
-
12 Ludwik P. Element der technologischen mechanik. Berlin: Springer; 1909.. http://doi.org/10.1007/978-3-662-40293-1
» http://doi.org/10.1007/978-3-662-40293-1 - 13 Voce E. The relationship between stress and strain for homogeneous deformation. J Inst Met. 1948;74:537-62.
- 14 ABNT: Associação Brasileira de Normas Técnicas. ABNT NBR ISO 6507-1: metallic materials: Vickers hardness test. Part 1: test method. Rio de Janeiro: ABNT; 2008.
-
15 Furtado AB, Sampaio MTG, Pimenta AR, Ponzio EA, Tavares SSM. In situ evaluation of sensitization in the heat affected zone of supermartensitic stainless steel welded with superduplex filler metal. Eng Fail Anal. 2024;166:108894. http://doi.org/10.1016/j.engfailanal.2024.108894
» http://doi.org/10.1016/j.engfailanal.2024.108894 -
16 Pimenta AR, Baptista IP, Breves IMDS, Pardal JM, Tavares SSM. Effects of post-weld heat treatments in microstructure, mechanical properties, and corrosion resistance of simulated heat-affected zone of supermartensitic steel UNS S41426. Int J Adv Manuf Technol. 2024;132(3-4):1915-29. http://doi.org/10.1007/s00170-024-13448-4
» http://doi.org/10.1007/s00170-024-13448-4 -
17 Noris LF, Tavares SSM, Pimenta AR, Ponzio EA, Pardal JM. Microstructure and mechanical properties of a multiphase 17%Cr stainless steel. Mater Res. 2023;26:e20230246. http://doi.org/10.1590/1980-5373-mr-2023-0246
» http://doi.org/10.1590/1980-5373-mr-2023-0246 -
18 Baptista IP, Pimenta AR, Heringer MAV, Perez G, Tavares SSM. Microstructure, mechanical properties and corrosion resistance of supermartensitic steel UNS S41426: comparison between forged and hot rolled seamless pipe. Int J Adv Manuf Technol. 2022;123(7-8):2643-53. http://doi.org/10.1007/s00170-022-10290-4
» http://doi.org/10.1007/s00170-022-10290-4 -
19 Pimenta AR, Loureiro RCP, Breves IMS, Perez G, Tavares SSM. Microstructural characterization of low carbon UNS S41003 stainless steel with different processing routes (hot rolling and annealing). Metallogr. Microstruct. Anal. 2024;13(5):880-90. http://doi.org/10.1007/s13632-024-01092-z
» http://doi.org/10.1007/s13632-024-01092-z -
20 Breves IMS, Pimenta AR, Loureiro RCP, De Lima SKB, Perez G, Tavares SSM. Microstructural characterization of dual-phase low-carbon steel as function of inter-critical annealing. Metallogr Microstruct Anal. 2024;13(5):902-13. http://doi.org/10.1007/s13632-024-01098-7
» http://doi.org/10.1007/s13632-024-01098-7 - 21 Beausir B, Fundenberger JJ. Analysis tools for electron and x-ray diffraction. Metz: Université de Lorraine; 2017.
-
22 Schneider CA, Rasband WS, Eliceiri KW. NIH Image to ImageJ: 25 years of image analysis. Nat Methods. 2012;9(7):671-5. http://doi.org/10.1038/nmeth.2089 PMid:22930834.
» http://doi.org/10.1038/nmeth.2089 -
23 Khan S, Cheng C-Q, Cao T-S, Guan X, Ye-bing H, Qi L, et al. Microstructure and corrosion properties of S400E sorbite stainless steel. Metallogr Microstruct Anal. 2022;11(4):649-60. http://doi.org/10.1007/s13632-022-00863-w
» http://doi.org/10.1007/s13632-022-00863-w - 24 Gooch TG, Woolin P, Haynes AG. Welding metallurgy of low carbon martensitic steels. In: Supermartensitic Stainless Steel; 1999; Ghent, Belgium. Proceedings. Ghent: Belgium Welding Institute; 1999. p. 185-95.
-
25 Zhang C, Wang C, Wang A, Zheng C, Liu Z, Liang J, et al. Effect of aging on transformation behavior of reverted austenite and toughness in Co-free maraging stainless steel. J Mater Eng Perform. 2022;31(12):9850-63. http://doi.org/10.1007/s11665-022-07018-6
» http://doi.org/10.1007/s11665-022-07018-6 -
26 Niessen F, Nyyssönen T, Gazder AA, Hielscher R. Parent grain reconstruction from partially or fully transformed microstructures in MTEX. J Appl Cryst. 2022;55(Pt 1):180-94. http://doi.org/10.1107/S1600576721011560 PMid:35145363.
» http://doi.org/10.1107/S1600576721011560 -
27 Piazolo S, Sursaeva VG, Prior DJ. Optical grain size measurements: what is being measured? Comparative study of optical and EBSD grain sizes determination in 2D al foil. Mater Sci Forum. 2005;495-497:213-8. http://doi.org/10.4028/www.scientific.net/MSF.495-497.213
» http://doi.org/10.4028/www.scientific.net/MSF.495-497.213 -
28 Lopez-Sanchez MA, Tommasi A, Ismail WB, Barou F. Dynamic recrystallization by subgrain rotation in olivine revealed by electron backscatter diffraction. Tectonophysics. 2021;815:228916. http://doi.org/10.1016/j.tecto.2021.228916
» http://doi.org/10.1016/j.tecto.2021.228916 -
29 Masoumi M, Tavares SSM, Pardal JM, Martins TRB, Gomes da Silva MJ, Abreu HFG. The role of microstructure and grain orientations on intergranular cracking susceptibility of UNS 17400 martensitic stainless steel. Eng Fail Anal. 2017;79:198-207. http://doi.org/10.1016/j.engfailanal.2017.04.008
» http://doi.org/10.1016/j.engfailanal.2017.04.008 -
30 Niessen F, Hielscher R, Nyyssönen T, Gazder AA. The variant graph approach to improved parent grain reconstruction. Materialia. 2022;22:101399. http://doi.org/10.1016/j.mtla.2022.101399
» http://doi.org/10.1016/j.mtla.2022.101399 -
31 Gao H, Huang Y. Geometrically necessary dislocation and size-dependent plasticity. Scr Mater. 2003;48(2):113-8. http://doi.org/10.1016/S1359-6462(02)00329-9
» http://doi.org/10.1016/S1359-6462(02)00329-9 -
32 Gao H, Huang Y, Nix WD, Hutchinson JW. Mechanism-based strain gradient plasticity: I. Theory. J Mech Phys Solids. 1999;47(6):1239-63. http://doi.org/10.1016/S0022-5096(98)00103-3
» http://doi.org/10.1016/S0022-5096(98)00103-3 -
33 Kubin LP, Mortensen A. Geometrically necessary dislocations and strain-gradient plasticity: a few critical issues. Scr Mater. 2003;48(2):119-25. http://doi.org/10.1016/S1359-6462(02)00335-4
» http://doi.org/10.1016/S1359-6462(02)00335-4 -
34 Sun Y-H, Chen S-W, Lai Z-H, Lu S-L, Lin Y-T, Tu J-F, et al. Strain-hardening resilience via the cooperation of geometrically necessary dislocations and deformation twins in a strong and ductile lightweight high-entropy steel. Mater Des. 2024;244:113212. http://doi.org/10.1016/j.matdes.2024.113212
» http://doi.org/10.1016/j.matdes.2024.113212 -
35 Gonzaga AC, Tavares SSM, Cardoso ASM, Dille J, Malet L, Pimenta AR. Dislocation density measurements from x-ray diffraction of austenite and ferrite phases in superduplex UNS S39274. J Mater Eng Perform. 2024;1:1. http://doi.org/10.1007/s11665-024-10051-2
» http://doi.org/10.1007/s11665-024-10051-2 -
36 Ashby MF. The deformation of plastically non-homogeneous materials. Philos Mag. 1970;21(170):399-424. http://doi.org/10.1080/14786437008238426
» http://doi.org/10.1080/14786437008238426 -
37 Song E, Andani MT, Misra A. Quantification of grain boundary effects on the geometrically necessary dislocation density evolution and strain hardening of polycrystalline Mg-4Al using in situ tensile testing in scanning electron microscope and HR-EBSD. Journal of Magnesium and Alloys. 2024;12(5):1815-29. http://doi.org/10.1016/j.jma.2024.05.021
» http://doi.org/10.1016/j.jma.2024.05.021 -
38 Carrouge D, Bhadeshia HKDH, Woollin P. Effect of δ-ferrite on impact properties of supermartensitic stainless steel heat affected zones. Sci Technol Weld Join. 2004;9(5):377-89. http://doi.org/10.1179/136217104225021823
» http://doi.org/10.1179/136217104225021823