Pequi-Derived Carbon Dots as a Fluorescence Quenching Sensor for Sensitive Detection of Fe3+ Ions
Abstract
This study presents the pequi (Caryocar coriaceum) as a new biomass source for carbon dots synthesis. The pequi almond, usually discarded, was used as the biomass precursor in one-step hydrothermal green synthesis of carbon dots. Pequi-based carbon dots (PQ-CDs) exhibited an estimated height of around 8 nm, with hydroxyl, carbonyl, and amino functional groups confirmed by FTIR, bright blue emission, and a quantum yield of 17.9%. PQ-CDs were employed as fluorescent sensors for Fe3+ ions, based on the quenching of PQ-CDs fluorescence by interaction with Fe3+ ions. The sensor demonstrated a linear relationship between the quenching of PQ-CDs fluorescence and the increase in Fe3+ ion concentration, with a LOD of 1.16 μmol L-1, well below the maximum Fe3+ concentration for drinking water established by the WHO. PQ-CDs are a cost-effective and highly sensitive alternative for Fe3+ ions detection in drinking water samples from the Cariri region.
Keywords:
Carbon dots; pequi almond; fluorescence quenching; iron ion detection
1. Introduction
Fe3+ ions play a crucial role in several biochemical mechanisms, such as cellular respiration and mitochondrial electron transfer1. Additionally, Fe3+ ion is ubiquitously distributed in living organisms and serves as an essential trace element to support fundamental life processes2. While iron itself is not toxic, an imbalance of Fe3+ in the body can lead to issues such as anemia, heart disease, and cancer, thereby endangering normal human life activities3.
On the other hand, the content of Fe3+ is also an important factor affecting water quality. Heavy metal pollution is a common type of pollution in water environments, which poses significant hazards due to its bioaccumulation, toxicity, and non-degradability4. Brazilian legislation defines the iron concentration in potable water, set at 0.3 mg L-1 by Ordinance 888/21, due to its impact on water's organoleptic properties. The World Health Organization recommends a stricter limit of 0.2 mg L-1.
However, in some water supply points in the Cariri region of Ceará, the levels are higher than established ones5. In addition to posing health risks, elevated Fe3+ ion concentration in drinking water can result in complications such as the deposition of iron within pipes, as well as increased microbiological contamination by iron-bacteria6,7. It is therefore becoming increasingly important to develop sensitive Fe3+ ion detection systems.
In this context, carbon dots (CDs) have been gaining increasing prominence due to their potential application as fluorimetric ion sensors8,9. Compared to traditional systems for detecting Fe3+ ions, such as mass spectrometry, atomic adsorption spectroscopy (AAS), atomic fluorescence spectrometry (AFS)10,11, CDs have the advantages of being low cost, easy to obtain and instrumental, as well as sensitivity, selectivity, and fast responding when compared to the aforementioned methods.
CDs are zero-dimensional nanomaterials that stand out for fluorescence. In addition, their biocompatibility, high water solubility and emission stability make them suitable for extensive applications as a fluorimetric ion sensor12,13. The use of natural sources as precursor material in the synthesis of CDs stands out due to its low cost and high availability of materials, and because of the varied constitution of biomass sources, the optical properties of CDs can be improved9,14,15.
In this context, pequi, with its high fatty acid and methyl esters content, is an effective biomass source for CDs synthesis. Pequi (Caryocar coriaceum) is an oleaginous fruit native and adapted to the Brazilian Northeast16. Data from the Vegetable Extraction and Forestry production report points out that in 2023, 3,073 tons of pequi were harvested in Ceará, with 3,058 tons produced in the Cariri region17. However, fruit parts such as peels and almond are discarded in the harvest or commerce places18. This discarded material could be a carbon source for carbon dots production.
In this study, we present a novel utilization of pequi almonds, which is often discarded because it has no commercial value, as a biomass precursor for the synthesis of CDs. The pequi-based CDs (PQ-CDs) were obtained by hydrothermal reaction, without the addition of doping agents, in a one-step process that does not require additional purification steps. The structural characterization of PQ-CDs revealed a predominant composition of carbon, oxygen, and nitrogen in amino, hydroxyl, and carboxyl functional groups. The PQ-CDs exhibited bright blue fluorescence with a high quantum yield of 17.9% and the ability to detect iron ions. The sensor demonstrated sensitivity with an LOD of 1.16 μmol L-1, which is well below the maximum Fe3+ ion concentration limit in drinking water.
2. Experimental Procedure
2.1. Materials
We obtained pequi (Caryocar coriaceum) (SisGen Code: AFAEC4D) on the street market of Brejo Santo, Ceará, Brazil (latitude 7° 29' 13'' S, Longitude: 38° 58' 47'' O). We purchase iron (III) chloride (FeCl3·6H2O, 98%) from Vetec. We used distilled water (0.087 MΩ cm) during the experiments. We used a cellulose membrane Spectra/Por®6 dialysis membrane of 1 kDa MWCO for dialysis.
2.2. Synthesis of pequi-based CDs
We conducted the synthesis according to the conventional hydrothermal method. Briefly, 1 g of almond was macerated and diluted in 10 mL of distilled water. The suspension was transferred to a 50 mL Teflon-lined autoclave. The hydrothermal reaction was conducted for two hours at 230 ºC. The product was dialyzed in two cycles of 12 hours. The CDs suspensions were stored in a refrigerator at temperatures between 6 and 10 °C.
2.3. Structural and optical characterization
We performed X-ray photoelectron spectroscopy (XPS) using a Thermo Fisher Scientific model K-alpha+, employing monochrome radiation of Al Kα, with a pass energy of respectively 200 and 50 eV for survey and high-resolution scanning spectra. The spot size was 400 μm. The chamber pressure was approximately 10-7 Pa. Peak fitting was done using the Avantage software provided by the equipment manufacturer, with mixed Gaussian and Lorentzian curves and background subtraction using a smart algorithm.
We obtained atomic force microscopy (AFM) images using an Asylum MFP 3D. Topography and phase contact contrast of the pequi-based CDs were performed with an NCHR-50 silicon noncontact tip (Nano World), (less than 8 nm of radius tip, 42 N m−1 of force constant, 320 kHz of resonance frequency), operating with a scan rate of 0.20 Hz.
The functional groups of PQ-CDs were analyzed by Fourier transform infrared spectroscopy (FT-IR) with KBr pellets in a Shimadzu Spectrometer. The spectra were recorded using a range of 400 – 4000 cm-1, with resolution of 4 cm-1. The PQ-CDS absorption and fluorescence spectra were obtained in a Shimadzu UV-2600 and a Shimadzu RF-6000 spectrophotometer, respectively.
2.4. Quantum Yield (QY) determination
We measured the PQ-CDs quantum yield (QY) using quinine sulfate (in 0.1 mol L-1 H2SO4 as a solvent, QY = 54.0%) as a reference. In the quantum yield measurements, the absorbance of samples was kept below 0.05 to avoid inner filter effects19. The QY was determined using Equation 1:
where I is the integrated emission intensity; A is the absorbance measured at 310 nm; and n is the refractive index. The subscript ref is related to the quinine sulfate (QY = 54.0%, 0.1 mol L-1 H2SO4).
2.5. Fluorescence detection of Fe3+ ions
The Fe3+ sensing assay was based on the fluorescence quenching of PQ-CDs. Firstly, the PQ-CDs fluorescence intensity (I0) was measured at room temperature. In a typical experiment, 0.5 mL of 54.1 μg mL-1 solution of PQ-CDs was diluted to 2.0 mL, and we measured fluorescence spectra. In a typical experiment for the iron assay, 0.5 mL PQ-CDs solution was mixed with 0.1 μL of Fe3+ stock solution. The cuvette’s volume was adjusted to 2.0 mL, and we recorded the fluorescence spectra (I).
We investigated the limit of detection (LOD) by examining the slope (k) of a linear relationship plot of fluorescence quenching intensity and iron ion concentrations. The standard deviation (σ) was determined by the fluorescence intensity of the PQ-CDs solution. The detection limit was calculated using the following Equation 2:
3. Results and Discussion
3.1. Pequi-based carbon dots’ optical and structural characterization
PQ-CDs synthesized via the one-step hydrothermal route showed a characteristic bright blue emission when subjected to UV radiation. The UV-VIS spectrum (black line in Figure 1) displays two absorption bands, the first one in the 275 nm region, corresponding to π-π* transitions in the carbon core. The second absorption at 325 nm is related to n-π* transitions of C=O or C=N bonds in functional groups20-22. We observed the emission maximum at 390 nm when the PQ-CDs was excited at 310 nm (blue line in Figure 1). With emission values above 39,000 a.u., the suspension showed intense blue emission when subjected to UV radiation (Inset Figure 1).

The PQ-CDs emission spectra show that after the emission band (310 nm excitation), the emission decays in every excitation wavelength (Figure S1, Supplementary material). Moreover, it is possible to observe the emission band shift as a function of excitation wavelength increase (Inset Figure S1). Excitation-dependent behavior is standard in carbon dots15,23; it can be attributed to different sizes of nanoparticles or surface energy traps24. PQ-CDs quantum yield (QY) was 17.9% (Table S1), considerably higher than other biomass-derived CDs25-27.
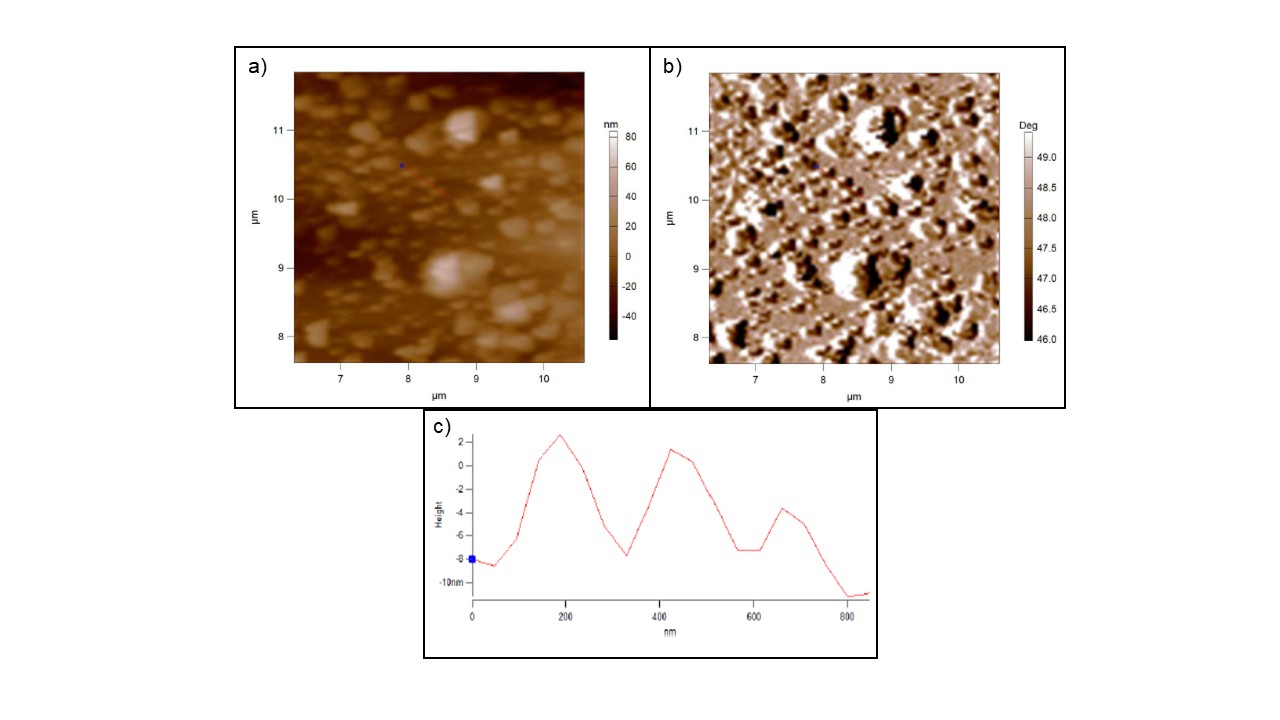
PQ-CDs atomic force microscopy showed the formation of nanoparticles with a quasi-spherical structure (Figure 2a). However, the formation of aggregates and the roughness of the nanomaterial were higher than expected (Figure 2b). A high concentration of PQ-CDs may have caused the nanoparticles’ self-aggregation. Regarding the size of the nanoparticles, despite the formation of aggregates, the observed height profile of PQ-CDs is around 8 nm (Figure 2c), compatible with other CDs based on natural sources28,29.

PQ-CDs atomic force microscopy. (a) topography (b) roughness and (c) particle sizes profile.
The PQ-CDs XPS spectrum showed three characteristic peaks at 284.38, 399.02 and 531.15 eV, which correspond to C1s, N1s and O1s, respectively (Figure 3a). The full-scan XPS spectrum showed that the PQ-CDs produced are mainly composed of carbon (63.35%), oxygen (24.62%) and nitrogen (8.56%). PQ-CDs constitution is consistent with other reports of CDs based on natural products9,27,30.

Full XPS scan (a), and high-resolution XPS spectra of C1s (b), N1s (c) and O1s (d) of PQ-CDs.
Additional high-resolution XPS spectra of C1s (Figure 3b) illustrate the presence of five main peaks at 283.29 eV, 284.05 eV, 284.99 eV, 286.14 eV and 287.32 eV that correspond to C-C/C=C/C-H, C-N, C-O, C-O-C and C=O/O-C=O, respectively31,32 (Table S2). Similarly, the high-resolution spectrum of N1s (Figure 3c), which can be divided into three peaks located at 398.6 eV, 399.27 eV and 399.98 eV, related to nitrogen C-N, C=N and N-H, respectively33. The O1s spectra (Figure 3d) show four components at 530.42 eV, 531.27 eV, 532.23 eV and 533.44 eV and can be attributed to HO-C=O/O=C-N, C-OH/ C-O-C, C=O and H-O-H34,35.
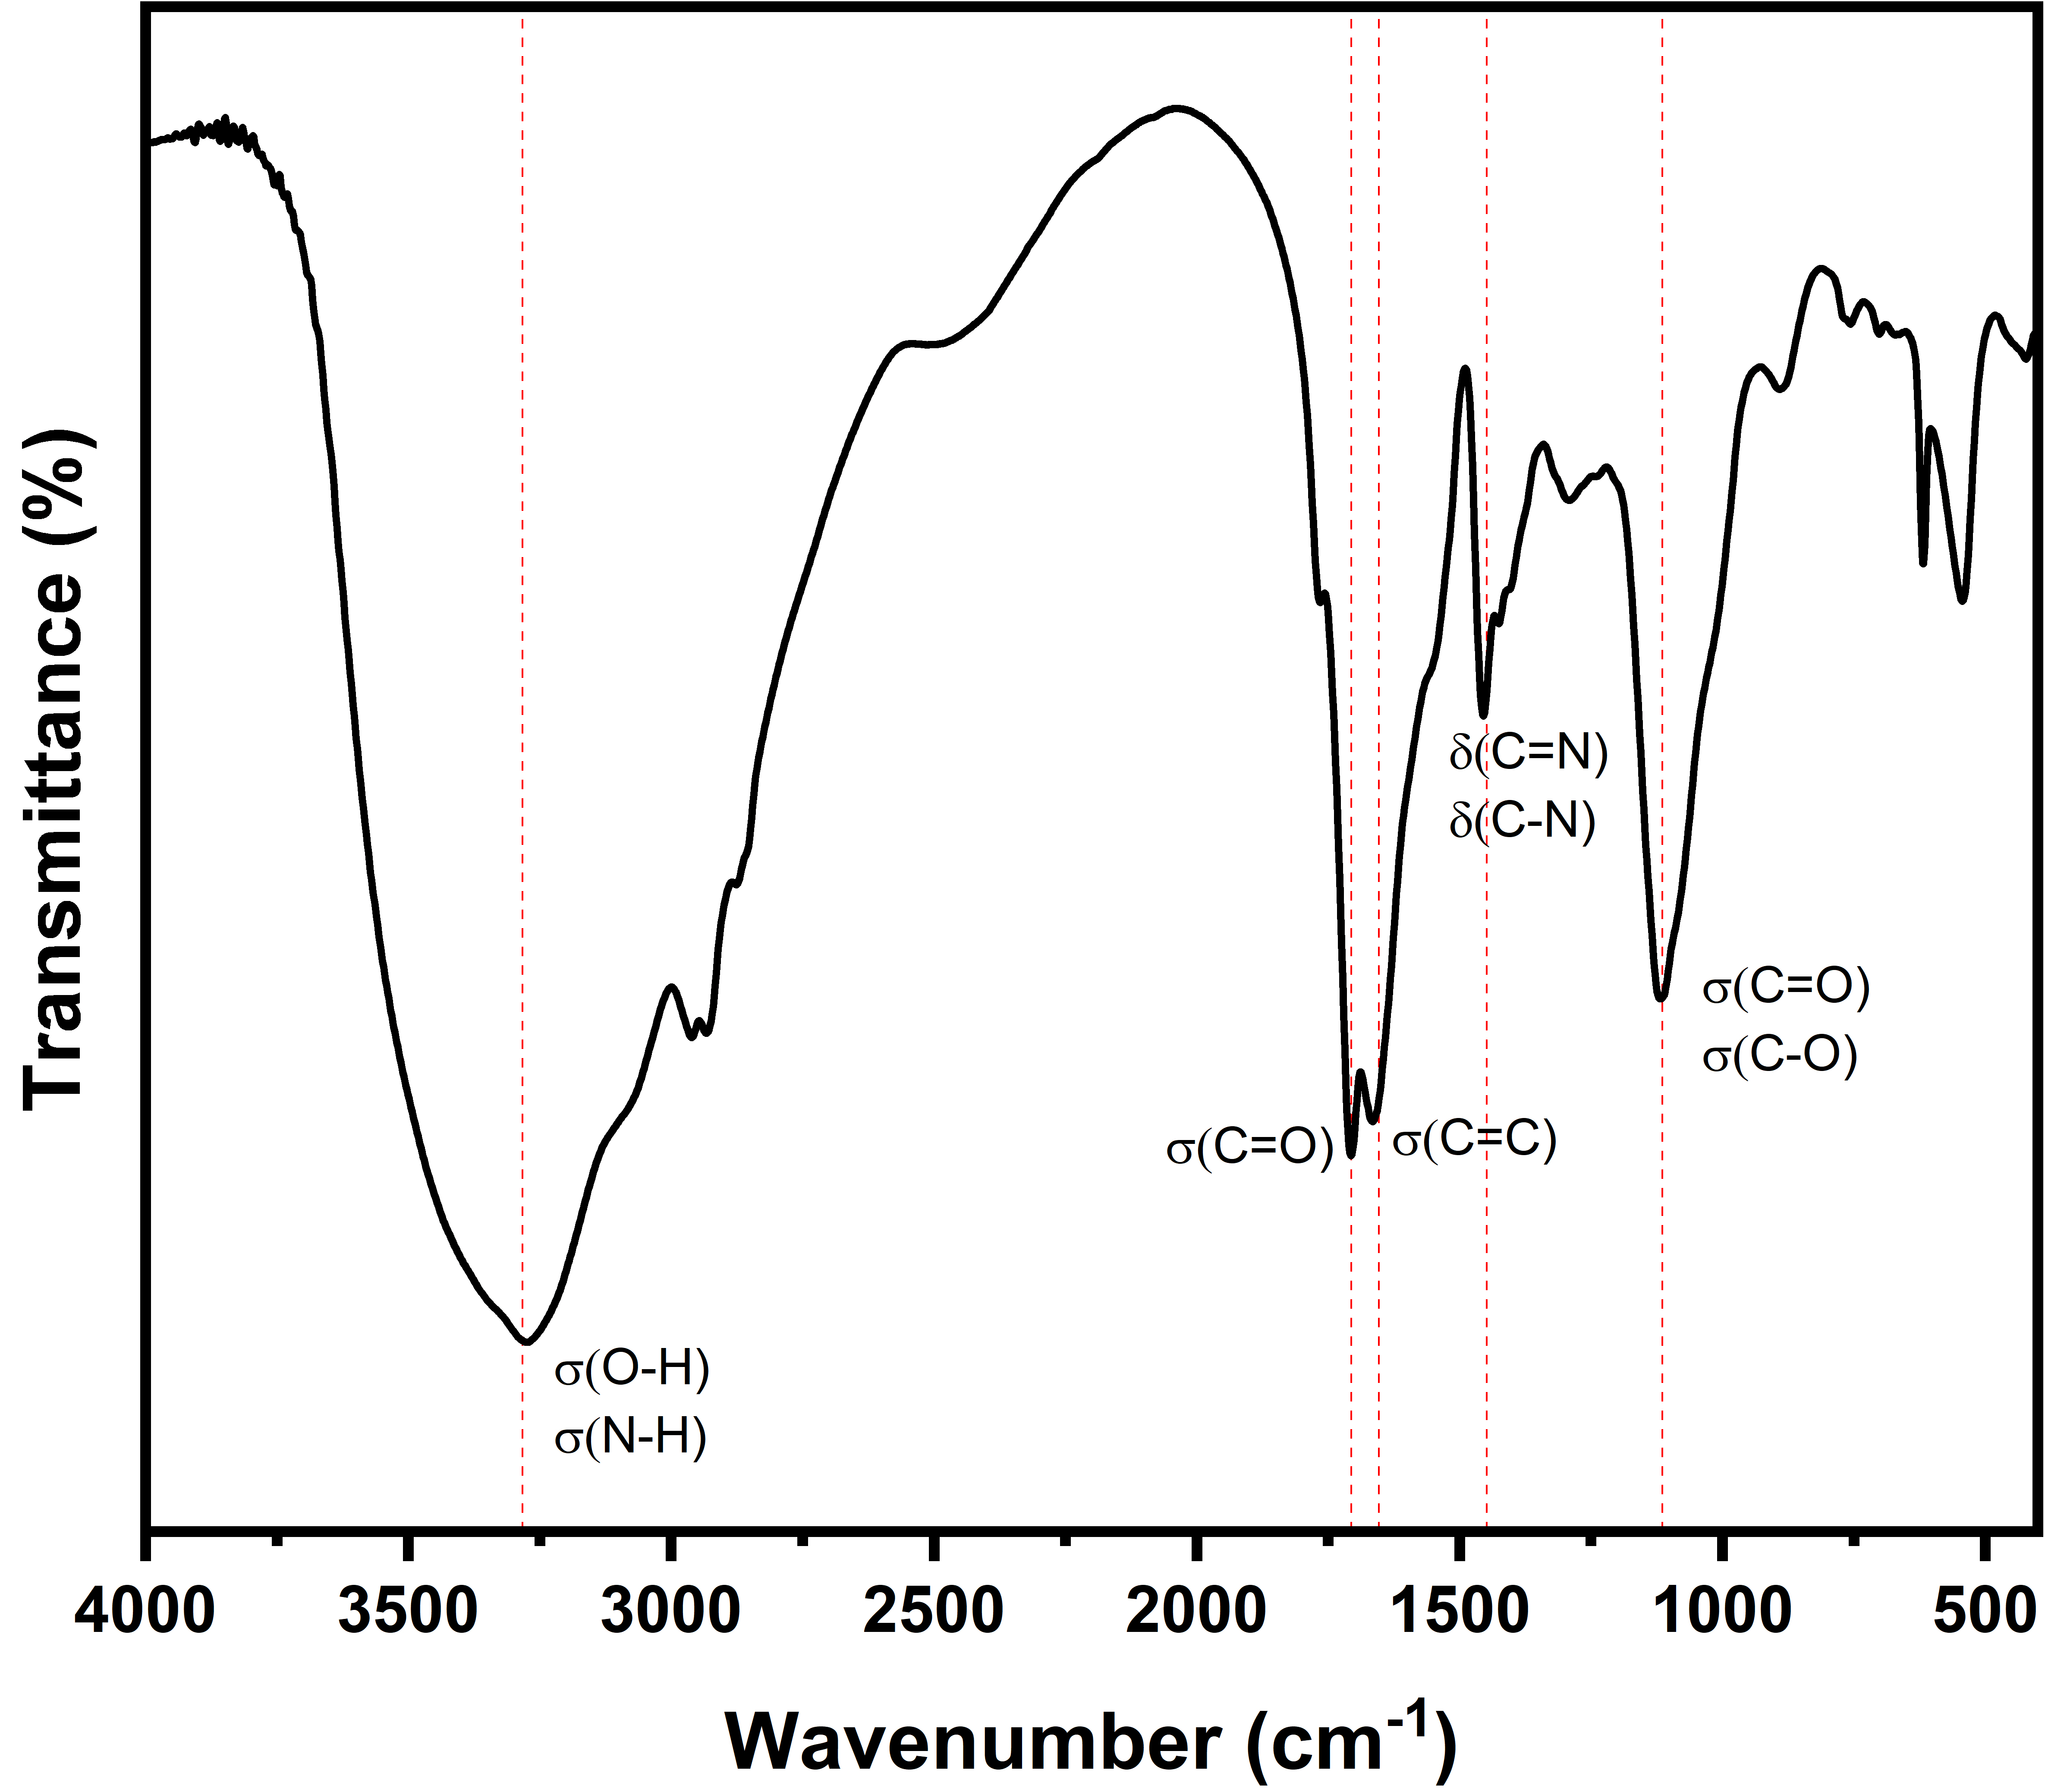
The FTIR spectra of PQ-CDs display a broadband transmission band in the region of 3280 cm-1 attributed to O-H and N-H stretching vibrations (Figure 4). A characteristic band around 2930 cm-1 is attributed to the stretching of C-H bonds of sp2 and sp3 carbons36. In addition, the band at 1710 cm-1 can be attributed to the stretching vibration of C=O amid bonds. The absorption bands at 1660 cm-1 and 1450 cm-1 represent the C=C stretching band and the C-N/C=N stretching band, respectively31,37,38. The band located at 1115 cm-1 may be related to C-O-C/C-OH stretching, which are very common groups in CDs36,39.

Given the presence of these functional groups, the FTIR spectrum showed good agreement with the XPS data. The PQ-CDs had hydroxyl, carboxyl and carbonyl groups on their surface, as well as high water solubility and stability, which are important characteristics for the application as an ionic sensor40.
3.2. Sensing system optimization
The PQ-CDs concentration directly correlates with the intensity of the resulting fluorescence (Figure S2). The data shows a clear linear relationship between the PQ-CDs concentration and the intensity of the resulting fluorescence, with an R2 value of 0.99831 (Inset Figure S2). The concentration of 54.1 µg mL-1 was selected for the Fe3+ ion detection assay to ensure substantial fluorescence intensity while circumventing the occurrence of self-aggregation, a phenomenon that has the potential to diminish the quantum yield (QY) and fluorescence of the nanoparticles41.
The high fluorescence stability of CDs is an important factor for their practical applications, especially in ion sensing15,42. The PQ-CDs emissions initially decreased, reaching a minimum value of approximately 85% of the initial fluorescence after 5 minutes (Figure S3). However, after this period, the emission recovered to values above 95% of the initial emission, even after 50 minutes. Based on this test, we considered 3 minutes as ideal homogenization period for carrying out the Fe3+ ion detection tests.
3.3. Fe3+ ions determination
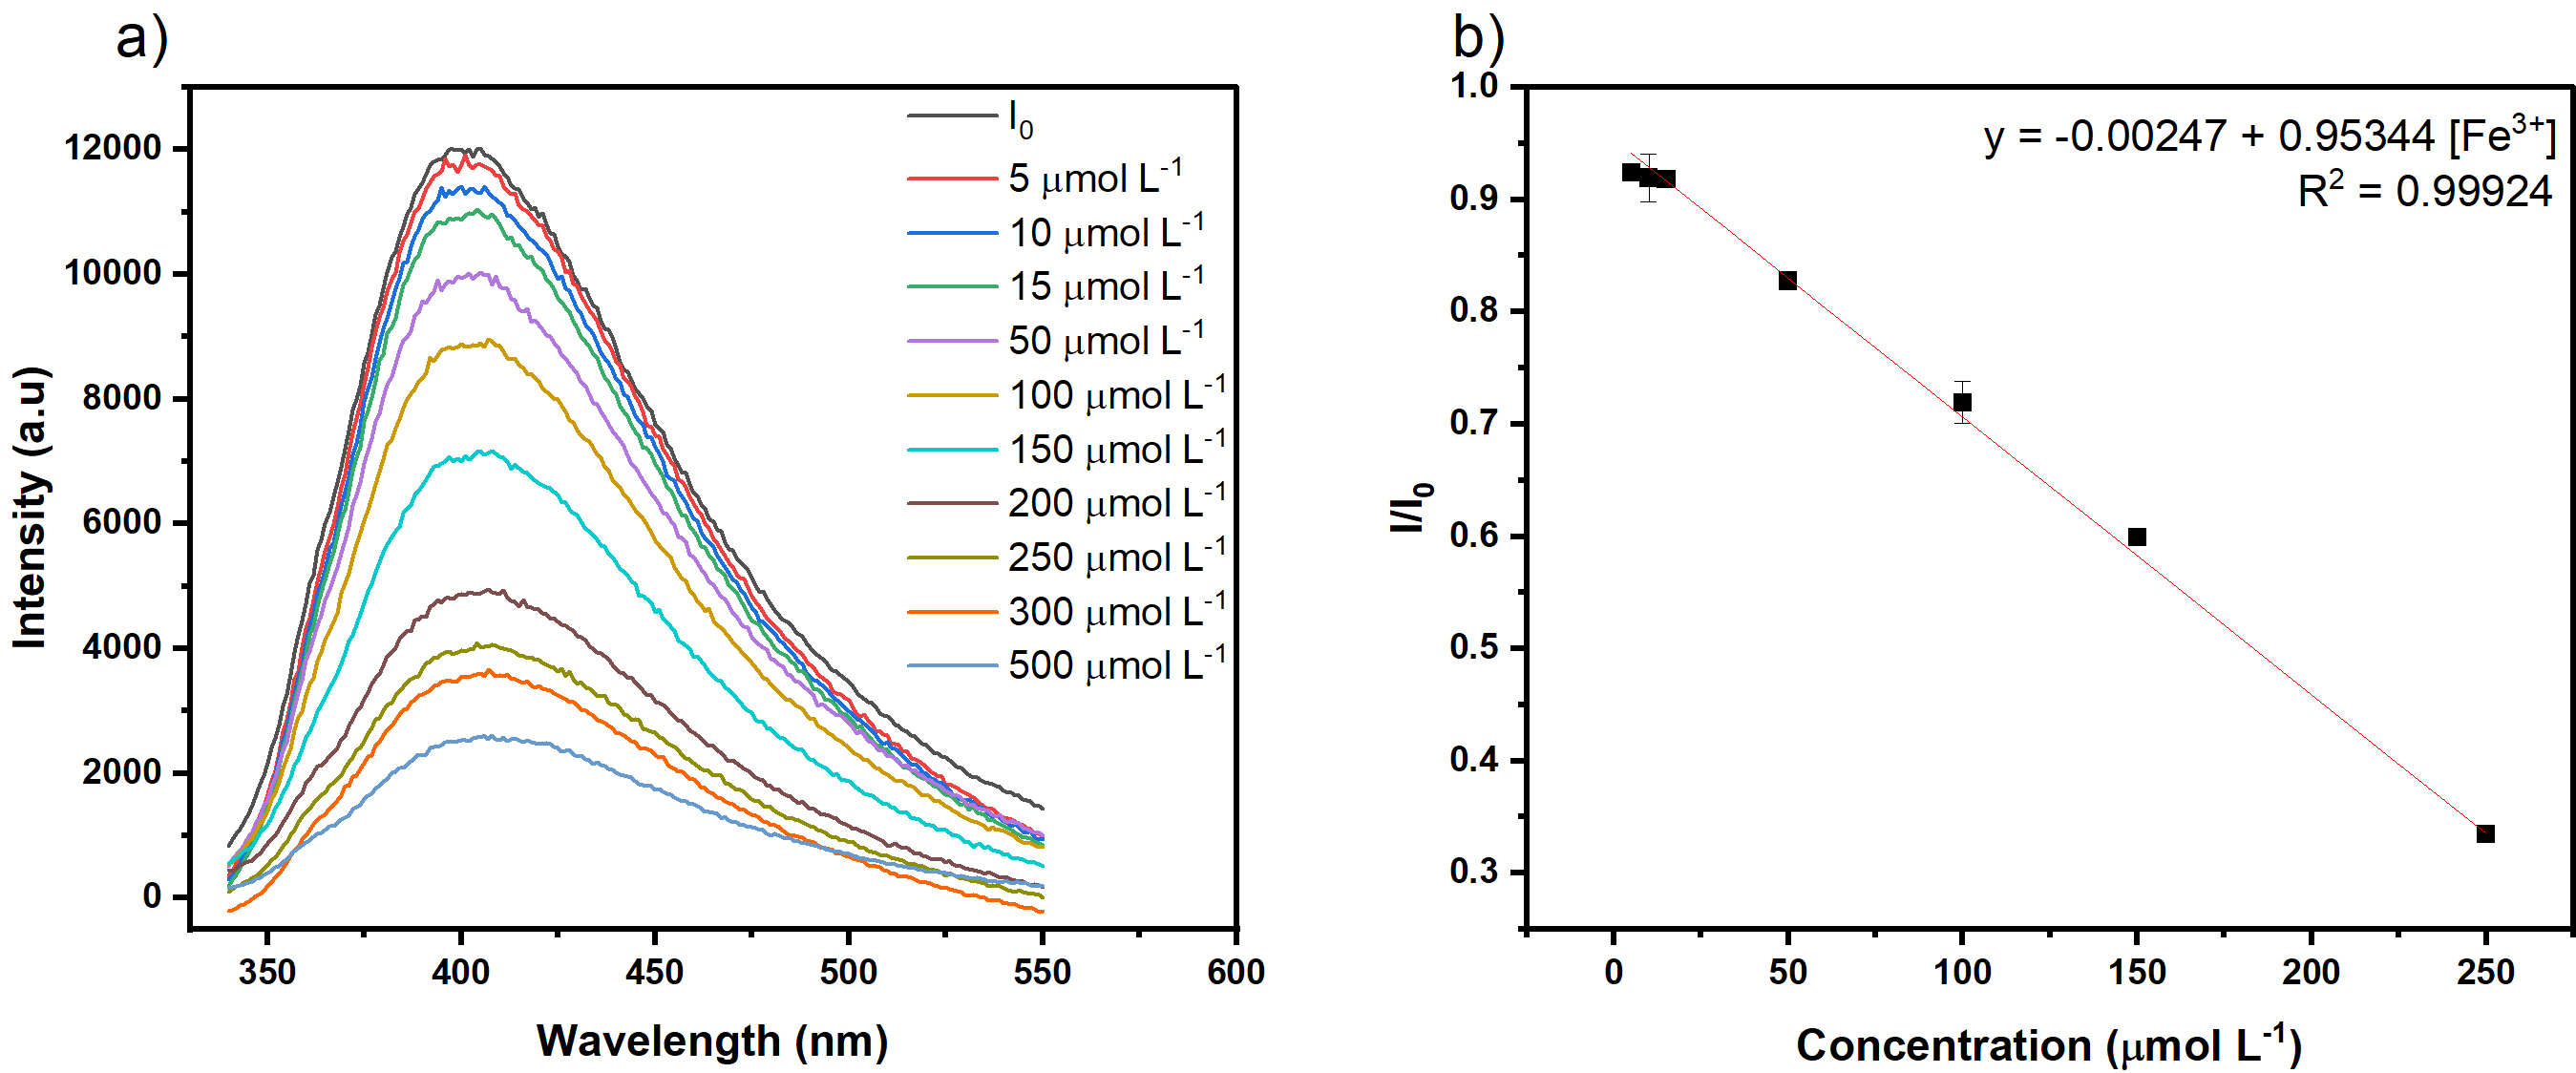
We collected fluorescence spectra by introducing various concentrations (5–500 µmol L-1) of Fe3+ ions into the PQ-CDs suspension (Figure 5a). The fluorescence intensity of PQ-CDs decreased significantly with increasing Fe3+ ion concentrations. The fluorescence intensity was extinguished at approximately 76.55% of its initial value.
a) PL spectra of PQ-CDs in the presence of Fe3+ (5 – 500 μmol L-1); b) The linear fitting curve of I/I0 versus the concentration of Fe3+ ranges from 5 to 250 μmol. L-1.
The process of fluorescence decreasing of PQ-CDs, also known as quenching, can occur in two different ways: statically or dynamically43. This process is described by the Stern-Volmer equation, which takes the following form:
where Ksv is the Stern-Volmer constant, and [Q] is the concentration of the analyte or quencher. The linearity observed between the I0/I ratio and the Fe3+ ion concentration suggests that that either static or dynamic quenching is predominant.
PQ-CDs quenching fluorescence induced by the addition of Fe3+ ions is due to the chelation between the ions and the hydroxyl and amine functional groups present on the nanomaterial's surface44. The decrease in fluorescence observed may be attributed to the formation of complexes between CDs and Fe3+ ions45. Numerous studies have indicated that Fe3+ ions exhibit a strong thermodynamic affinity with the hydroxyl, carbonyl, and amino functional groups that are prevalent in biomass-based CDs46,47. These functional groups act as electron donors, which are readily transferred to the half-filled 3d orbitals of the Fe3+ ions48.
To verify the efficiency of the turn-off Fe3+ ion sensor based on PQ-CDs, we established a linear correlation curve between the I/I0 ratio and Fe3+ ion concentration. The coefficient R2 = 0.99924 between the concentration range of 5 to 250 μmol L-1, in conjunction with the LOD of 1.1618 μmol L-1, substantiates the sensitivity of the PQ-CDs-based sensor (Figure 5b).
The LOD is equivalent to 0.03 mg L-1, which is considerably lower than the maximum limit for Fe3+ ions in drinking water. Furthermore, the PQ-CDs-based sensor has a lower or comparable LOD to other iron ion sensors based on biomass CDs (Table 1). This finding demonstrates the feasibility of the PQ-CDs fluorimetric sensor for application in real drinking water samples.
The study by Sawalha and colleagues used tobacco as a precursor source for synthesizing CDs51. They used extraction and chemical oxidation as synthesis routes. In the latter case, using oxidizing agents such as strong acids is a disadvantage compared to hydrothermal green synthesis, which uses only water as the reaction medium. In addition, Tobacco molasses is a mixture of sugar, flour, and glycerin. The mixture could improve the fluorescence properties of the material. The material detected Fe3+ ions with an LOD of 3.9 μmol L-1.
Durian shell waste was employed as a carbon source for CDs production53. Hydrothermal synthesis was employed to synthesize the CDs. However, the researchers used dichloromethane to remove unreacted organic fractions in the material's purification after synthesis. Dichloromethane is an organic solvent that can cause health problems and environmental contamination. The sensor was based on the quenching in CDs' fluorescence, with a calculated LOD of 1.28 μmol L-1.
PQ-CDs are synthesized from a single biomass source, without doping agents, using only water as the reaction medium, and without solvents in the purification process. This process is in line with the principles of green chemistry for reducing the use of reagents in the synthesis and purification of materials. The PQ-CDs showed higher quantum yields than the other carbon dots mentioned above, and the LOD obtained was lower than other iron ion sensors based on biomass CDs.
4. Conclusion
A fluorescent iron ion sensor based on carbon dots was developed from a biomass source typical of Cariri, Ceará. The PQ-CDs showed higher quantum yields than other CDs synthesized from biomass. The hydroxyl, carbonyl, and amino functional groups present in the PQ-CDs' structure enabled interaction between the PQ-CDs and Fe3+ ions. The sensor exhibited a notable affinity for Fe3+ ions, with a calculated limit of detection (LOD) of 1.16 μmol L-1, a value considerably lower than the limit stipulated by the World Health Organization. This finding underscores the potential for the application of PQ-CDs in the analysis of drinking water samples.
Supplementary material
The following online material is available for this article:
Figure S1 –
Figure S2 –
Figure S3 –
Table S1 –
Table S2 –
5. Acknowledgments
The authors would like to thank the Cearense Foundation of Scientific and Technological Support (FUNCAP), the National Council for Scientific and Technological Development (CNPq), and the State University of Ceara (UECE) Brazil for the granted scholarships. We also would like to thank the Chemistry Department Central Analytical (UFC) for the fluorescence spectroscopy measurements.
6. References
- 1 He Y, Liu S, Xie F, Zhou Y, Yang X. Application of green tea residue-derived carbon dots in the detection of Fe3+ ions and imaging of Caco-2 cells. J Food Compos Anal. 2024;132:106332.
- 2 Wang L, Zhang Y, Chen Y, Huang X, Feng M, Ma Z, et al. Electronic structure modulation in quinoline derivatives through substituent-mediated effects: development of AIE fluorescent probes for Fe3+ detection in water samples. Dyes Pigments. 2024;228:112248.
-
3 Zeng H, Yang X, Yang Y, Liu L, Guo H, Xie L, et al. Fluorescent probes based on cellulose for sensitive detection of Fe3+ and its applications. Ind Crops Prod. 2024;210:118178. http://doi.org/10.1016/j.indcrop.2024.118178
» http://doi.org/10.1016/j.indcrop.2024.118178 -
4 Sall ML, Diaw AKD, Gningue-Sall D, Efremova Aaron S, Aaron JJ. Toxic heavy metals: impact on the environment and human health, and treatment with conducting organic polymers, a review. Environ Sci Pollut Res Int. 2020;27(24):29927-42. http://doi.org/10.1007/s11356-020-09354-3
» http://doi.org/10.1007/s11356-020-09354-3 - 5 Almeida ABB, Araújo Silva PB, Lima MRP, Costa Santos YT, Nogueira Moreira YW. Concentration of iron and manganese in water supply in the municipality of Crato, Ceará: characterization and proposal of treatment. Águas Subterr. 2019;33(2):1-11.
-
6 Kunst Valentini MH, Borges dos Santos G, Sanchez Franz H, Aldrighi da Silva L, Da Silva Fraga G, Peterson de Mello N, et al. Análise da influência de fatores climáticos na concentração de ferro e manganês em água bruta destinada a um sistema de tratamento de água. Rev Bras Geofís. 2022;15(5):2486-99. http://doi.org/10.26848/rbgf.v15.5.p2486-2499
» http://doi.org/10.26848/rbgf.v15.5.p2486-2499 -
7 Wang H, Hu C, Shi B. The control of red water occurrence and opportunistic pathogens risks in drinking water distribution systems: a review. J Environ Sci. 2021;110:92-8. http://doi.org/10.1016/j.jes.2021.03.018
» http://doi.org/10.1016/j.jes.2021.03.018 -
8 Khan R, Qureshi A, Azhar M, Hassan ZU, Gul S, Ahmad S. Recent progress of fluorescent carbon dots and graphene quantum dots for biosensors: synthesis of solution methods and their medical applications. J Fluoresc. 2024. In press. http://doi.org/10.1007/s10895-024-03809-3
» http://doi.org/10.1007/s10895-024-03809-3 -
9 Yuan L, Shao C, Zhang Q, Webb E, Zhao X, Lu S. Biomass-derived carbon dots as emerging visual platforms for fluorescent sensing. Environ Res. 2024;251:118610. http://doi.org/10.1016/j.envres.2024.118610
» http://doi.org/10.1016/j.envres.2024.118610 -
10 Abbas A, Rubab S, Rehman A, Irfan S, Sharif HMA, Liang Q, et al. One-step green synthesis of biomass-derived graphene quantum dots as a highly selective optical sensing probe. Mater Today Chem. 2023;30:101555. http://doi.org/10.1016/j.mtchem.2023.101555
» http://doi.org/10.1016/j.mtchem.2023.101555 -
11 Wu X, Yuan X, Liang E, Liu L, Lin Y, Xie L, et al. A flavonol-labelled cellulose fluorescent probe combined with composite fluorescent film imaging and smartphone technology for the detection of Fe3+ Int J Biol Macromol. 2024;259:129373. http://doi.org/10.1016/j.ijbiomac.2024.129373
» http://doi.org/10.1016/j.ijbiomac.2024.129373 -
12 Kuang T, Jin M, Lu X, Liu T, Vahabi H, Gu Z, et al. Functional carbon dots derived from biomass and plastic wastes. Green Chem. 2023;25(17):6581-602. http://doi.org/10.1039/D3GC01763J
» http://doi.org/10.1039/D3GC01763J -
13 Ozyurt D, Al Kobaisi M, Hocking RK, Fox B. Properties, synthesis, and applications of carbon dots: a review. Carbon Trends. 2023;12:100276. http://doi.org/10.1016/j.cartre.2023.100276
» http://doi.org/10.1016/j.cartre.2023.100276 -
14 Fang M, Wang B, Qu X, Li S, Huang J, Li J, et al. State-of-the-art of biomass-derived carbon dots: preparation, properties, and applications. Chin Chem Lett. 2024;35(1):108423. http://doi.org/10.1016/j.cclet.2023.108423
» http://doi.org/10.1016/j.cclet.2023.108423 -
15 Hamed M, Chinnam S, Bedair A, Emara S, Mansour FR. Carbon quantum dots from natural sources as sustainable probes for metal ion sensing: preparation, characterizations and applications. Talanta Open. 2024;10:100348. http://doi.org/10.1016/j.talo.2024.100348
» http://doi.org/10.1016/j.talo.2024.100348 -
16 Costa JGM, Brito SA, Nascimento EMM, Botelho MA, Rodrigues FFG, Coutinho HDM. Antibacterial properties of pequi pulp oil (Caryocar coriaceum - Wittm). Int J Food Prop. 2011;14(2):411-6. http://doi.org/10.1080/10942910903207744
» http://doi.org/10.1080/10942910903207744 -
17 IBGE: Instituto Brasileiro de Geografia e Estatística. Produção da extração vegetal e da silvicultura 2023 [Internet]. Rio de Janeiro: IBGE; 2024 [cited 2025 Jan 6]. Available from: https://comexstat.mdic.gov.br/pt/comex-vis/4/2513
» https://comexstat.mdic.gov.br/pt/comex-vis/4/2513 -
18 Maciel TCM, Silva TI, Alcantara FDO, Marco CA, Ness RLL. Substrato à base de pequi (Caryocar coriaceum) na produção de mudas de tomate e pimentão. Rev Agric Neotrop. 2017;4(2):9-16. http://doi.org/10.32404/rean.v4i2.1551
» http://doi.org/10.32404/rean.v4i2.1551 -
19 Lakowicz JR. Principles of fluorescence spectroscopy. New York: Springer; 2006. 954 p. http://doi.org/10.1007/978-0-387-46312-4
» http://doi.org/10.1007/978-0-387-46312-4 -
20 Wu P, Li W, Wu Q, Liu Y, Liu S. Hydrothermal synthesis of nitrogen-doped carbon quantum dots from microcrystalline cellulose for the detection of Fe3+ ions in an acidic environment. RSC Adv. 2017;7(70):44144-53. http://doi.org/10.1039/C7RA08400E
» http://doi.org/10.1039/C7RA08400E -
21 Tadesse A, Ramadevi D, Hagos M, Battu G, Basavaiah K. Synthesis of nitrogen doped carbon quantum dots/magnetite nanocomposites for efficient removal of methyl blue dye pollutant from contaminated water. RSC Adv. 2018;8(16):8528-36. http://doi.org/10.1039/C8RA00158H
» http://doi.org/10.1039/C8RA00158H -
22 Daulay A, Nasution LH, Huda M, Amin M, Nikmatullah M, Supiyani, et al. Green sources for carbon dots synthesis in sensing for food application: a review. Biosens Bioelectron X. 2024;17:100460. http://doi.org/10.1016/j.biosx.2024.100460
» http://doi.org/10.1016/j.biosx.2024.100460 -
23 Long C, Jiang Z, Shangguan J, Qing T, Zhang P, Feng B. Applications of carbon dots in environmental pollution control: a review. Chem Eng J. 2021;406:126848. http://doi.org/10.1016/j.cej.2020.126848
» http://doi.org/10.1016/j.cej.2020.126848 -
24 Carneiro SV, Oliveira JJP, Rodrigues VSF, Fechine LMUD, Antunes RA, Alves ML No, et al. Doped carbon quantum dots/pva nanocomposite as a platform to sense nitrite ions in meat. ACS Appl Mater Interfaces. 2022;14(38):43597-611. http://doi.org/10.1021/acsami.2c09197
» http://doi.org/10.1021/acsami.2c09197 -
25 John BK, Mathew J, Sreekanth K, Radhakrishnan EK, Mathew B. Biomass derived carbon quantum dots as a versatile platform for fluorescent sensing, catalytic reduction, fluorescent ink and anticancer agents. Mater Today Sustainability. 2024;26:100715. http://doi.org/10.1016/j.mtsust.2024.100715
» http://doi.org/10.1016/j.mtsust.2024.100715 -
26 Manjubaashini N, Bargavi P, Balakumar S. Carbon quantum dots derived from agro waste biomass for pioneering bioanalysis and in vivo bioimaging. J Photochem Photobiol Chem. 2024;454:115702. http://doi.org/10.1016/j.jphotochem.2024.115702
» http://doi.org/10.1016/j.jphotochem.2024.115702 -
27 Zhang Q, Wang X, Yuan L, Yu L, Shao C, Jia H, et al. Nitrogen-doped biomass-derived carbon dots for fluorescence determination of sunset yellow. Anal Methods. 2024;16(14):2063-70. http://doi.org/10.1039/D3AY01944F
» http://doi.org/10.1039/D3AY01944F -
28 Liu Y, Yang H, Huang T, Niu L, Liu S. Recent advances of biomass-derived carbon dots with room temperature phosphorescence characteristics. Nano Today. 2024;56:102257. http://doi.org/10.1016/j.nantod.2024.102257
» http://doi.org/10.1016/j.nantod.2024.102257 -
29 Lv J, Tian H, Pan L, Chen Z, Li M, Ghiladi RA, et al. Biomass derived carbon dots with antibacterial and anti-inflammatory properties for the treatment of wound healing. Chem Eng Sci. 2024;295:120084. http://doi.org/10.1016/j.ces.2024.120084
» http://doi.org/10.1016/j.ces.2024.120084 -
30 Luo Z, Wu C, Yan M, Yu X, Yu X, Qian Q, et al. Enhancing detectivity of organic photodetectors through the biomass carbon quantum dots from sugarcane bagasse. Mater Chem Phys. 2024;316:129056. http://doi.org/10.1016/j.matchemphys.2024.129056
» http://doi.org/10.1016/j.matchemphys.2024.129056 -
31 Qi H, Liu C, Jing J, Jing T, Zhang X, Li J, et al. Two kinds of biomass-derived carbon dots with one-step synthesis for Fe3+ and tetracyclines detection. Dyes Pigments. 2022;206:110555. http://doi.org/10.1016/j.dyepig.2022.110555
» http://doi.org/10.1016/j.dyepig.2022.110555 -
32 Woo J, Song Y, Ahn J, Kim H. Green one-pot preparation of carbon dots (CD)-embedded cellulose transparent film for Fe3+ indicator using ionic liquid. Cellulose. 2020;27(8):4609-21. http://doi.org/10.1007/s10570-020-03099-5
» http://doi.org/10.1007/s10570-020-03099-5 -
33 Fang L, Xu Q, Zheng X, Zhang W, Zheng J, Wu M, et al. Soy flour-derived carbon dots: facile preparation, fluorescence enhancement, and sensitive Fe3+ detection. J Nanopart Res. 2016;18(8):224. http://doi.org/10.1007/s11051-016-3521-z
» http://doi.org/10.1007/s11051-016-3521-z -
34 Atchudan R, Edison TNJI, Aseer KR, Perumal S, Karthik N, Lee YR. Highly fluorescent nitrogen-doped carbon dots derived from Phyllanthus acidus utilized as a fluorescent probe for label-free selective detection of Fe3+ ions, live cell imaging and fluorescent ink. Biosens Bioelectron. 2018;99:303-11. http://doi.org/10.1016/j.bios.2017.07.076
» http://doi.org/10.1016/j.bios.2017.07.076 -
35 Guo J, Li H, Ling L, Li G, Cheng R, Lu X, et al. Green synthesis of carbon dots toward anti-counterfeiting. ACS Sustain Chem& Eng. 2020;8(3):1566-72. http://doi.org/10.1021/acssuschemeng.9b06267
» http://doi.org/10.1021/acssuschemeng.9b06267 -
36 Jeeva D, Velu KS, Mohandoss S, Ahmad N, Padmini S, Priyadharshini A, et al. A facile green synthesis of photoluminescent carbon dots using Pumpkin seeds for ultra-sensitive Cu2+ and Fe3+ ions detection in living cells. J Mol Struct. 2024;1312:138543. http://doi.org/10.1016/j.molstruc.2024.138543
» http://doi.org/10.1016/j.molstruc.2024.138543 -
37 Ge G, Li L, Chen M, Wu X, Yang Y, Wang D, et al. Green synthesis of nitrogen-doped carbon dots from fresh tea leaves for selective Fe3+ ions detection and cellular imaging. Nanomaterials. 2022;12(6):986. http://doi.org/10.3390/nano12060986
» http://doi.org/10.3390/nano12060986 -
38 Zhang J, Zheng G, Tian Y, Zhang C, Wang Y, Liu M, et al. Green synthesis of carbon dots from elm seeds via hydrothermal method for Fe3+ detection and cell imaging. Inorg Chem Commun. 2022;144:109837. http://doi.org/10.1016/j.inoche.2022.109837
» http://doi.org/10.1016/j.inoche.2022.109837 -
39 Roshni V, Gujar V, Muntjeeb S, Doshi P, Ottoor D. Novel and reliable chemosensor based on C. dots from sunflower seeds for the distinct detection of picric acid and bilirubin. Spectrochim Acta A Mol Biomol Spectrosc. 2021;250:119354. http://doi.org/10.1016/j.saa.2020.119354
» http://doi.org/10.1016/j.saa.2020.119354 -
40 Preethi M, Viswanathan C, Ponpandian N. A green path to extract carbon quantum dots by coconut water: another fluorescent probe towards Fe3+ ions. Particuology. 2021;58:251-8. http://doi.org/10.1016/j.partic.2021.03.019
» http://doi.org/10.1016/j.partic.2021.03.019 -
41 Ahmad Farid MA, Lease J, Yoshito A. Lignocellulosic biomass-derived carbon quantum dots (CQDs): a novel approach utilizing organosolv lignin from Moso bamboo waste. J Clean Prod. 2024;467:142852. http://doi.org/10.1016/j.jclepro.2024.142852
» http://doi.org/10.1016/j.jclepro.2024.142852 -
42 Dubey P. An overview on animal/human biomass-derived carbon dots for optical sensing and bioimaging applications. RSC Adv. 2023;13(50):35088-126. http://doi.org/10.1039/D3RA06976A
» http://doi.org/10.1039/D3RA06976A -
43 Ghali M. Static quenching of bovine serum albumin conjugated with small size CdS nanocrystalline quantum dots. J Lumin. 2010;130(7):1254-7. http://doi.org/10.1016/j.jlumin.2010.02.034
» http://doi.org/10.1016/j.jlumin.2010.02.034 -
44 Seesuea C, Sansenya S, Thangsunan P, Wechakorn K. Green synthesis of elephant manure-derived carbon dots and multifunctional applications: metal sensing, antioxidant, and rice plant promotion. Sustainable Mater Technol. 2024;39:e00786. http://doi.org/10.1016/j.susmat.2023.e00786
» http://doi.org/10.1016/j.susmat.2023.e00786 -
45 Kasirajan K, Karunakaran M, Choi HK. Synthesis of environmentally-friendly carbon quantum dots from orange juice for selective detection of Fe3+ ions, antibacterial activity, and bio-imaging applications. J Environ Chem Eng. 2024;12(5):113535. http://doi.org/10.1016/j.jece.2024.113535
» http://doi.org/10.1016/j.jece.2024.113535 -
46 Jose J, Rangaswamy M, Shamnamol GK, Greeshma KP. A short review on natural precursors-plant-based fluorescent carbon dots for the targeted detection of metal ions. Sustain Chem Environ. 2024;7:100114. http://doi.org/10.1016/j.scenv.2024.100114
» http://doi.org/10.1016/j.scenv.2024.100114 -
47 Li Y, Liu Y, Shang X, Chao D, Zhou L, Zhang H. Highly sensitive and selective detection of Fe3+ by utilizing carbon quantum dots as fluorescent probes. Chem Phys Lett. 2018;705:1-6. http://doi.org/10.1016/j.cplett.2018.05.048
» http://doi.org/10.1016/j.cplett.2018.05.048 -
48 Xu L, Mao W, Huang J, Li S, Huang K, Li M, et al. Economical, green route to highly fluorescence intensity carbon materials based on ligninsulfonate/graphene quantum dots composites: application as excellent fluorescent sensing platform for detection of Fe3+ ions. Sens Actuators B Chem. 2016;230:54-60. http://doi.org/10.1016/j.snb.2015.12.043
» http://doi.org/10.1016/j.snb.2015.12.043 -
49 Varisco M, Zufferey D, Ruggi A, Zhang Y, Erni R, Mamula O. Synthesis of hydrophilic and hydrophobic carbon quantum dots from waste of wine fermentation. R Soc Open Sci. 2017;4(12):170900. http://doi.org/10.1098/rsos.170900
» http://doi.org/10.1098/rsos.170900 -
50 Watcharamongkol T, Khaopueak P, Seesuea C, Wechakorn K. Green hydrothermal synthesis of multifunctional carbon dots from cassava pulps for metal sensing, antioxidant, and mercury detoxification in plants. Carbon Res Convers. 2024;7(2):100206. http://doi.org/10.1016/j.crcon.2023.100206
» http://doi.org/10.1016/j.crcon.2023.100206 -
51 Sawalha S, Assali M, Yaseen A, Ataya A, Refai L, Hamed R, et al. Carbon nanodots synthesized from used tobacco molasses as promising selective probes for Fe (III) ion sensing. Mater Today Sustainability. 2024;25:100697. http://doi.org/10.1016/j.mtsust.2024.100697
» http://doi.org/10.1016/j.mtsust.2024.100697 -
52 Jafari SM, Masoum S, Tafreshi SAH. A microlagal-based carbonaceous sensor for enzymatic determination of glucose in blood serum. J Ind Eng Chem. 2021;101:195-204. http://doi.org/10.1016/j.jiec.2021.06.012
» http://doi.org/10.1016/j.jiec.2021.06.012 -
53 Jayaweera S, Yin K, Hu X, Ng WJ. Facile preparation of fluorescent carbon dots for label-free detection of Fe3+ J Photochem Photobiol Chem. 2019;370:156-63. http://doi.org/10.1016/j.jphotochem.2018.10.052
» http://doi.org/10.1016/j.jphotochem.2018.10.052