Upper to Lower Bainite Transition in a High-Carbon Low Alloy Steel: Linking Overall Transformation Kinetics, Microstructure and Microhardness
Abstract
The transition from upper-to-lower bainite in carbon steels is a complex process yet not fully explored. This study examines such transition in a 0.7C, 0.74Mn, 0.61Si, 0.2Cr (wt%) low-alloy steel using a comprehensive approach that integrates dilatometry, scanning electron microscopy (SEM), ex-situ HEXRD, and microhardness testing. Microhardness and dislocation density were found strongly coupled, both increasing with decreasing austempering temperature and presenting changing trends at approximately 350°C and 300°C. Likewise, an Arrhenius plot derived from the curves of transformed fraction as a function of austempering temperature presented the same behaviour. These turning points are considered, respectively, the onset and the end of the transitional interval between upper and lower bainite. Furthermore, SEM analyses confirmed a progressive change in morphology, from coarse upper bainite at high temperatures (400°C), to a mixture of upper and lower bainite in the transitional range, and finally to exclusively fine lower bainite at low temperatures (275°C). The results support that the upper-to-lower bainite transition is not a discrete step but a continuum and offer insights into the interplay between bainite morphology, overall transformation kinetics, and microhardness, which are critical for optimizing heat treatments routes.
Keywords:
upper and lower bainite; transition; transformation kinetics; morphology
1. Introduction
In terms of the global kinetics of phase transformations, the onset of austenite decomposition in isothermal transformation temperature (ITT) diagrams is commonly represented by C-shaped curves1. In plain-carbon and low-alloy steels, the C-curves associated with different microconstituents often overlap2. This overlap gives rise to transitional temperature ranges in which multiple microconstituents form simultaneously1.
The transition from upper to lower bainite in Fe–C systems is of particular interest. At the bainite start temperature (Bs), the isothermal decomposition of austenite yields two different microconstituents: the earliest traces of the upper bainite morphology coexisting with a pearlitic microstructure2-4. In plain carbon steels containing up to 0.35 wt% C, only upper bainite is reported to exist5.
Oka and Okamoto5 verified with the aid of Arrhenius plots and optical microscopy that for steels with 0.54 to 1.10 wt% C the volumetric effects due to the presence of lower bainite typically initiate at around 350 °C, known as the lower bainite start temperature (LBs). Goodnow et al.6 also verified this using the same technique. For steels with even higher carbon content (>1.10 wt% C), the transition temperature decreased with increasing carbon content5.
Fang et al.7 also studied the transitional interval in a steel with 0.66 wt% C with the aid of a modified JMAK model. The authors spotted the onset of lower bainite at 375°C. In the transitional interval, upper bainite nucleates first being followed by lower bainite whose volumetric fraction increases with decreasing austempering temperature3. The authors reported a lower limit for the transitional interval of 300°C7. The dissimilar values for LBs when compared with the results reported by Oka and Okamoto5 for a similar steel chemical composition call attention. Nevertheless, it must also be considered that the JMAK model constants lack explicit physical meaning and are heavily affected by data handling8.
Lower bainite starts to give way to martensite at the martensite start temperature, Ms. However, the supercooled, unstable hypoeutectoid austenite below Ms can decompose into lower bainite, meaning that lower bainite can form after athermal martensite1. Van Bohemen et al.9 observed this in a Fe-0.66C steel.
Many studies concerning the measurement and prediction of the onset of lower bainite exist10-12. Yet, the existing literature provides limited systematic data concerning the whole transitional interval from upper to lower bainite, which is fundamental for scientific and industrial purposes. In this article, different methods to access the upper-to-lower bainite transitional interval were confronted to correlate overall transformation kinetics, microstructural features and microhardness in a high-carbon, low-alloy steel. Dilatometry, Scanning electron microscopy, microhardness, optical microscopy, and ex-situ high-energy X-ray diffraction were employed.
2. Materials and Methods
2.1. Chemical composition and phase stability
The chemical composition of the investigated steel was determined using optical emission spectrometry. Thermodynamic equilibrium phase fractions as a function of temperature were calculated with CALPHAD, employing Thermo-Calc 2019 software together with the TCFE11 Steels/Fe-alloys database.
2.2. Dilatometry
Dilatometric tests were carried out on a Bähr DIL 805A quenching dilatometer. Cylindrical samples with dimensions of 10 mm in height and 4 mm in diameter were used. All measurements were performed using a type K thermocouple, while analytical helium 5.0 served as the cooling medium. Data processing was performed with Origin Pro 2017 software, following methodologies reported elsewhere13.
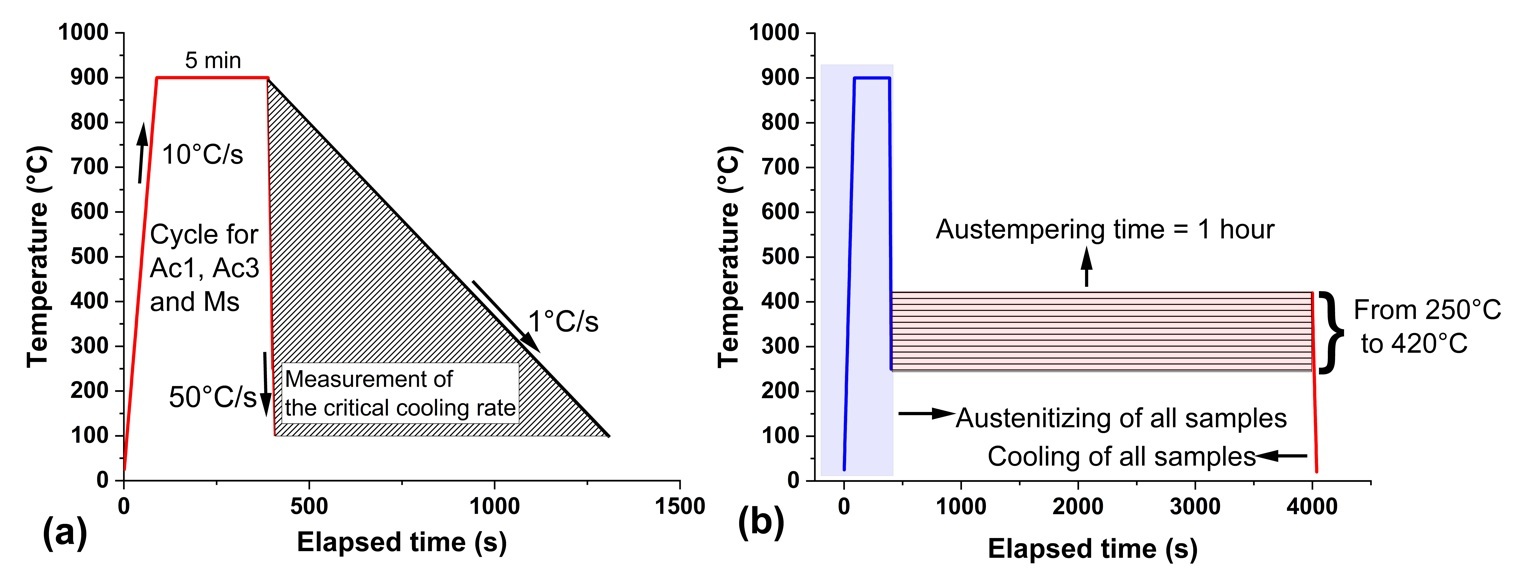
In Figure 1a the red line illustrates the procedure to estimate the critical transformation temperatures (Ac1, Ac3, and Ms). Specimens were heated to 900 °C at a rate of 10 °C/s, maintained at this temperature for 5 minutes, and subsequently cooled to 100 °C at 50 °C/s. The shaded area represents various cooling rates, ranging from 1 °C/s to 50 °C/s, applied from the austenitizing temperature of 900°C to measure the critical cooling rate.
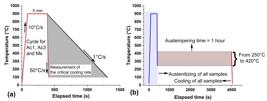
a) Illustrates the schematic for determining the critical temperatures (red line) and the critical cooling rate (shaded region). b) Illustrates the heat treatment routes used to study the transition from upper to lower bainite.
Figure 1b presents the heat treatment cycles used to study the transition from upper to lower bainite. The blue shaded area indicates the austenitizing procedure, which is common to all conditions, followed to the quenching to the respective austempering temperatures. The samples were heated at 10 °C/s to 900 °C, held at this temperature for 5 minutes, and then cooled at 50 °C/s to various austempering temperatures ranging from 420 °C to 250°C. The austempering step is illustrated by the horizontal lines in the red shaded area. The austempering time was fixed at 1 hour for all temperatures studied. Finally, all samples were cooled to room temperature.
The upper-to-lower bainite transition was tracked based on the kinetics of austenite decomposition, microstructural changes, microhardness, and dislocation density changes. In terms of kinetics of phase transformation, the transition from upper to lower bainite was assessed with Arrhenius plots. Such methodology, described by Oka and Okamoto5, is based on the time required to reach 50% of transformed fraction at each austempering temperature. The transitional temperature points are defined as those where the curve slope changes.
2.3. Microstructural characterization (micrography and microhardness)
For metallography, samples were first ground, polished and etched with Nital 2%. They were characterized with a SEM-FEG FEI Inspect 50 with a voltage of 20kV, a spot of four and a working distance of 10mm. Microhardness tests were performed with a Shimadzu HMV-2TDQDW device, applying a load of 300 gf for 15 seconds. The reported values correspond to the average of 15 individual measurements. Optical microscope was eventually used as well.
2.4. Ex-situ high-energy X-ray diffraction (HEXRD)
Ex-situ high-energy X-ray diffraction (HEXRD) measurements were conducted at the P07 beamline of the PETRA III synchrotron facility at DESY (Hamburg, Germany). A monochromatic X-ray beam with an energy of 102.35 keV and wavelength (𝞴) of 0.12114 Å was employed in transmission geometry. The radiation energy and its wavelength are connected through the equation
where h is the Planck’s constant and c the speed of light.
Measurements were done with the samples at room temperature. LaB6 was used as a calibration standard. Diffraction patterns were recorded using a Perkin Elmer fast detector and the resulting two-dimensional rings were subsequently integrated to yield one-dimensional diffraction profiles.
Data reduction and analysis were carried out using the open-source software Pydidas, which allowed background subtraction, calibration, and peak fitting procedures. Diffraction peaks were fitted using a Voigt function.
Full width at half length (FWHL) values were extracted from the fitted peaks considering the correction for instrumental broadening. The Williamson–Hall method14-16 was applied to evaluate the peak broadening and estimate the dislocation density within the bainitic ferrite phase. This analysis involved plotting the peak broadening (ΔK) as a function of the diffraction vector (K). Where
and
Δ(2θ) is the FWHL. Four ferritic planes were used for this analysis: (110), (200), (211) and (220). Both 𝞱 and ∆2𝞱 are given in radians.
For each sample the four values of and are correlated through a linear equation:
where is the microstrain. The dislocation density () can then be calculated as:
k is a constant for BCC metals set for 14.4 with the Burgers’s vector (b) along14-16. F is the interaction parameter which can be assumed to be 1 and to 2.5 Å where 2.87 Å is the lattice parameter of pure BCC Fe. These parameters are explained in detail elsewhere16,17.
3. Results
3.1. Chemical composition, phase stability and kinetics of bainite formation
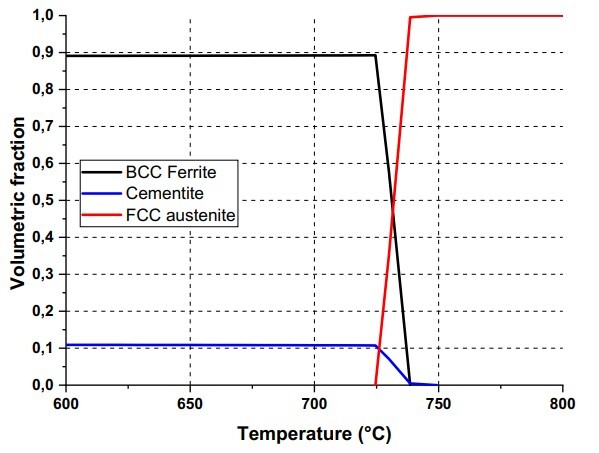
The Table 1 presents the steel’s chemical composition. It is a 0.7C, 0.74Mn, 0.61Si, 0.2Cr (wt%) low alloy steel. Carbide forming alloying elements chromium and molybdenum are seen. Figure 2 presents the metastable phase diagram for the temperature range between 600°C and 800°C, evidencing the phases that predominate in this temperature interval: ferrite (black line), cementite (blue line) and austenite (red line).
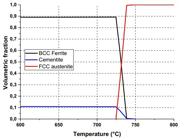
The respective values for Ac1, Ac3 and Ms were 750°C, 782°C and 238°C. The critical cooling rate was measured to be lower than 15°C/s.
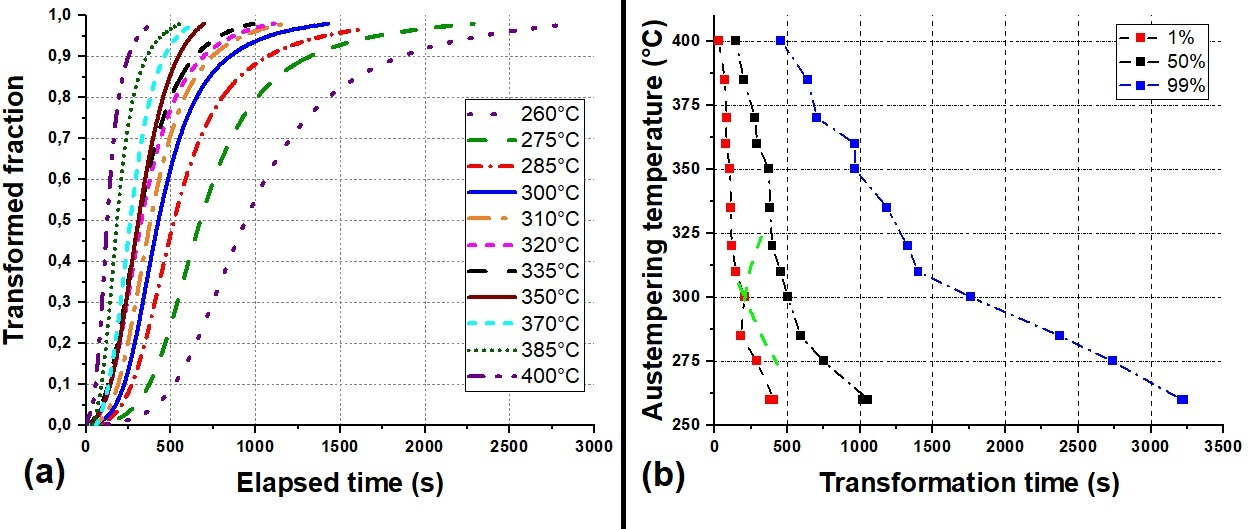
The transformed fractions as a function of elapsed austempering time for different austempering temperatures, Figure 3a, were calculated by applying the lever rule to the dilatometric data. The method was described in detail elsewhere13. It is seen that the transformation time increases with decreasing austempering temperature.
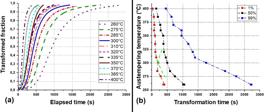
a) Bainite fractions as a function of austempering time for diverse austempering temperatures. b) Portion of the ITT diagram for the studied steel in the region concerning the formation of upper and lower bainite.
Figure 3b presents a region of the ITT diagram for such steel concerning the formation of upper and lower bainite. It was constructed with the data of Figure 3a. Curves for transformed fractions for 1%, 50% and 99% are presented. Stasis (incomplete reaction phenomenon) is not considered for such steel chemical composition as carbon precipitation occurs readily during transformation18. Thus, given enough time all the austenite decomposes into bainite. The overlap between C‑curves corresponding to different microconstituents makes it difficult to tell them apart. Nevertheless, at 300 °C and 1% transformed fraction a clear intersection, evidenced by the green lines, becomes discernible.
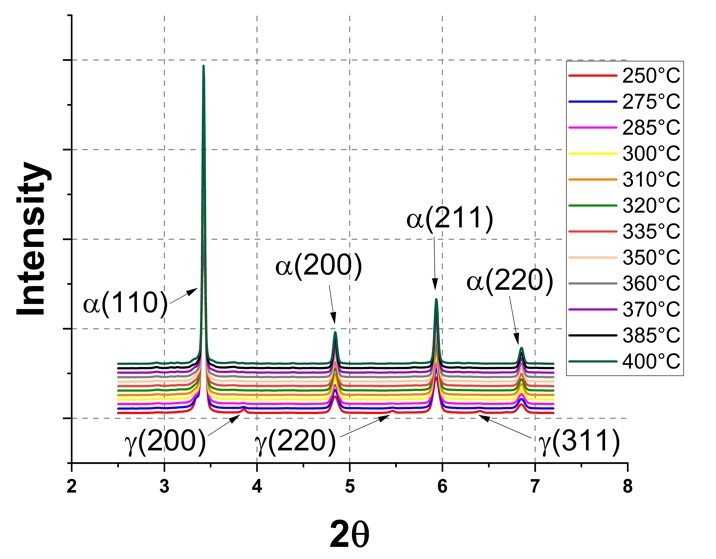
Figure 4 presents difractograms for different austempering temperatures from 250°C to 400°C. The peaks in evidence concern the main phases present in each austempering temperature. For all temperatures the ferrite peaks (110), (200), (211), and (220) are present. Only at the slowest transformation rate, 250°C, some retained austenite is seen indicated by the austenite peaks (200), (220), and (311).
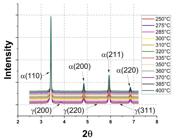
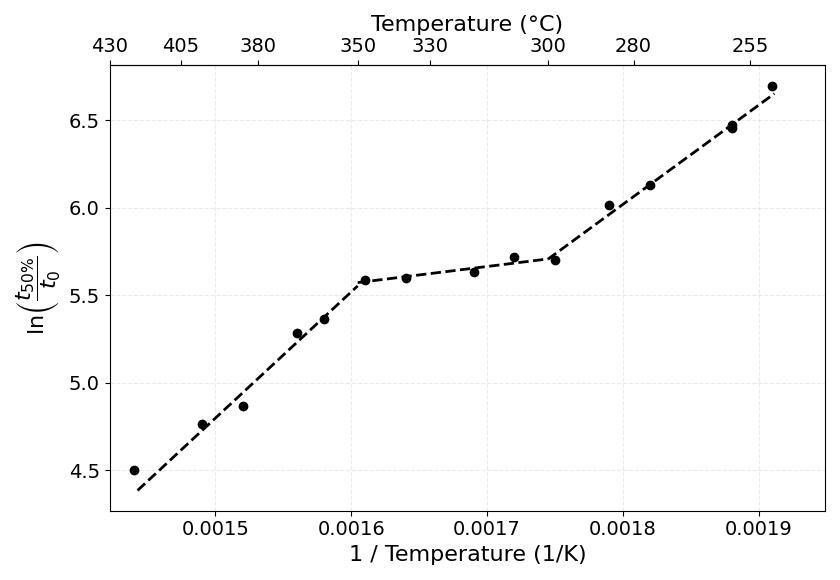
Figure 5 presents the natural logarithm of the time (s) elapsed from 1% to 50% of austenite transformed into bainite during austempering at different austempering temperatures.
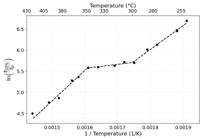
Arrhenius plot of the natural logarithm of the time elapsed from 1% to 50% of austenite transformed into bainite as a function of the inverse of the absolute austempering temperature.
The lower x-axis represents the inverse of the absolute austempering temperature (1/K), while the upper x-axis shows the corresponding temperature in °C. It should be noted that the direction of increasing temperature on the upper x-axis is reversed. The y-axis represents the natural logarithm of the ratio between the time required for the transformation to progress from 1% to 50% () and a reference time, , which is introduced for mathematical convenience, ensuring that the argument of the natural logarithm is dimensionless. is taken as 1s.
The Arrhenius plot is divided in three regions: the slope changes seen at 300°C and 350°C suggest changes in the overall kinetics controlling mechanisms and are the points at which the C curves due to the formation of differing microconstituents superpose.
The overall apparent activation energy, , for each region of the Arrhenius plot is calculated based on Equation 619.
The value of for each region is calculated by multiplying the slope of the curve (Figure 5) in each region by the universal gas constant, R (J/mol.K). The results are presented in Table 2. A significant variation in the apparent activation energy is observed with changes in bainite morphology, measuring 67.65 kJ/mol in the upper bainite range, decreasing to 7.75 kJ/mol in the transitional region, and increasing to 51.85 kJ/mol in the lower bainite range.
Overall apparent activation energy for bainite decomposition calculated based on the Arrhenius plot of Figure 5.
3.2. Morphological transition
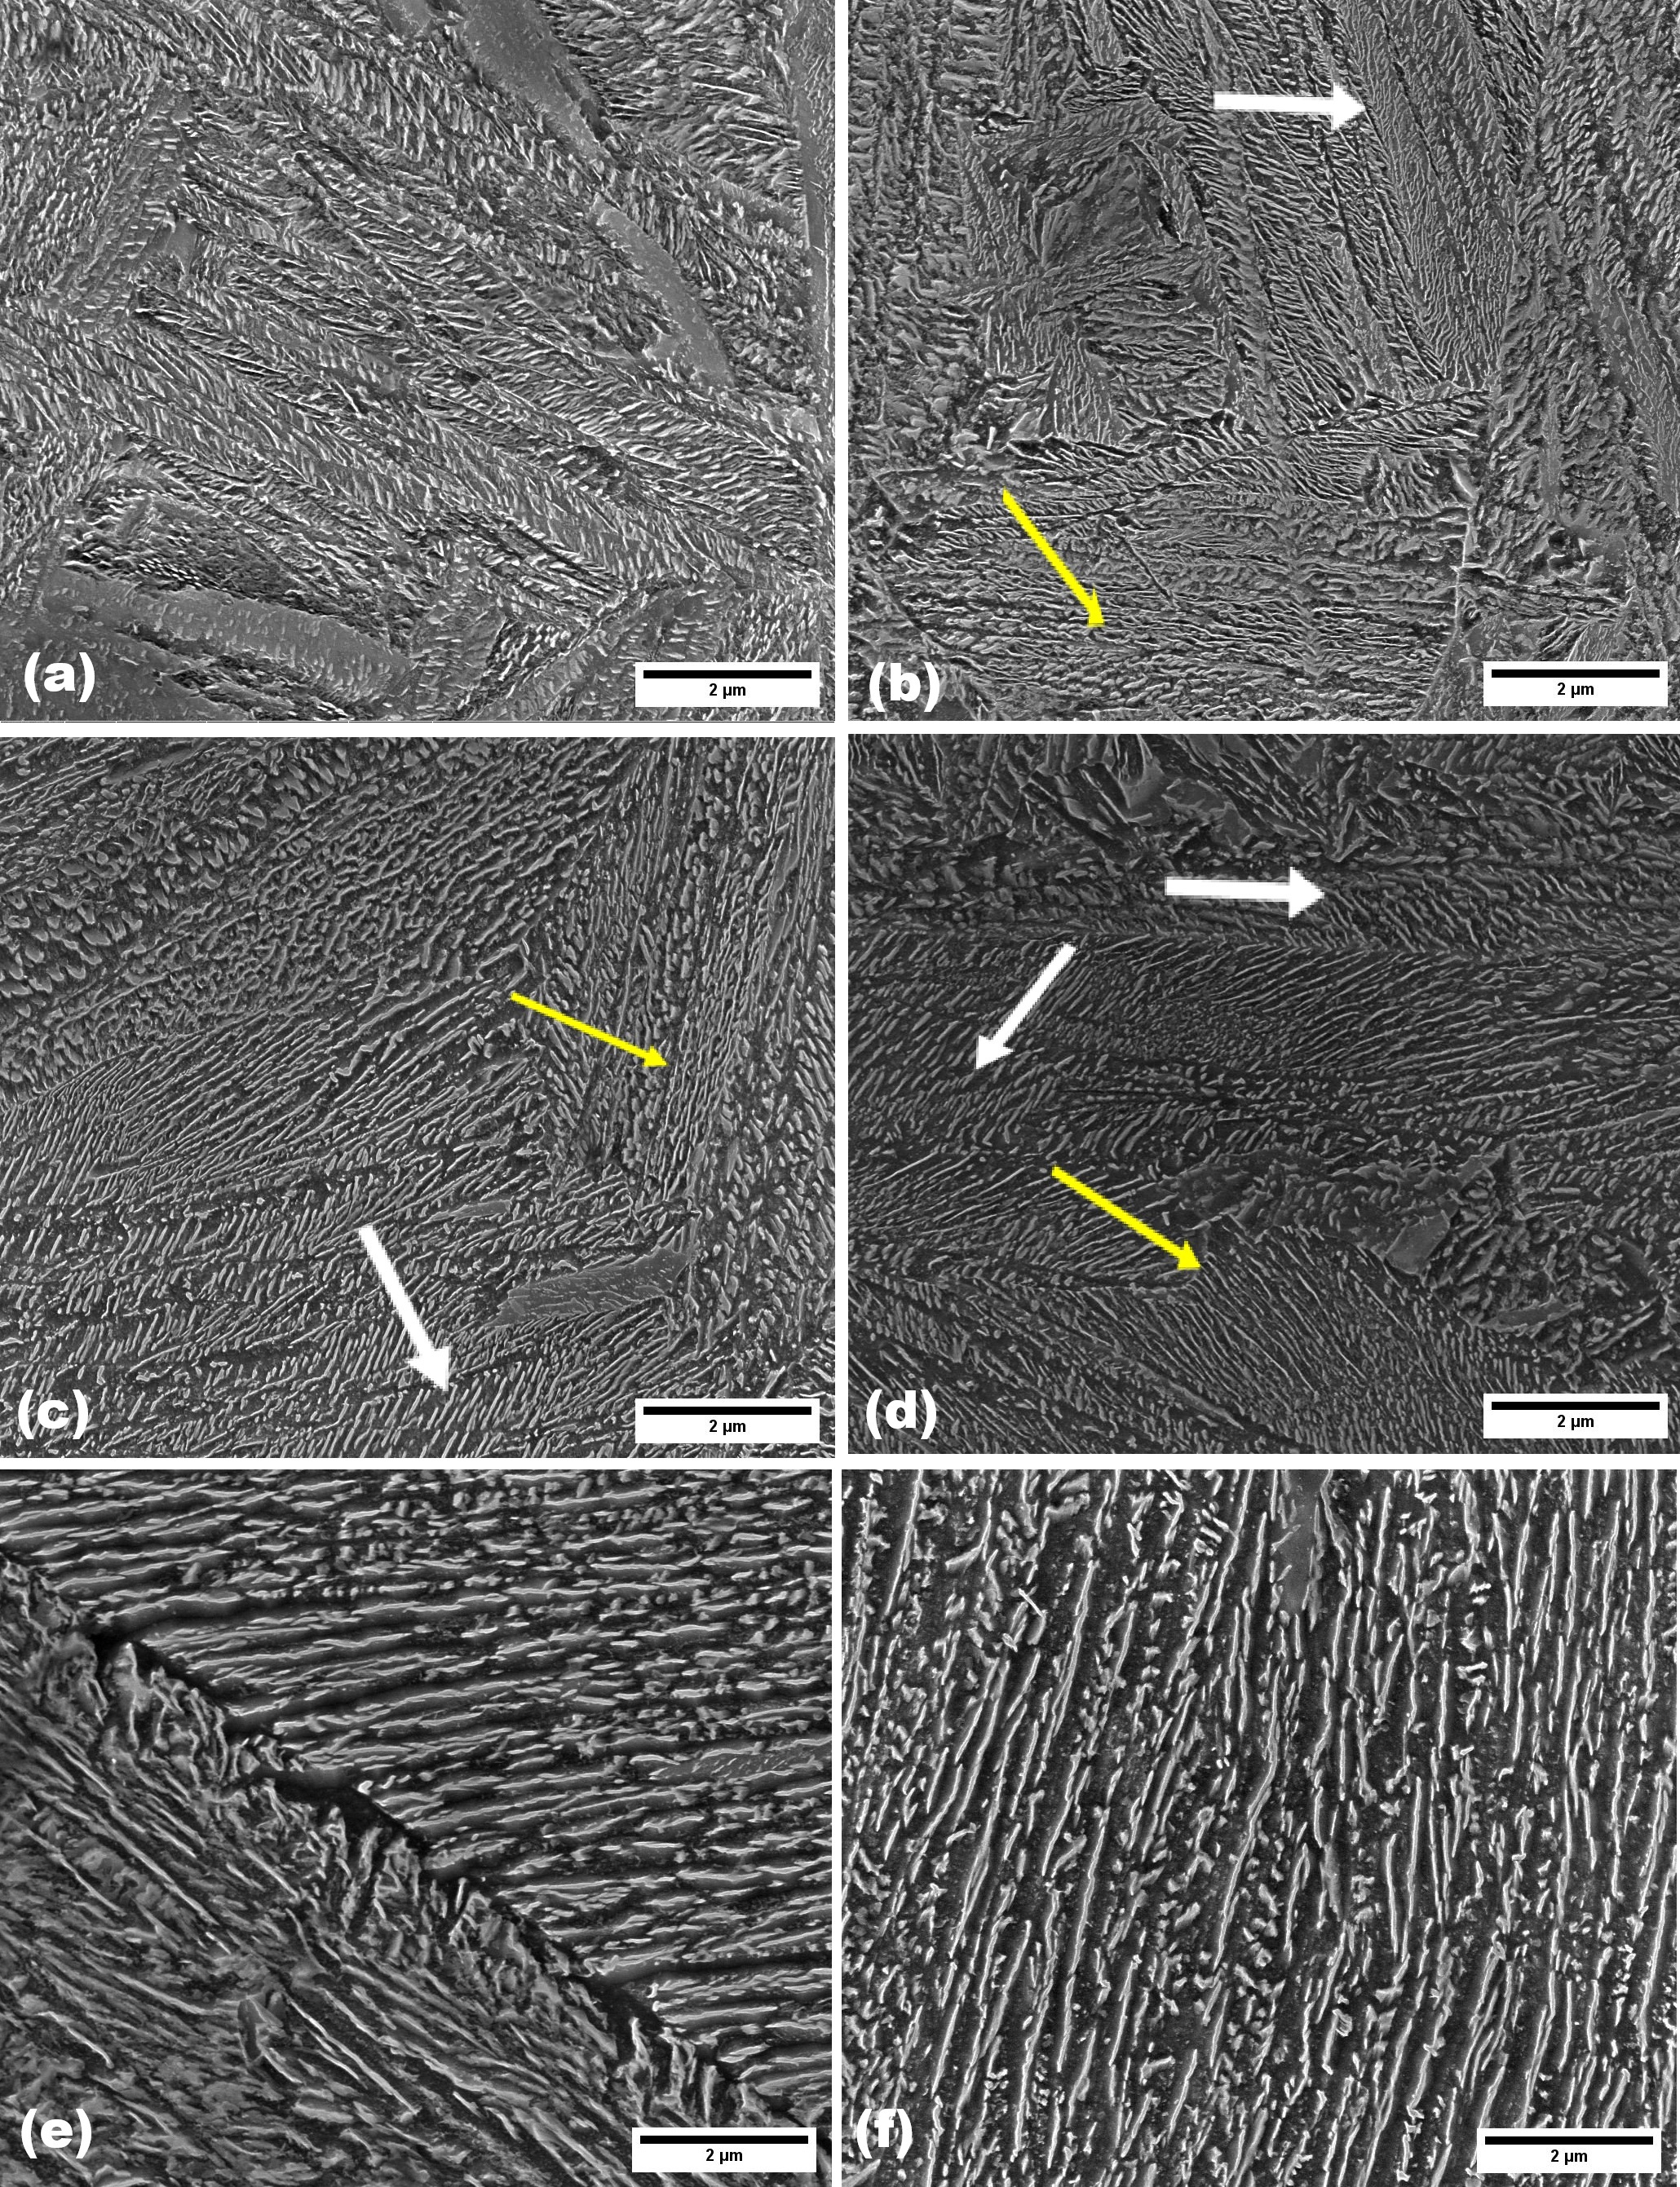
Figures 6a to 6f display the microstructures obtained during austempering at 275°C, 310°C, 335°C, 350°C, 370°C and 400°C, respectively. They all have the same magnification. It is evident that upper bainite is much coarser.
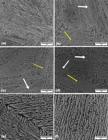
Upper to lower bainite morphology transition. Images from a to f concern respectively to the following austempering temperatures: 275°C, 310°C, 335°C, 350°C, 370°C and 400°C. White arrows indicate lower bainite. Yellow arrows indicate upper bainite. SEM-FEG. Nital 2%.
A transition of morphological features is seen. At 400°C and 370°C upper bainite occurs. This morphology presents continuous carbides, which are precipitated between the bainitic ferrite units and roughly parallel to the bainitic ferrite lath habit planes2,3,20,21.
Once LBs is achieved the fraction of lower bainite increases with increasing undercooling in the transitional interval. It presents bainitic ferrite plates with carbide particles embedded inside them at inclined angles relative to the plate axis. This angle is circa 55° relative to the plate axis3,20,21.
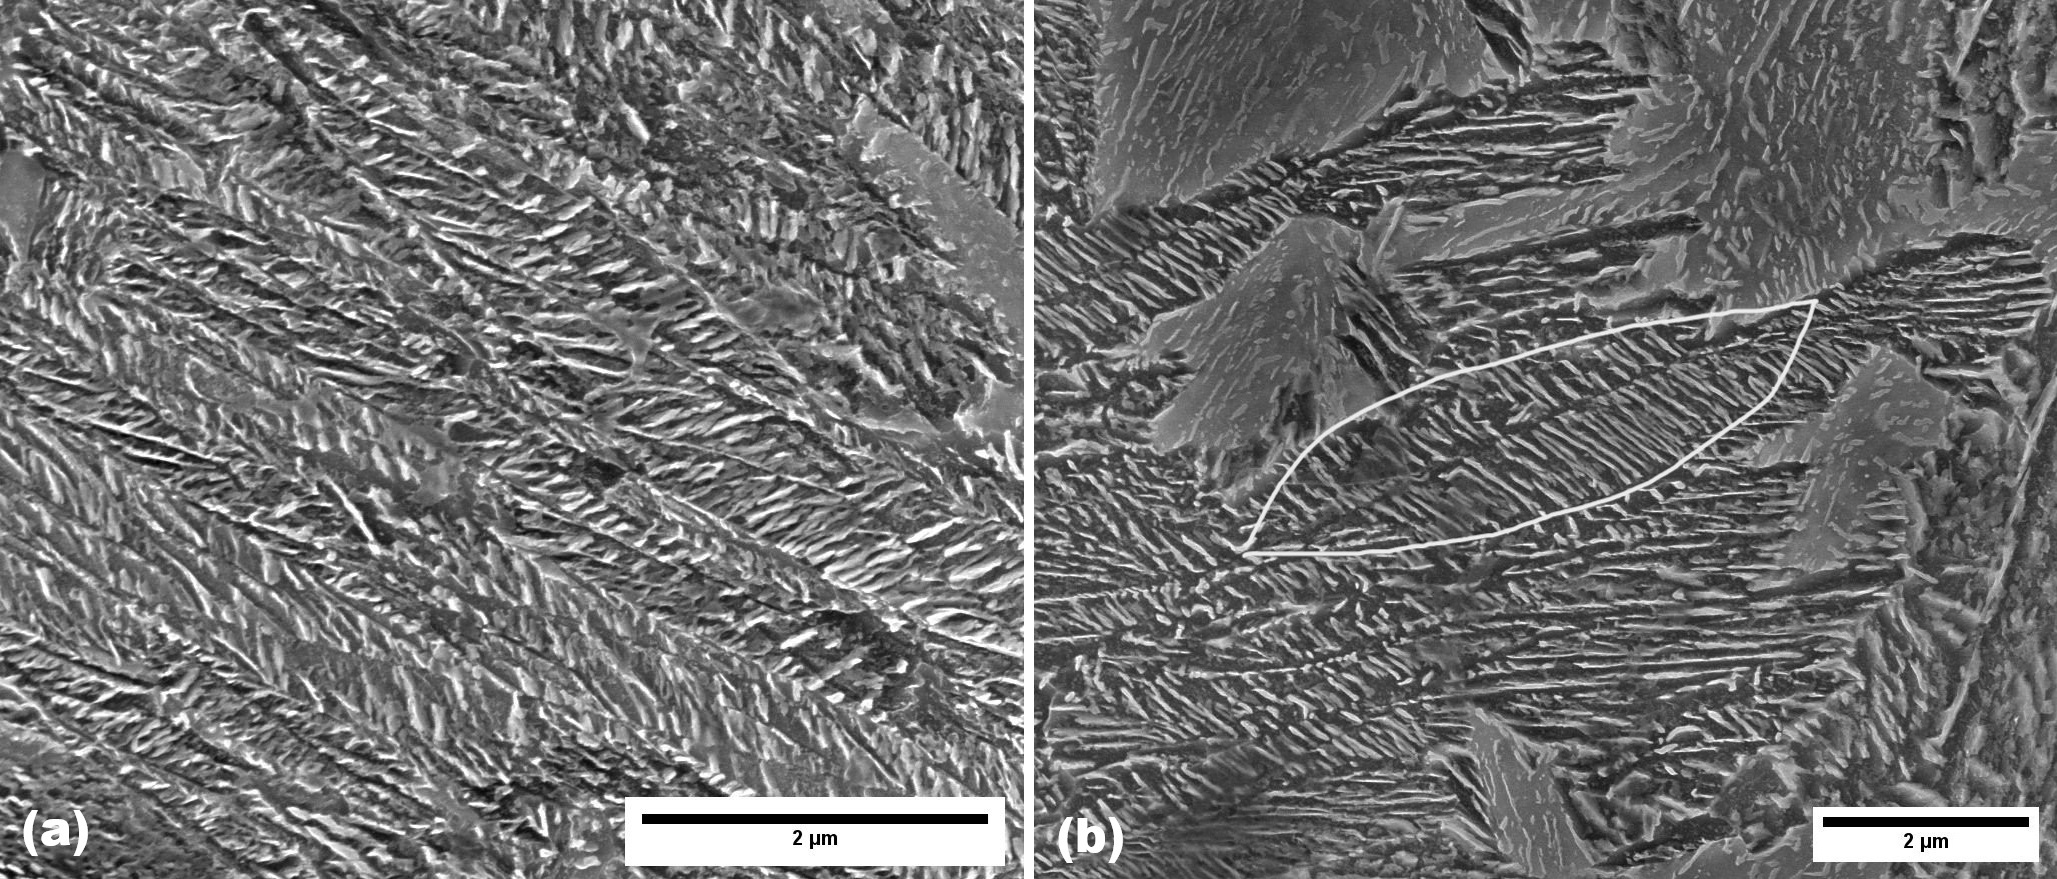
At 350°C and 335°C, upper bainite (yellow arrows) and lower bainite (white arrows) occur simultaneously. Eventually, lower bainite becomes the only microconstituent. At 275°C, the microstructure is formed only by lower bainite. Figure 7a presents the bainitic microstructure at 275°C with a higher magnification. Figure 7b shows a plate of lower bainite coexisting in a matrix of upper bainite at 370°C.

a) Lower bainite formed at 275°C. The image displays carbides inclined relative to the sheaf axis characteristic of lower bainite. SEM-FEG. Nital 2%. b) Lower bainite plate in an upper bainite matrix. 370°C.
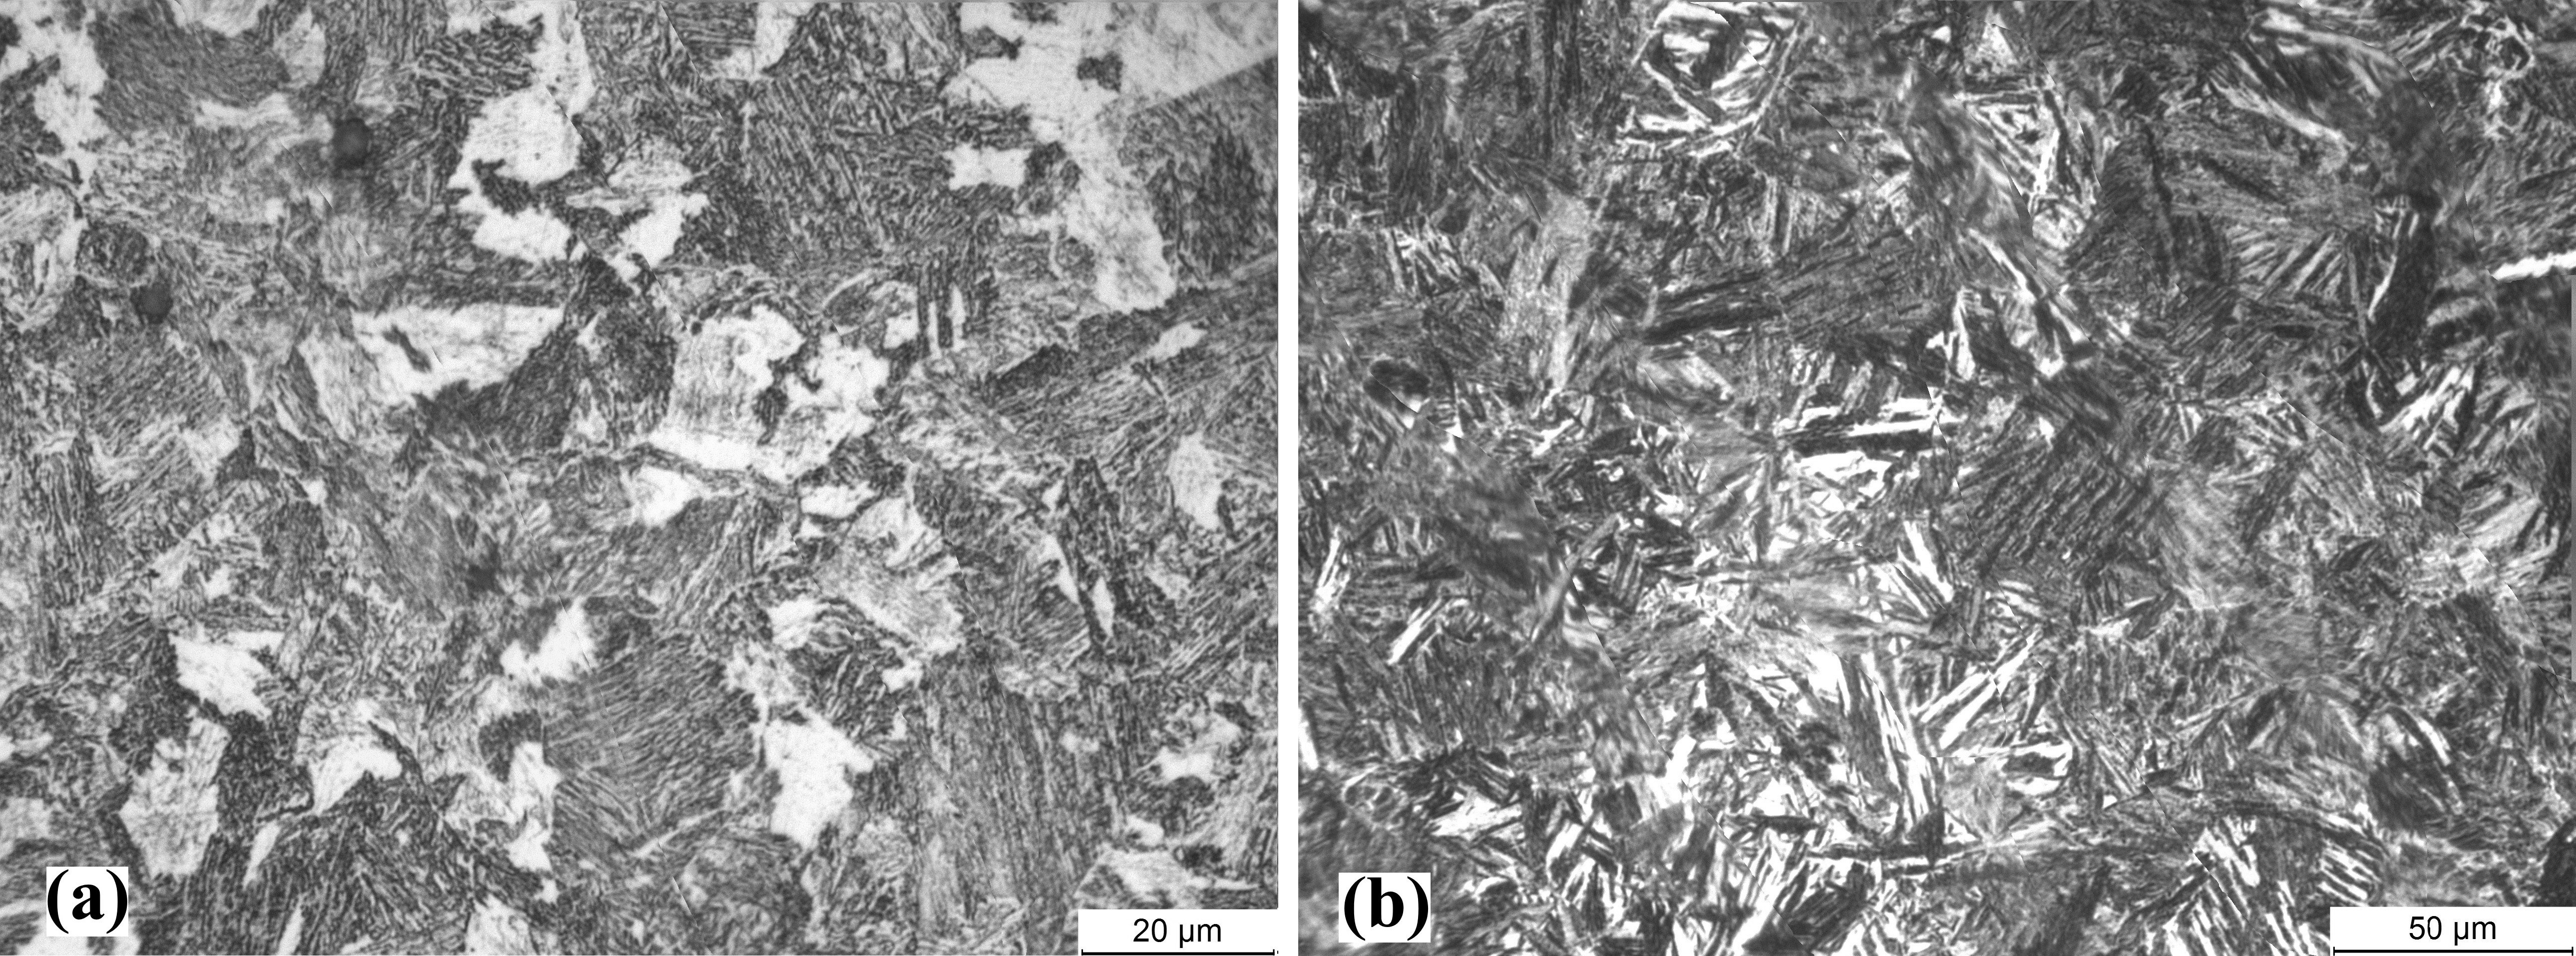
Figures 8a and 8b depict, respectively, upper and lower bainite microstructures observed with the optical microscope. In upper bainite, the ferritic bainite units are organized mainly in sheaves. On the other hand, in lower bainite the sheave-like grouping is less common, while a plate-like microstructure, resembling high-carbon martensite, is more evident.
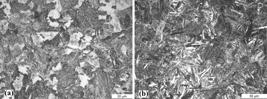
Bainite microstructures seen at the optical microscope. a) upper bainite austempered at 400°C and b) lower bainite austempered at 275°C. Optical microscope. Nital 2%.
3.3. Microhardness and dislocation density profiles
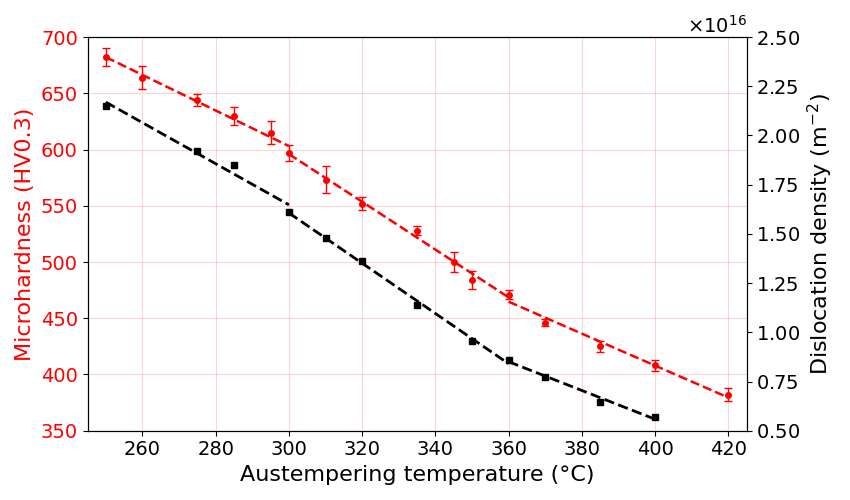
Figure 9 illustrates how microhardness (HV0.3, in red) and dislocation density (in black) change with austempering temperature in the upper-to-lower bainite transitional range. Both decrease with increasing austempering temperature in a clearly coupled behaviour. The dislocation densities presented in Figure 9, in the order of , are comparable with the values reported in the literature for bainite microstructures2,14.
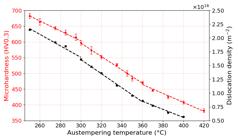
Microhardness (red curve) and dislocation density (black curve) profiles as a function of austempering temperature. Three trends are seen: From 250°C to around 300°C, from 300°C to approximately 350°C and finally from 350°C up to 420°C.
Furthermore, a visual inspection of Figure 9 reveals the existence of three distinct trends. To give it a statistical background, best-fit lines for each region and for the total range were compared, and the results are shown in Table 3. The segmented model showed significantly lower residual sum of squares (RSS) and higher R2 values, confirming that this approach better captures the behaviour of the data.
4. Discussion
4.1. A general view: austempering temperature, microstructure refinement, dislocation density and autocatalysis
Different hardening mechanisms are present for bainite2,22,23: solid solution strengthening, dislocation strengthening, grain boundary strengthening, and precipitation strengthening2,22,23. Nevertheless, these hardening mechanisms are interconnected, hard to decipher individually, and some relationships can even be misleading3.
Dislocation strengthening is considered a fundamental hardening mechanism in bainite22. However, in the same way that an aligned trend of dislocation density and microhardness (Figure 9) occurs, a Hall–Petch relationship between packet size and hardness is expected3. Nevertheless, neither the packet size nor the prior austenite grain size is considered of relevant importance to bainite’s strength3. Ultimately, according to Bhadeshia3, the major microstructural contribution to bainite’s strength comes from its sub-unit size, which decreases with decreasing austempering temperature3. However, these features are distinguishable only by transmission electron microscopy2,8.
An empirical trend of decreasing subunit size and increasing dislocation density with decreasing austempering temperature exists3,22. It is consensual that: (i) as the austempering temperature decreases and the driving force for ferrite nucleation increases3,12,24, the critical nuclei size and its related activation energy barrier decrease12,25; (ii) the α/γ interface motion becomes more restricted; (iii) the density of defects increases3.
The synergistic action of the abovementioned phenomena enhances the autocatalytic effect with decreasing austempering temperature, which leads to further microstructural refinement3,8. It all occurs in a series of interconnected factors that form a closed loop, each phenomenon driving the next in a complex interplay of factors3,8,24.
4.2. Upper to lower bainite transition
Figure 5 presents the Arrhenius plot for this steel. It has three regions. The comparison with Figure 6 indicates that at higher temperatures upper bainite exists, while at lower temperatures, lower bainite occurs. A transitional region exists, from approximately 350°C to 300 °C, where both morphologies coexist.
The point at 350 °C represents the lower bainite start temperature, LBs. Above it, upper bainite is thermodynamically favoured2-8,21,24. Upper bainite nucleation is described as a “face-to-face sympathetic process”. In this case, new ferrite units nucleate in direct contact with the side of a pre-existing lath. This leads to groups of parallel laths forming packets or feathery structures3,12,21 (Figure 8a). Nevertheless, sporadic and negligible occurrences of lower bainite can be spotted above LBs in a matrix of upper bainite due to thermodynamic fluctuations (Figure 7b)21.
LBs represents a point at which the driving force for ferrite nucleation overcomes the work of formation of a unit of lower bainite, triggering its occurrence. Its activation energy (different from overall apparent activation energy) barrier is higher due to its diverse nucleation mechanism. Lower bainite nucleates by an “edge-to-face” sympathetic mechanism, resulting in a more distinct plate-like or needle-like morphology (Figure 8b)24,25.
The onset of lower bainite morphology intensifies the microstructural refinement and the autocatalysis. This justifies the abrupt change in overall transformation kinetics seen in Figure 5, as it is governed by a balance between the nucleation rate and the average size of bainitic units8.
The values of apparent overall activation energy reported in Table 2 are effective in indicating the transitional intervals between upper and lower bainite. However, it is not possible to connect the changes in apparent activation energies to any specific phenomenon such as transformation mechanism (diffusional or displacive), carbide nature, or bainitic ferrite morphology. In fact, the apparent activation energy as computed does not have a physical meaning8.
With the insertion of plate-like ferritic bainite, the variant pairings change, and a higher density of high-angle boundaries between the sheaves follows3,26. As the bainite subunits are much more refined, the density of low-angle boundaries in the substructure (dislocation walls) also increases. Ultimately, the density of geometrically necessary dislocations to accommodate the transformation strains increases3. The change of slope in both the dislocation density and microhardness profiles is presented in Figure 9, where the curves become steeper around 360 °C, marking the onset of lower bainite.
Figure 6c shows the coexistence of upper and lower bainite at 335 °C. In the transitional interval, upper bainite nucleates first, being followed by lower bainite, whose volumetric fraction increases with increasing undercooling until the end of the transitional interval is reached3. Figures 5 and 9 indicate that the end of the transitional morphological interval occurs at approximately 300 °C.
Below 300 °C, the overall transformation kinetics change. Once again, such change has to take into account the interplay between complex and interdependent phenomena. Among them: the absence of upper bainite7, the variant pairing between bainitic ferrite units changes26, and the consequent change in the pattern of accommodation of the residual strains. The latter ultimately leads to the change in the slopes of the curves of dislocation density and microhardness seen at 300 °C (Figure 9).
4.3. Carbide nature
The nature of the carbides could not be assessed by HEXRD. Other techniques, such as Mössbauer spectrometry, are more fitting for this end27. Nevertheless, it is fundamental to discuss the relationship between carbide nature and the transition from upper to lower bainite. While in steels with low silicon content cementite rapidly replaces epsilon carbide above 350 °C, or below this temperature for longer times, in high-silicon steels epsilon carbide predominates below 350 °C, and carbide-free bainite may occur above this temperature. The presence of high levels of silicon kinetically inhibits the precipitation of cementite. It is suggested that in high-silicon steels a metastable γ ⇌ α + ε carbide equilibrium field exists up to approximately 350 °C3,12.
5. Conclusions
Based on the discussions previously presented, the following conclusions were made:
-
The existing interplay between bainite morphology, microstructural features, austempering temperature, global transformation kinetics, and microhardness allows the use of different techniques to determine the transitional interval;
-
Even though the transition from upper to lower bainite is continuous, noticeable changes occur at the extremes of the transitional interval. The LBs was identified around 350 °C, and the lower temperature limit of the transitional interval is around 300 °C;
-
The carbide nature could not be determined with the techniques used;
-
Changes in the microhardness and the dislocation density profiles as a function of austempering temperature occurred in a coupled manner, indicating an intimate correlation between the parameters;
-
Lower bainite can occur locally above the LBs temperature. Even though the techniques used to quantify the volumetric properties are not sensitive to its presence, it can still be identified using high-magnification techniques such as SEM-FEG.
6. Acknowledgements
The authors would like to thank the LTF, LabMicro and the Multiuser analytical centre (IPEN). Experiments at Desy were conducted under the Proposal I-20240804. The authors acknowledge the financial support provided by CAPES (process number: 88887.461595/2019-00).
Data Availability
7. References
-
1 Zhao JC, Notis MR. Continuous cooling transformation kinetics versus isothermal transformation kinetics of steels: a phenomenological rationalization of experimental observations. Mater Sci Eng Rep. 1995;15(4–5):135-207. https://doi.org/10.1016/0927-796X(95)00183-2
» https://doi.org/10.1016/0927-796X(95)00183-2 - 2 Bhadeshia HKDH, Honeycombe RWK. Steels: microstructure and properties. 3rd ed. Oxford: Butterworth-Heinemann; 2006.
-
3 Bhadeshia HKDH. Bainite in steels: theory and practice. 3rd ed. London: CRC Press; 2015. https://doi.org/10.1201/9781315096674
» https://doi.org/10.1201/9781315096674 - 4 Krauss G. Steels: processing, structure, and performance. Materials Park (OH): ASM International; 2005. ISBN: 9780871708175.
-
5 Oka M, Okamoto H. Variation of transition temperatures from upper to lower bainites in plain carbon steels. J Phys IV. 1995;5(C8):503-8. https://doi.org/10.1051/jp4:1995877
» https://doi.org/10.1051/jp4:1995877 - 6 Goodnow RH, Matas SJ, Hehemann RF. Growth kinetics and the mechanism of the bainite transformation. Trans TMS AIME. 1963;227:651-8.
-
7 Fang L, Wood WE, Atteridge DG. Identification and range quantification of steel transformation products by transformation kinetics. Metall Mater Trans, A Phys Metall Mater Sci. 1997;28(1):5-14. https://doi.org/10.1007/s11661-997-0078-6
» https://doi.org/10.1007/s11661-997-0078-6 -
8 dos Santos Avila D. Bainite formation in the presence of martensite [thesis]. Delft: Delft University of Technology; 2025. https://doi.org/10.4233/uuid:434a7a7e-2136-4f0b-a932-66c0db5bb1fa
» https://doi.org/10.4233/uuid:434a7a7e-2136-4f0b-a932-66c0db5bb1fa -
9 Van Bohemen SMC, Santofimia MJ, Sietsma J. Experimental evidence for bainite formation below Ms in Fe–0.66C. Scr Mater. 2008;58(6):488-91. https://doi.org/10.1016/j.scriptamat.2007.10.045
» https://doi.org/10.1016/j.scriptamat.2007.10.045 -
10 Ławrynowicz Z. Transition from upper to lower bainite in Fe–C–Cr steel. Mater Sci Technol. 2004;20(11):1447-54. https://doi.org/10.1179/026708304X3953
» https://doi.org/10.1179/026708304X3953 -
11 Yang Z, Xu W, Yang Z, Zhang C, Chen H, van der Zwaag S. Predicting the transition between upper and lower bainite via a gibbs energy balance approach. J Mater Sci Technol. 2017;33(12):1513-21. https://doi.org/10.1016/j.jmst.2016.11.028
» https://doi.org/10.1016/j.jmst.2016.11.028 -
12 Hehemann RF, Kinsman KR, Aaronson HI. A debate on the bainite reaction. Metall Trans. 1972;3(5):1077-94. https://doi.org/10.1007/BF02642439
» https://doi.org/10.1007/BF02642439 -
13 García de Andrés C. Application of dilatometric analysis to the study of solid–solid phase transformations in steels. Mater Charact. 2002;48(1):101-11. https://doi.org/10.1016/S1044-5803(02)00259-0
» https://doi.org/10.1016/S1044-5803(02)00259-0 -
14 Ståhlkrantz A, Hedström P, Sarius N, Sundberg HÅ, Kahl S, Thuvander M, et al. Effect of tempering on the bainitic microstructure evolution correlated with the hardness in a low-alloy medium-carbon steel. Metall Mater Trans, A Phys Metall Mater Sci. 2020;51(12):6470-81. https://doi.org/10.1007/s11661-020-06030-6
» https://doi.org/10.1007/s11661-020-06030-6 -
15 Williamson GK, Hall WH. X-ray line broadening from filed aluminium and wolfram. Acta Metall. 1953;1(1):22-31. https://doi.org/10.1016/0001-6160(53)90006-6
» https://doi.org/10.1016/0001-6160(53)90006-6 -
16 Williamson GK, Smallman RE. III. Dislocation densities in some annealed and cold-worked metals from measurements on the X-ray debye-scherrer spectrum. Philos Mag. 1956;1(1):34-46. https://doi.org/10.1080/14786435608238074
» https://doi.org/10.1080/14786435608238074 -
17 Gubicza J. Reliability and interpretation of the microstructural parameters determined by X-ray line profile analysis for nanostructured materials. Eur Phys J Spec Top. 2022;231(24):4153-65. https://doi.org/10.1140/epjs/s11734-022-00572-z
» https://doi.org/10.1140/epjs/s11734-022-00572-z -
18 Borgenstam A, Hillert M. Kinetics of bainite transformation in steels. In: Pereloma E, Edmonds DV, editors. Phase transformations in steels. Sawston: Woodhead Publishing; 2012. p. 468–501. https://doi.org/10.1533/9780857096104.3.468
» https://doi.org/10.1533/9780857096104.3.468 -
19 Kohout J. Modified arrhenius equation in materials science, chemistry and biology. Molecules. 2021;26(23):7162. https://doi.org/10.3390/molecules26237162
» https://doi.org/10.3390/molecules26237162 -
20 Furuhara T. Carbide-containing bainite in steels. In: Pereloma E, Edmonds DV, editors. Phase transformations in steels. Sawston: Woodhead Publishing; 2012. p. 417–35. https://doi.org/10.1533/9780857096104.3.417
» https://doi.org/10.1533/9780857096104.3.417 -
21 Yin J, Hillert M, Borgenstam A. Morphology of upper and lower bainite with 0.7 Mass Pct C. Metall Mater Trans, A Phys Metall Mater Sci. 2017;48(9):4006-24. https://doi.org/10.1007/s11661-017-4208-5
» https://doi.org/10.1007/s11661-017-4208-5 -
22 Ståhlkrantz A, Hedström P, Sarius N, Borgenstam A. Influence of austempering conditions on hardness and microstructure of bainite in low-alloyed steel. Metall Mater Trans, A Phys Metall Mater Sci. 2024;55(1):209-17. https://doi.org/10.1007/s11661-023-07243-1
» https://doi.org/10.1007/s11661-023-07243-1 -
23 Deep G, Williams WM. The annealing of bainite while being concurrently deformed. Can Metall Q. 1976;15(1):9-19. https://doi.org/10.1179/cmq.1976.15.1.9
» https://doi.org/10.1179/cmq.1976.15.1.9 -
24 Spanos G, Fang HS, Sarma DS, Aaronson HI. Influence of carbon concentration and reaction temperature upon bainite morphology in Fe-C-2 Pct Mn alloys. Metall Trans, A, Phys Metall Mater Sci. 1990;21(6):1391-411. https://doi.org/10.1007/BF02672559
» https://doi.org/10.1007/BF02672559 -
25 Spanos G, Fang HS, Aaronson HI. A mechanism for the formation of lower bainite. Metall Trans, A, Phys Metall Mater Sci. 1990;21(6):1381-90. https://doi.org/10.1007/BF02672558
» https://doi.org/10.1007/BF02672558 -
26 Ståhlkrantz A, Hedström P, Sarius N, Borgenstam A. Effect of carbon content on variant pairing in bainitic low alloy steel. Metall Mater Trans, A Phys Metall Mater Sci. 2022;53(9):3418-27. https://doi.org/10.1007/s11661-022-06757-4
» https://doi.org/10.1007/s11661-022-06757-4 -
27 Pierce DT, Coughlin DR, Williamson DL, Clarke KD, Clarke AJ, Speer JG, et al. Characterization of transition carbides in quench and partitioned steel microstructures by Mössbauer spectroscopy and complementary techniques. Acta Mater. 2015;90:417-30. https://doi.org/10.1016/j.actamat.2015.01.024
» https://doi.org/10.1016/j.actamat.2015.01.024