
 Damage behavior and assessment of hollow masonry walls reinforced with polyurea coating under explosive loading
Abstract
As one of the new protection technologies in the field of anti-explosion protection of masonry walls, polyurea spraying has attracted wide attention of researchers. This paper established a refined numerical model to predict the dynamic response of unreinforced hollow masonry walls (UWs) and polyurea-reinforced hollow masonry walls (PWs) under blast loading. The numerical simulation results were in good agreement with the reference test results. The progressive failure process of UWs and PWs under blast load was clarified by numerical simulation and failure theory model of wall. According to a series of numerical simulation results, the dimensionless damage parameters (maximum deflection rate and mass loss rate) of the wall were defined, the comprehensive influence of polyurea coating method and blast scaled distance on the damage degree of the wall was summarized, and the damage mode retrieval diagram of polyurea reinforced hollow masonry wall under blast load was established. The results showed that the existence of polyurea coating can provide reliable protection for the wall without catastrophic damage when the blast scaled distance was not less than 1.47 m/kg1/3. The research results of this paper can provide an engineering reference for the polyurea reinforcement of hollow masonry walls.
Keywords:
Blast load; Numerical modeling; Hollow masonry wall; Polyurea coating; Damage evaluation

1 INTRODUCTION
Masonry walls are commonly used components in building structures, with extremely weak bending resistance. Under the action of explosive loads, they are prone to collapse and produce fragments, posing a fatal threat to effectives within. In recent years, there have been numerous explosive incidents caused by terrorist attacks or sudden accidents, and improving the blast resistance of masonry walls to prevent damage or overall collapse has become a key focus of current research.
Many explorations have been carried out on the dynamic response behavior of masonry walls under explosion load. Wei and Stewart (2010) used a combination of experimental and numerical analysis to reveal that boundary constraints and wall thickness are key parameters affecting the explosion response of masonry walls, while material strength parameters have a relatively limited impact on the overall anti-explosion performance; Zhang et al. (2023a) conducted a parametric numerical simulation study on the response and damage of masonry walls under blast loading, and the results showed that the boundary constraint mode and the wall plane size ( aspect ratio ) significantly affect the structural resistance, but the boundary construction form ( such as Plain/Groove ) effect is not obvious; Abou-Zeid et al. (2011a) tested the reinforcement effect of arch structure on the anti-explosion performance of masonry wall through the explosion experiment of full-scale masonry wall, and found that the out-of-plane anti-explosion performance of arch wall was significantly enhanced. It is worth noting that (Chiquito et al. 2021, Li et al. 2017a) used LS-DYNA software to simulate the dynamic response of a single-span masonry wall under different blast loads. The results showed that the wall first formed a plastic hinge in the mid-span area and then failed with the increase of the peak value of the blast load, it showed a progressive failure to the two ends. The above research results showed that most studies usually do not consider accidental explosions in the design stage. When this kind of structure was subjected to explosion impact, the flexural capacity of the wall was significantly lower than the stress generated by the explosion load, and the interface between the block and the mortar was the weak part of the structure (Zhang et al. 2008). Therefore, the damage often extended outward along the weak side to the entire wall structure, causing catastrophic events such as collapse. Therefore, the problem of anti-explosion reinforcement has become a research hotspot. At present, many methods of strengthening the wall have been proposed, such as implanting studs in the wall (Abou-Zeid et al. 2011b), steel bars (Hoemann et al. 2015, Shishegaran et al. 2020), or adding metal honeycomb panels (Zehtab and Salehi 2020). However, injecting reinforcement components is inadequate considering the compatibility of construction convenience and economy, especially for reinforcing existing buildings.
Polyurea elastomer is a new type of environmentally friendly material (PUA) that has emerged in the past two decades. It has the advantages of fast curing time, simple construction, strong adhesion ability, good compressive and corrosion resistance, and high stability, especially in the anti-explosion performance of masonry walls (Fang et al. 2019). Many scholars have conducted research on the blast resistance response of polyurea coated masonry walls. Hrynyk and Myers (2008) evaluated the effect of spraying polyurea on the anti-explosion performance of masonry walls, finding that spraying polyurea can significantly enhance the anti-bending moment capacity of the unreinforced masonry infill walls of the frame, resulting in a significant improvement in energy dissipation; The finite element analysis of Zhang et al. (2023b), Guo Y R and Zheng H (2013) showed that when the anchorage length of PUA coating exceeded the critical value of 150 mm, the improvement effect on the anti-explosion performance of the wall was limited, and when the coating thickness increased, the anti-explosion performance of the wall can be significantly improved; Wang et al. (2017) confirmed that the 3mm thick polyurea layer can change the damage mode of the masonry wall through the field explosion experiment, so that the collapse of the unreinforced wall was transformed into the separation of local mortar joints and the deformation and deflection of the wall, so as to prevent the collapse of the wall and the destruction of the overall structure; Tao et al. (2020) carried out anti-explosion experiments on two different types of clay bricks and concrete block walls. The results showed that spraying polyurea on the back could effectively cover the back debris caused by explosion load and reduce the deformation and displacement of the wall; Wu et al. (2022) analyzed the damage characteristics of masonry walls under different proportional distances and polyurea coating methods through full-scale polyurea coating masonry wall explosion experiments. Their critical finding revealed that masonry walls with 6mm-thick polyurea coatings applied bilaterally demonstrated remarkable blast resistance, maintaining structural integrity after sustaining two consecutive blast loads while preserving post-blast serviceability; Zhu et al. (2023,2022) analyzed the damage behavior of polyurea-coated masonry walls under close-range explosion conditions through experiments and numerical simulations, and found that polyurea layers at different positions played different roles : the front polyurea layer can reduce the stress concentration on the front surface and the back polyurea can reduce the overall deflection of the wall.
In the field of anti-explosion engineering, polyurea coating reinforcement technology has been fully validated for improving the blast resistance performance of solid masonry structures such as clay walls and concrete block walls. However, it is worth noting that there is another widely used type of masonry wall in construction engineering —— hollow block masonry wall. Compared with traditional solid blocks, hollow blocks not only retain the characteristics of solid blocks that can withstand pressure and heat insulation, but also meet the needs of lightweight masonry walls and greatly improve the seismic resistance of walls. Due to the unique hollow structure characteristics of hollow block, its dynamic response and damage characteristics under explosion load are different from those of solid block. While the blast resistance mechanism and protective effectiveness of hollow block masonry wall after polyurea reinforcement have not been systematically studied. It is urgent to carry out relevant experiments and numerical simulation to analyze the anti-explosion performance of polyurea coated hollow block wall.
In view of this, this paper conducts exploratory research on the anti-explosion performance of polyurea-coated hollow block walls. Firstly, a numerical model matching the field test was established by using LS-DYNA software. The numerical simulation was used to make up for the deficiency of the test measurement method, and the accuracy was verified by test results. Furthermore, the influence of polyurea layer thickness and coating method on the damage deformation of masonry structure and the energy absorption characteristics of polyurea were analyzed. The dimensionless damage parameters (maximum deflection rate and mass loss rate) of the damaged wall were defined, then the damage mode retrieval diagram of the polyurea-reinforced hollow masonry wall under explosion load was established. This study can provide data support for improving the survival rate of hollow block walls under explosive shock loading, and for the design of high-strength and high ductility polyurea sprayed masonry wall, which has important engineering application value.
2 ESTABLISHMENT AND VALIDATION OF NUMERICAL SIMULATION MODELS
2.1 Physical model
This article intends to calibrate the model using partial results from Santos et al. (2023) field experiments, as shown in Figure 1. The explosion source was a spherical TNT charge weighing 20.11 kg, which was placed on an expanded polystyrene support with the charge center 1 meter above the ground. The distance from the masonry wall to the center of the charge and the distance from the shock wave sensor to the charge's center were both 5.05 meters. In addition, displacement sensors and linear mechanical displacement devices (LMDDs) are installed on the back of the wall to record the maximum displacement of the wall.

The unreinforced masonry wall was 1.66 meters long and 2.50 meters high, as shown in Figure 2. The masonry wall was constructed by stacking concrete masonry units (CMUs) in a staggered manner, with CMU dimensions of 400mm x 200mm x 200mm. Standard mortar was used to bond the blocks, with a joint thickness of 20mm. Finally, a 20mm thick mortar layer was applie to the surface of the masonry wall to achieve a smooth thickness, resulting in a total wall thickness of 240mm. The top and bottom of the wall were supported by HEB 300 steel beams and L-shaped steel frames respectively to prevent displacement. For clarity in the subsequent explanation, W1 in the experiment is now renamed as W0. The wall reinforced with polyurea in the experiment will be named PW0:15, and the experimental setup will be the same as W0 except for coating the back with 15mm thick polyurea. Table 1 summarized the main characteristics of the selected experiments (where Z is the explosion ratio distance, and the thickness combination is expressed as the thickness of the front polyurea layer + wall thickness + rear polyurea layer thickness).

Layout of unreinforced masonry wall: (a) W1 (Santos et al. 2023), (b) schematic of the experimental apparatus
2.2 Construction of numerical simulation mode
2.2.1 Discretization modeling strategy
The masonry wall is the main object of analysis in this article, and the precision of its modeling is related to the accuracy of the analysis conclusions. In terms of modeling strategies, D’altri et al. (2020) proposed four modeling strategies for masonry structures: (1) The block-based model takes into account the actual bonding method of the masonry structure, modeling the masonry structure block by block. The blocks can be considered either rigid or deformable, and the interaction between the masonry units can be represented using bonding equations; (2) The wall-based model, which does not differentiate between blocks and mortar, regards the masonry structure as a continuous deformable body. In this case, the material's constitutive relationship is derived using a homogenization process, which enables the model to reflect the mechanical behavior of the masonry material; (3) The partial continuum-based model treats ,the structure as a panel-level structural component. In certain aspects, it can be regarded as a continuum, but the distinction lies in that the constitutive relationship of the macro-element reflects the mechanical response of the panel-level structural component; (4) The rigid body model, based on the geometric characteristics of masonry, models the structure as a rigid body. This approach allows the simulation of limit analysis problems, such as structural equilibrium or collapse, through various computational methods.
Given that this article focuses on the damage response behavior of walls, a refined modeling process is necessary. Therefore, based on the first strategy, this article separates the modeling method of blocks and mortar. This modeling method is complex and consumes a lot of computational resources, but the model considers the physical properties and actual dimensions of mortar and masonry, which can most intuitively reflect the failure characteristics of masonry structures. Therefore, some scholars (Wu et al. 2022, Zhu et al. 2023, Zhu et al. 2022, Sielicki and Łodygowski 2019) had also adopted this method to analyze the dynamic response of masonry structures under blasting loads and have achieved good results. Figure 3 (a) was a model diagram of a hollow masonry wall (hiding the surface mortar to observe the stacking method between the CMUs clearly), and Figure 3 (b) shows the details of the stacking between the blocks. The masonry wall was composed of multiple such masonry combinations, with bricks and mortar modeled separately and both using solid elements to established a refined model.
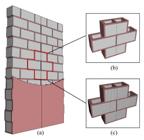
Discrete model: (a) hollow masonry wall model, (b) masonry assembly model, (c) discretized model of the masonry assembly
2.2.2 Algorithm settings, boundary conditions and contacts
Considering computation time and resources, utilizing the symmetry of the YOZ plane structure, a 1/2 model was established, as shown in Figure 4. The model consists of eight parts: (1) CMUs, (2) mortar, (3) HEB 300 steel beams, (4) L-shaped steel frame, (5) ground, (6) charge, (7) air and (8) polyurea. All elements in the numerical simulation were modeled using solid elements. In order to simulate the expansion of explosive products and the propagation of shock waves in the air during explosive detonation, the ALE algorithm is used for the charge and air, and the Lagrange algorithm was used for other parts. The interaction between fluid and solid was achieved through FSI.

TNT was defined by the keyword *INITIAL_VOLUME_FRACTION_GEOMETRY. By using the filling method to fill the charge in the air grid, it is possible to avoid calculation errors caused by changes in grid size and effectively reduce calculation time. It has been pointed out in reference (Abou-Zeid et al. 2011) that shock waves propagate and reflect along the ground, affecting the load distribution on the wall. To save computational resources, the ground was simplified as rigid and established by *RIGIDWALL_PLANAR. In addition, through the keywords *LOAD_BODY_Y and *DEFINE_CURVE, the global gravity is applied to make the numerical simulation model more realistic.
The framework at the back of the wall provides support, and existing studies have shown that adding rear support can significantly enhance the out-of-plane blast resistance of walls (Abou-Zeid et al. 2011). Moreover, no significant bending or displacement of the framework was observed before and after the experiments, so in the simulation, the steel framework can be considered as rigid. To save computational resources, only the (3) HEB 300 steel beams and (4) L-shaped steel frame in contact with the wall are established, and these two were set as rigid bodies (For the sake of clarity, the (3) HEB 300 steel beam and (4) L-shaped steel frame were collectively referred to as the support system), and fully constrained. Set the asymmetric boundary of the air domain as a nonreflective boundary to avoid errors caused by shock wave reflection. Set the nodes on the symmetry plane as symmetry constraints.
The keyword*CONTACT_AUTOMATIC_SURFACE_TO_SURFACE_TIEBREAK was defined to simulate the bonding relationship between polyurea and surface mortar. The contact settings between the other components were set by *CONTACT_AUTOMATIC_SURFACE_TO_SURFACE. It is worth noting that scholars (Santos A P et al. 2023, Zhu H et al. 2022, Sielicki and Łodygowski 2019, Li et al. 2017b) not only simulated the bond between mortar and block but also captured the expansion of cracks between them by merging the joints between mortar and block. Therefore, in this paper the bonding relationship between the block and the mortar was simulated by merging the nodes so that the stress can be transferred and acted upon.
2.2.3 Algorithm settings, boundary conditions and contacts
(1) CMUs and mortar
Both the CMUs and mortar were modeled using the MAT_096 (MAT_BRITTLE_DAMAGE) material model, which is an anisotropic brittle damage model suitable for various brittle materials and can fully reflect the failure modes of the CMUs and mortar. It gradually weakens the tensile and shear strength of the structure by generating distributed cracks under tensile loads. The tensile and shear damage parts of the material model were fully described by Govindjee, Kay, and Simo (1995).
In this model, fn is the initial ultimate tensile strength (stress) of the material. Once the stress at a certain point in the structure reaches this value, a normal line that is collinear with the direction of the principal stress will be generated at that point, forming a crack. This crack will continue to expand with the movement of the structure. As the loading progresses, the allowable tensile force perpendicular to the crack surface gradually decreases to a smaller constant. This is achieved by reducing the material modulus perpendicular to the crack surface. The limiting condition for normal tensile force is given by the following equation (Livermore Software Technology Corporation 2015):
In the equation, n represents the crack normal, ε is a constant, H is the failure modulus, and α is an internal variable. The value of H is automatically set by the software, and α measures the crack field strength, outputting in the equivalent plastic strain field 𝜀̅𝑝. στ denotes the shear limit strength transmitted across the crack surface. The shear constraint conditions, defined through two orthogonal shear damage planes, are given by the following equation:
Shear failure is coupled with tensile failure through the internal variable α which measures the crack field strength. τ represents the shear retention factor. Shear failure is introduced by reducing the material’s shear stiffness parallel to the crack surface.
The compressive strength, tensile strength, and Young's modulus of blocks and mortar were sourced from reference (Santos et al. 2023), while other material parameters are referenced from reference (Aghdamy et al. 2013). The relevant parameters of the model were shown in Table 2.
(2) Explosive charge and air
The TNT charge was modeled using the MAT_008 (MAT_HIGH_EXPLOSIVE_BURN) material model, which describes the pressure–volume relationships among the detonation products using the JWL equation of state (Zhu et al. 2022). The unit pressure P, of the detonation products was obtained from the equation of state, and the keyword used to define the JWL equation of state was * EOS_JWL. The P–V relationship of the JWL equation of state is presented in Eq. (3):
where PCJ represents the explosion pressure, A1, B1, R1, R2, and ω are all explosion parameters, V denotes the relative volume of the explosive, and e0 is the initial internal energy per unit volume. The material parameters are listed in Table 3.
The air material was defined using the keyword *MAT_009 (MATNULL) (Wu et al. 2022a). The state equation for air was expressed by a multilinear polynomial, and its pressure was defined by the relationship in Eq. (4):
In Eq. (4), C0, C1, C2, C3, C4, C5, and C6 are constants, μ represents the relative volume, and e0 denotes the internal energy per unit volume. In this study, C1 = C2 = C3 = C6 = 0, C4 = C5 = γ - 1, and γ = 1.4 (where γ is the specific heat coefficient). The air density was set as 1.29 kg/m3.
(3) Polyurea
This study employs the System A polyurea material system developed by the research team (Santos et al. 2023); this material has demonstrated a good blast-resistance performance of the wall. The stress–strain curve obtained from mechanical performance experiments, as shown in Figure 5. Under quasi-static tension loading, the mechanical performance can be divided into three stages: an elastic stage, a yield stage, and a stress-hardening stage. Considering the material characteristics of the polyurea and its strain-rate effects under explosive loading, the *MAT_PIECEWISE_LINEAR_PLASTICITY multilinear elastoplastic material model was chosen to simulate the response of the polyurea to explosive loading. This material model allows for the definition of multiple stress–strain curves, which enables the simulation of the nonlinear stress–strain relationship as the polyurea deforms. In fact, this material model had been fully validated in previous studies (Wu et al. 2022, Zhu et al. 2022). The basic mechanical performance parameters of the polyurea were listed in Table 4, and the relevant material parameters used in the material model were strictly consistent with those presented in the original literature (Santos et al. 2023).

2.2.4 Grid sensitivity analysis
The size of the grid is an important factor that affects simulation results. In theory, smaller grids and greater numbers of grids lead to higher simulation accuracies. However, in practical situations, when the element size continues to decrease past a certain point, the simulation accuracy changes little while the computational resource and time requirements increase significantly. Therefore, it is necessary to comprehensively consider the relationships between the simulation performance and the computational resources. Wall element sizes of 30 mm, 20 mm, and 10 mm were simulated in a grid sensitivity analysis to determine the optimal element size, as shown in Figure 6.

Figure 7 depicted Von Mises stress propagation diagrams for the masonry wall surfaces with different element sizes at the same time. It can be observed that, when smaller elements were used, the edges of the stress peaks and stress waves were clearly visible. When larger elements were used, the differences between the stresses of adjacent elements could not be clearly seen. If there were no clear stress propagation boundaries, additional element failures can easily be produced, and the crack propagation in the wall cannot be accurately captured. In this study, when the element size was 20 mm, the stress propagation in the wall surface was relatively clear and the stress propagation boundaries were obvious; thus, the wall responses to explosive loading could be studied at this element scale.

Elements at the same position at the top of the wall were selected, and their effective stress–time curves were extracted. These curves are presented in Figure 8, which shows that changes in the element size caused different stress results to be generated. When the element size was reduced from 30 to 20 mm, the maximum stress increased by 40.1%. Thus, the 30 mm element size had a weakening effect on the stress-wave transmission, and some energy was consumed in the cross-grid transmission. When the element size was reduced from 20 mm to 10 mm, the maximum stress increased by only 1.6%. This result indicates that an element size of 20 mm could meet the requirements of this study. The number of elements and the calculation times associated with the different element sizes for the mortar were compared shown in Table 5.

Comparisons between the effective stresses for different element sizes at the same position
Table 5 showed that, when the element size was reduced from 30 mm to 20 mm, the total number of elements in the masonry wall increased by 230% and the calculation time increased by 170%. When the element size was reduced from 20 mm to 10 mm, the total number of elements in the masonry wall increased by 700% and the calculation time increased by 586%. At this point, the calculation cost was no longer acceptable. Therefore, an element size of 20 mm was used to describe the masonry wall; this element size enabled the model to account for both the accuracy and efficiency of the calculations.
In the ALE method, the Lagrangian grid overlaps with the Euler grid, and the accuracy of the shock wave propagation and reflection results depends upon the fluid element size. In reference (Wu et al. 2022b), the explosion resistance of concrete slabs reinforced with polyurea to a near-field explosion load of 4 kg of TNT was simulated with a fluid element size of 25 mm. The results indicated that the expansion of the detonation products and the transmission of the shock waves could be clearly observed in the grid; thus, the expected effect was achieved. Given that the explosion investigated during this study was a far-field explosion and the basic principle that the ALE grid elements must not be smaller than the Lagrangian grid elements, the fluid element size was set to 25 mm.
2.3 Verification of the simulation results
Visually comparing simulation results with experimental results is an effective means of verifying the accuracy of numerical simulation results. In this study, experimental results were selected from the report published by Santos et al. (2023) and used as a benchmark for the numerical validation. Results for specific hollow masonry walls (i.e., W0 and PW0:15) were selected from the report and used as references to demonstrate the reliability of the numerical simulations.
2.3.1 Unreinforced masonry wall
The comparation of the experimental results with the simulation results was shown in Figure 9. According to Figure 9(a), the unreinforced masonry wall completely collapsed. Except for a small portion of the CMU material that fell and broke into small pieces due to gravity, most of the CMU material remained in block form. The failure mode of the wall could be inferred based on the dispersion degree of CMUs, which was determined by observation of the distributions of the different colors of paint sprayed on the back surface of the wall prior to testing. The debris from Zone I dispersed entirely toward the front of the blast-facing surface, and its fragments were positioned relatively forward. The debris from Zone II was located behind Zone I and mostly covered that from Zones III and IV. Due to the constraints of the ground and the support system, most of the CMU material from Zone IV remained in its original position except for the portions which had broken. Because of limitations in the camera angles, the exact position of the material from Zone III could not be determined from the images; however, the fracture points at both of its ends indicated that most of this material was likely located on the back side of the wall. The numerical simulation results shown in Figure 9(b) also indicated that the masonry wall fractured into four regions. The collapse trend was highly consistent with that which occurred during the experiments; thus, the failure mode of the unreinforced masonry wall was accurately predicted.
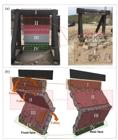
Comparison between experimental results and simulation results:(a) experimental results, (b) simulation results
2.3.2 Polyurea-reinforced masonry wall
The degree of damage that a wall sustains is a key point that deserves attention. The effective strain is a type of strain information that is calculated from the tensors, and it can be used to determine the damage behavior of a wall.
The comparation of the experimental results with the simulation results for PW0:15 was shown in Figure 9. The numerical results shown in Figure 10(b) indicated that the damage areas were concentrated in the upper third and lower third of the wall; they were specifically manifested in the fracture locations where the wall cracks propagated. The experimental results shown in Figure 10(a) were highly consistent with these results.

Comparison of the experimental and simulation results for the PW0:15: (a) blast-facing surface after the experiment, (b) effective strain obtained from the numerical model.
The overall horizontal displacement of the masonry wall reinforced with polyurea varied with time, as shown in Figure 11(a), where it can be clearly seen that the displacement changes were concentrated in the center of the wall, and that cracks grew as the displacement increased. Figure 11(b) shown the time-history curve of the wall deflection variations. This figure showed that the maximum deflection of the wall was 4.15 cm, which is 8.4% greater than the 3.8 cm recorded by reference (Santos et al. 2023). This was an acceptable difference. Figure 11(c) presented velocity–time information that was extracted at the same position. It clearly shown the self-oscillation motion of the wall following the impact wave. It is clear that both the velocity and amplitude of the oscillation decreased with time, and that the maximum recorded velocity was 4.39 m/s.

Comparison of the dynamic response processes between numerical simulation versus and experimental analysis: (a) horizontal displacement of the wall with time, (b) wall deflection with time, (c) wall velocity with time.
The direction of crack growth in hollow masonry structures is often difficult to predict; however, the locations of cracks that have already been generated in the wall are closely related to the areas in which they have been peeled off. Figure 12(b) illustrated the crack situation in the wall after the first oscillation had ended. The position of the crack that had penetrated through the blast-facing surface was essentially consistent with the results in Figure 10(a), where the initial two horizontal shear cracks were caused by the shear action of the support system, while the remaining horizontal cracks were formed as these two initial cracks grew. The generation of vertical cracks was attributed to the stress concentrations caused by the hollow structure. Figure 12(a) presented a detailed lateral comparison between the experimental and simulation results. The vertical projections of the cracks at the upper and lower ends had predicted lengths of 0.5 and 0.57 m, respectively; these values are very near the measured values of 0.54 and 0.61 m, respectively, which were obtained from the experiments. In addition, the projections of the upper and lower cracks on the axisymmetric plane of the wall in the vertical direction had lengths of 0.44 and 0.59 m, respectively, in the simulation, as shown in Figure 12(c). Figure 12 demonstrated that a high degree of consistency existed between the simulation and experimental results. Except for the wall sections at the upper and lower ends, in which cracks penetrated but did not cause spalling, the accuracies of the material parameters and the numerical simulation algorithm were largely validated.

Comparison of local damage between numerical simulation and experimental analysis: (a) magnified comparison of a local region in the lateral direction, (b) front view, (c) symmetric surface view
3 EFFECTS OF THE POLYUREA COATING METHOD ON THE WALL BLAST RESISTANCE
The numerical simulation verification presented in Section 2 demonstrated the reliability and accuracy of the numerical simulation method and model developed in this study. Additionally, it was found that using polyurea to reinforce masonry walls can effectively reduce the risk of collapse. When a polyurea coating is applied to the back surface, harm to personnel or equipment caused by scattered wall fragments can be effectively prevented. In the second portion of the study, a polyurea coating with a thickness of only 15 mm was used on the back surface to reinforce the hollow masonry walls. However, various ways of applying polyurea coatings exist, and masonry walls reinforced with polyurea coatings that are applied using different methods often exhibit different results under the same explosive load, especially when polyurea coatings are applied on both sides. Walls coated with polyurea have demonstrated good blast-resistance characteristics and are worth studying (Zhu et al. 2022). Therefore, the optimization design of the polyurea coating method was carried out in this section and a suitable polyurea coating scheme through numerical simulation methods would be obtained.
3.1 Design principles
The validated numerical simulation method was used to optimize the polyurea coating scheme. In the extended numerical model, while holding the total thickness of the polyurea constant, polyurea layers of different thicknesses were assigned to both sides of the wall. Six extended cases were established based on the PW0:15; for these cases, the layer thickness changed in increments of 2.5 mm. Table 6 listed the characteristics of the extended numerical model (in which Z represents the blast scaled distances and the polyurea thickness distribution is equal to the sum of the thicknesses of the front and rear polyurea layers).
3.2 Damage patterns for different polyurea coating methods
The numerical simulation results for masonry walls reinforced with polyurea on a single side and the effective strains on the surfaces of the CMUs and mortar were shown in Figure 13. This figure showed that the structural damage to the back side of the PW15:0 was greater than that sustained by the PW0:15. This result may be attributed to the full-frontal coating configuration of the PW15:0, for which stress propagated and accumulated within the wall. The stress that accumulated on the back surface could not be dissipated; rather, it could only be relieved through the bending and cracking of the wall.
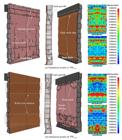
Numerical simulation results for walls with a polyurea coating on a single side: (a) PW0:15, (b) PW15:0
The comparison of the surface effective strains revealed that the damage to the front of the PW15:0 was concentrated. There may be two reasons for this result. First, the polyurea layer itself possessed good energy-absorption properties. When the front of the wall was coated with a polyurea layer that was 15 mm thick, the polyurea layer absorbed a large amount of energy when the shock wave arrived. Although this energy-absorption effect could reduce the direct damage to the interior of the wall caused by the shock wave, the energy absorption of the coating was primarily concentrated on the front side of the wall. This concentration caused the coating to experience significant stress and deformation, which led to concentrated damage on the front side of the wall. Second, while polyurea coating absorbed the shock wave, it also reflected a portion of the wave, and thereby generated secondary impacts inside the coating and between the coating and the wall surface. The superposition effect of the initial and secondary shock waves further intensified the stress concentrations on the coating surface, which led to additional damage under the front coating.
Figure 14 presented the numerical simulation results for a variety of double-sided coating cases, along with the surface effective strains of the blocks and the mortar. Under different working conditions, cracks of certain lengths were generated inside the masonry structures; this result occurred because the walls themselves were hollow structures whose interiors contained multiple discontinuous surfaces and weak points. Under the shock wave impacts, the stress concentrations at these weak points could exceed the tensile or compressive strengths of the material, thereby leading to the initiation and propagation of cracks. These stress concentrations were especially evident within the mortar of the walls because of the discontinuities in the masonry structures; thus, cracks were more likely to form within the mortar. The formation of surface cracks on the walls originated partly from the propagation of the internal cracks and partly from increases in the local stiffness values. The presence of the polyurea layers enhanced the surface stiffness to a certain extent. However, as the stiffness increased, the local deformation capacity decreased, thereby causing the surfaces of the masonry structures to be more susceptible to localized damage under strong impact loading.

Numerical simulation results for double-sided coating cases: (a) PW2.5:12.5, (b) PW5:10, (c) PW7.5:7.5, (d) PW10:5, (e) PW12.5:2.5 .
Taking the PW7.5:7.5 as an example, the crack growth process was observed, as shown in Figure 15. At t = 4.2 ms, stress concentrations caused by the hollow structure and initial shear cracks caused by the support system appeared. The cracks gradually propagated from a point near the edge of the support system to the weak surface (the interface between the blocks and the mortar). As the cracks gradually propagated, the CMUs were no longer parallel but began to form an angle. At this point, under the influence of bending moments, local stress concentrations were initiated within the wall. At t = 8.4 ms, the stress concentration in the middle of the wall was significant. When the stress exceeded to the material limit, new cracks began to appear on the wall and continued to grow. At t = 23.7 ms, the crack growth was essentially completed, and penetrating cracks appeared. At t = 44.7 ms, the penetrating crack growth was completed and inertia caused the wall to oscillate.

When the charge detonated, shock wave was generated, which acted on the wall and then decayed into a stress wave that propagated within the composite wall. This stress wave continued to propagate in the composite structure until it reached the free surface, at which point it reflected toward the wall's interior and formed a tensile wave. When the tensile wave acted on the wall, the stress state of the material changed from its original compressed state to a tensile state. When the stress borne by the material reached its limit and remained there for a certain duration, the mortar or CMUs at that location were damaged.
To observe the internal damage to the CMUs caused by stress wave propagation, four stress measurement points were selected within the damaged area inside the PW7.5:7.5. The stress changes before failure were therefore investigated. Figure 16 presents time-history curves of the stress variations in the z-direction for all the measurement points. Figure 16 indicated that each element experienced initial compression, after which failure occurred due to tensile stress. Elements #1 and #2 exhibited multiple tensile and compressive stress peaks, thereby reflecting the complex stress variations that occurred in the hollow masonry structure. Element #3 had an instantaneous maximum compressive stress of 4.36 MPa and a maximum tensile stress of 3.60 MPa, which significantly exceeded the block tensile strength of 1.45 MPa. This excessive stress led to the rapid failure of the block shortly afterward.

3.3 Blast-response characteristics for different polyurea coating methods
3.3.1 Single-sided coating methods
The process by which the stress waves propagated in a wall reinforced with polyurea on its back side was compared with that for a wall reinforced with polyurea on its front side, as shown in Figure 17(a). The front side of the PW0:15 lacked a polyurea layer; thus, the shock wave directly impacted the wall surface with almost no buffer and was transmitted straight into the wall. This process produced a large initial stress in the wall; however, the thick rear coating effectively absorbed the stress wave that was transmitted to the back of the wall, thereby significantly alleviating the stress on the rear side. However, with no front coating to reduce the initial impact, the reflections of the internal stress wave within the wall became complex, thereby causing the structure to exist in a high-stress state overall. The thick polyurea layer on the front side of the PW15:0 provided a strong initial impact-absorption capacity. However, since there was no coating on the back side, the stress wave within the wall was not further absorbed or mitigated; thus, the back of the wall was more susceptible to higher stresses.

Stress wave propagation in composite structures: (a) stress wave propagation within walls that were coated with polyurea on a single side,(b) effective stress–time curves at the same positions for the different coating methods, (c) comparison of the effective stresses on the front and back surfaces, (d) stress wave propagation within the polyurea layers.
Next, measurement points were chosen at the same positions in the mortar on the backs of the masonry walls coated on a single side. The effective stress-time curves were extracted at these points, and the effects of the different coating methods on the stress propagation were quantitatively analyzed, as shown in Figure 17(b). The figure shows that the maximum stress of the PW0:15 was 12% less than that of the PW15:0. This result indicates that the capability of a polyurea layer to relieve stress is closely related to its location.
The local effective stresses in the walls that were coated on a single side, as shown in Figure 17(c). This comparison clearly shows that the presence of a polyurea layer alleviated the stress concentrations. There are two main reasons for this phenomenon. First, due to the existence of wave impedance between the different media, the stress waves lost some energy when they propagated across the media, which thereby reduced the maximum stress. Second, part of the energy deflected by the wall was captured and converted into internal energy of the polyurea layer, which thereby reduced the internal stresses within the wall.
Figure 17(d) illustrated the propagation of the stress waves within the polyurea layer for walls coated on a single side. The shock wave formed by the explosive charge acted on the structure and then decayed into compressive stress waves that propagated into the interior of the wall. When these compressive waves reached the interfaces between different materials, reflection and transmission phenomena occurred. Some of the compressive waves were reflected in the direction opposite to that of the original wave, while the remaining compressive waves continued to propagate downward. When a compressive wave was reflected, it formed a tensile wave. Therefore, the primary types of stress waves that were present in the polyurea layers of walls for which different coating methods were employed were also different. The polyurea coating on the front side was primarily subjected to compressive stresses, while that on the back side was primarily subjected to tensile stresses.
Figure 18(a) depicted the displacement–time curves of the maximum deflection points of hollow masonry walls coated with polyurea on a single side. Since the PW15:0 was only coated with polyurea on its front side and had no polyurea layer on its backside to provide tensile stresses and thereby limit its displacement, its maximum deflection reached 5.35 cm, which is 28.92% greater than the maximum deflection of the PW0:15. This result indicates that applying a polyurea layer to the back of the wall can effectively reduce the wall deflection.
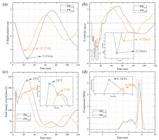
(a) Displacement–time curves, (b) velocity–time curves, (c) energy–time curves, (d) overpressure–time curves.
Figure 18(b) presented velocity-time curves that were extracted at the same positions as the curves in Figure 17(a). The waveforms of both curves are very similar, clearly showing the self-oscillation process that the wall experienced after the shock wave impacted it. It is evident that the oscillation velocity and amplitude both decreased with time. The maximum velocity of the PW15:0 reached 5.16 m/s and was 17.54% greater than that of the PW0:15. In addition, the PW15:0 reached its maximum velocity 1.2 ms earlier than the PW0:15.
Energy-time curves for the polyurea layers applied to single sides of the masonry walls were shown in Figure 18(c). The PW15:0 reached its first energy peak approximately 0.25 ms earlier than the PW0:15. This result occurred because the polyurea layer on the front surface bore the explosion load before the polyurea layer on the back surface, and it therefore absorbed the energy in the shock wave. A comparison between the maximum energy values of the polyurea layers revealed that the maximum energy of the PW15:0, which was 235 J (29.83% greater than that of the PW0:15). This difference may have occurred because the dynamic response characteristics of the polyurea material affected its energy absorption. When the shock wave acted on the front coating, the high pressure and velocity caused the polyurea's dynamic deformation and energy-absorption characteristics to have great effects.
When the explosive charge detonated, the resulting shock wave impacted the wall. A portion of the shock wave energy was not easily absorbed by the wall and thus completely penetrated the structure, which could cause damage to personnel or equipment. Therefore, the overpressure value at a point 10 cm behind the wall was used as a reference, as shown in Figure 18(d). The figure shown that the maximum overpressure values of the shock wave varied significantly with the coating method. The peak overpressure of the PW0:15 was 25% less than that of the PW15:0. This result may be attributed to the hollow structures of the CMUs, which to some extent enhanced the shock wave. However, when the shock wave had been completely transmitted through the wall, the rear polyurea coating of the PW0:15 effectively absorbed the energy of the shock wave; thus, there was a significant reduction in the overpressure.
These findings indicated that reinforcing masonry walls with rear polyurea coatings can effectively mitigate stress concentrations and reduce the deflections and maximum velocities of the masonry structures when the complex stress conditions associated with hollow masonry structures are present.
3.3.2 Double-sided coating methods
The stress-wave propagation within a wall coated with a double-sided coating method is demonstrated next by taking the PW7.5:7.5 as an example, as shown in Figure 19(a). The polyurea layer on the front side of the PW7.5:7.5, which had a thickness of 7.5 mm, effectively reduced the initial shock wave that was transmitted into the wall, while the polyurea layer on the rear side, which also had a thickness of 7.5 mm, continuously absorbed the energy that accumulated within the wall, thereby effectively alleviating the stress-concentration phenomena. Unlike the single-sided coating methods, the double-sided coating methods feature polyurea layers on both the front and rear sides of the walls, which allows the shock wave energy to be absorbed and attenuated on both sides. This produces energy reductions in the waves that were reflected within the walls, leading to more uniform energy distributions, a smaller amount of accumulated energy, and a decreased likelihood of localized damage in the walls.

Effective stress comparison for different double-sided coating methods: (a) stress wave propagation within the PW7.5:7.5, (b)–(f) effective stress–time curves extracted at the same position, (g) comparison of effective stress peaks at the same position
To further investigate the relationships between the polyurea coating method and the stress-wave propagation, measurement points were arranged at the same locations as were used for Figure 17(b), and the effective stress–time data were extracted for the different double-sided coating methods, as shown in Figs. 19(b)–19(f). The data obtained from the rear measurement point of the PW2.5:12.5, which were shown in Figure 19(b), indicated that the first stress peak occurred at 4.2 ms, after which the stress rapidly decreased and oscillated, thereby forming multiple stress peaks. When the shock wave impacted the PW2.5:12.5, the front polyurea layer absorbed part of the energy of the initial shock wave, some of the stress waves continued to reflect and superimpose within the wall, however, forming peaks at different times. The stress gradually decreased as the energy within the wall transformed and dissipated.
The maximum effective stresses obtained for the different double-sided coating methods were shown in Figure 19(g). It can be clearly observed that the maximum stress exhibited a continuous increasing trend as the front polyurea layer thickened and the rear polyurea layer thinned. This result primarily occurred because both the front and rear polyurea layers relieved the internal stresses in the wall, but they acted at different stages of the process. The front polyurea layer acted during the explosive-loading stage, while the rear polyurea layer acted during the wall-response stage. Since the response time of a masonry wall was much longer than loading phase of the explosive charge, the rear polyurea layer had a stronger capability of alleviating the stress concentrations. When its thickness increased, the maximum stress at the back of the wall significantly decreased.
However, a comparison of the subsequent peak values of the curves revealed that, as the thickness of the front polyurea layer increased and that of the rear polyurea layer decreased, the subsequent stress peaks generally exhibited decreasing trends. This situation may have occurred because the thicker front coating absorbed more of the energy of the initial shock wave, while some of the energy dissipated. As a result, the subsequent stress waves did not have sufficient energy to reflect and superimpose within the wall fully; therefore, the subsequent stress-wave peaks were reduced.
Figure 20(a) depicted displacement–time curves extracted at the maximum deflection point of the hollow masonry walls for the different double-sided coating methods. The figure shows that, as the front polyurea layer thinned and the rear polyurea layer thickened, the maximum deflection of the polyurea-reinforced masonry wall continuously decreased. For the walls coated by the different methods, the PW2.5:12.5 had the smallest maximum deflection. This deflection was 3.91 cm and was 13.88% less than that of the PW7.5:7.5. For all the double-sided coating methods, the maximum deflection was less than 4.40 cm. This result indicated that, within a certain range, the deflection-reduction capability of the rear polyurea layer improved as its thickness increased.

(a) Displacement–time curves, (b) velocity–time curves, (c) energy–time curves, (d) overpressure–time curves.
The velocity–time curves, which were extracted at the same position, exhibited the same pattern as the deflection–time curves. As shown in Figure 20(b), the maximum velocity recorded at the measurement point was smaller for the PW2.5:12.5 than for all the other cases. It had a value of 3.90 m/s, which was 18.92% less than that of the PW7.5:7.5. This result indicated that the use of a different coating method can change the propagation path of the stress inside the wall, and can therefore result in a different stress distribution after the wall has been subjected to stress. A reasonable coating scheme can more evenly distribute the stress within the wall, thereby reducing the local stress concentrations and decreasing the maximum velocity.
The energy changes in the polyurea layers of the hollow masonry walls with different double-sided coating methods were shown in Figure 20(c). As the front polyurea layer thickened, the time required for each wall to reach its first energy peak gradually increased and the initial energy peak gradually decreased. The PW2.5:12.5 had the largest initial energy peak; it had a value of 194 J, which was 7.78% greater than that of the PW7.5:7.5.
The overpressure data were then extracted at the same position as that used for Figure 18(d), as shown in Figure 20(d). As the rear polyurea layer thickened, the overall peak overpressure exhibited a decreasing trend. For the double-sided coating conditions, the average maximum overpressure of the walls reached 6.39 KPa; this value was 2 and 21% less than the values for the PW0:15 and the PW15:0, respectively. This result occurred because, when the shock wave passed through the wall, due to the large density difference between the polyurea and the mortar, some of its energy was converted into internal energy. This energy became accumulated due to the deflection of the wall after it was consumed at the contact interface. However, because the walls coated on both sides had one more contact interface between the polyurea and the mortar than did the walls coated on one side, the shock wave lost more energy when it was transmitted through the walls coated on both sides. Therefore, the average maximum overpressures of the walls with double-sided coatings were lower than those of the PW0:15 and the PW15:0.
These findings indicated that the double-sided polyurea-reinforcement methods can effectively alleviate stress concentrations under complex stress conditions in hollow masonry structures. The differences between the deflections of the walls reinforced with different coating methods were primarily caused by the positions and thicknesses of the coatings on the walls. A reasonable coating distribution can fully utilize the energy-absorption characteristics of the polyurea, and can thereby reduce the wall deflection, as well as enhance the overall stiffness and deformation resistance of the wall.
3.4 Theoretical failure-interpretation model for walls
The damage processes of the masonry walls varied with the coating method. Figure 21 illustrated the progressive damage processes of the PWs with different coating methods. When a PW was subjected to an explosive load, due to the weak tensile bond between the mortar and the CMUs, when the tensile stress, FD, inside the wall reached the tensile limit of the mortar or the CMUs, cracks began to appear from the weak surface (the contact interface between the mortar and the CMUs), after which the CMUs began to separate from each other. At first, the strain in the polyurea was very low. As the wall deflection continued to increase, the forces that provided external deformation resistance to the wall by means of the front and back coatings primarily included the resistance to the wall, FS, and the membrane tension, FT, on the wall. As the wall continued to deform, FT gradually increased as the strain on the back polyurea layer increased. However, the strain in the front polyurea layer did not significantly increase as the wall deflection increased; thus, the FS provided by the front polyurea layer was much smaller than FT. When the wall continued to deform and FT reached the tensile limit for a period of time, the polyurea layer ruptured. At this point, the maximum deflection of a PW reinforced on its front side can be expressed by Eq. (5) (Zhu et al. 2022):
where FT represents the ultimate tensile strength of the polyurea, Er is the tangent modulus of the polyurea, t is the wall thickness, h is the wall height, and l denotes the additional length after the reinforcement.

Progressive damage to PWs with different coating methods: (a) back coating,(b) front coating, (c) double-sided coatings
Double-sided polyurea coating methods integrated the advantages of both front and rear coatings. As shown in Figure 21(c), when an explosive load impacted a masonry structure, the front polyurea layer responded as a whole, thereby alleviating the stress concentration during the explosive loading. In addition, as cracks formed between the CMUs and the wall deflection continued to increase, the strain in the rear polyurea layer gradually increased until it formed high-strain regions. Simultaneously, the front polyurea layer also experienced some deformation due to the wall deflection. An observation of the current stress state revealed that the membrane stress provided by the polyurea layer was equal to the sum of FT and FS. Because the membrane stress was positive, F'T + F'S > max{F'T, F'S}, that is, the protective effect provided by double-sided coatings is better than that of single-sided coatings.
Both the front and rear coatings coordinated with the wall deformation and alleviated stress. However, the protective mechanism of the polyurea coating concerning stress mitigation varied with its position. The front coating effectively alleviated stress concentrations during the explosive-loading application phase, while the rear coating continuously alleviated stress concentrations during the wall-response phase. This stress-mitigation capability of the rear coating grew stronger as the thickness of the polyurea layer increased within a certain range. The rear coating also contributed to the containment of the debris generated when the wall fractured.
4 EFFECTS OF THE BLAST SCALED DISTANCES ON THE BLAST RESISTANCE OF POLYUREA COATINGS
Real explosion events often present wider ranges of blast scaled distances. In particular, when a close-in explosion occurs (0.3 m/kg1/3 ≤ Z ≤ 0.8 m/kg1/3) (Gan et al. 2021), the wall bears a large explosion load and the probability of wall collapse significantly increases. This section focused on an analysis of the effects of the blast scaled distances on the explosion-resistance capabilities of polyurea coatings.
4.1 Design principles
In the extended numerical model, the charge mass and polyurea coating method were held constant while the blast scaled distances was changed by reducing the explosion distance. Three extended scenarios were developed based on the typical PW2.5:12.5 case and with a distance gradient decrement of 1 m. Table 7 outlined the characteristics of these extended numerical models (where Z represents the blast scaled distances and the thickness combination is equal to the sum of the thicknesses of the front polyurea layer, the wall, and the rear polyurea layer).
4.2 Analysis of the simulation results
Figure 22 presented the numerical simulation results for different standoff distances. It was evident that both the PW2.5:12.5-3 and the PW2.5:12.5-2 collapsed, while the PW2.5:12.5-4 did not. Notably, for the PW2.5:12.5-3 and PW2.5:12.5-2 cases, various degrees of detachment were observed in the front polyurea layer at t = 10.2 ms. Partial detachment of the polyurea layer occurred in the PW2.5:12.5-3, and the entire front polyurea layer of the PW2.5:12.5-2 detached. The polyurea could no longer protect the wall within the detached area. At t = 22.2 ms, the area of compression failure was much larger in the PW2.5:12.5-2 than in the PW2.5:12.5-3, for which the primary form of failure was bending moment failure. By t = 150 ms, the collapse of the PW2.5:12.5-3 could be divided into three parts, during which the masonry structure partially retained its integrity. In contrast, the PW2.5:12.5-2 collapsed into fragments; some of these fragments were laterally ejected, which resulted in a complete loss of structural integrity. The failure mode of the PW2.5:12.5-4 was consistent with that of the PW2.5:12.5-5; it was characterized by crack formation, which was followed by oscillation. Although the localized damage was relatively severe, the polyurea reinforcement prevented collapse and the structural integrity was largely preserved.

Numerical simulation results for different blast scaled distances: (a) PW2.5:12.5-4, (b) PW2.5:12.5-3, (c) PW2.5:12.5-2.
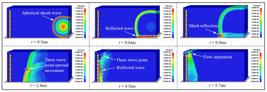
When the charge distance changed, the load that acted on the wall surface also varied. The factors that influenced this dynamic process included not only the attenuation of the shock wave in the air, but also the reflection of the shock wave along the ground; this latter factor cannot be ignored. Figure 23 illustrated the shock wave propagation and loading processes for the PW2.5:12.5-5. At t = 0.3 ms, a strong shock wave was released at the instant of explosion. Due to the spherical configuration of the charge, the shock wave propagated outward with a spherical shape. It is evident that, at t = 0.6 ms, when the shock wave encountered the ground, some of its energy was reflected back into the air, thereby forming a reflected wave, which propagated forward along the ground and followed the initial shock wave. At t = 0.9 ms, the reflected wave that propagated along the ground met and was superimposed with the initial shock wave, thereby forming a Mach wave. At t = 2.4 ms, the newly-formed Mach wave continued to propagate forward along the ground. As the distance between this Mach wave and the explosion center increased, the Mach stem gradually enlarged and the three-wave point moved upward.
To understand the maximum pressure distribution on the wall surface caused by an incident shock wave, measurement points were placed every 10 cm in the horizontal direction and every 20 cm in the vertical direction, as shown in Figure 24(a). A symmetric model with no measurement points represented the left half of the wall. There were a total of 117 measurement points. Figs. 24(b)-(e) present the distributions of the incident peak pressure on the wall surface for the different working conditions (PW2.5:12.5-5, PW2.5:12.5-4, PW2.5:12.5-3, and PW2.5:12.5-2). These distributions were created from pressure data collected at the various measurement points on the walls. The pressure distributions acting on the walls were extremely uneven, and the pressures at the bottoms of the walls were much greater than at other positions. These results indicated that the influence of the ground on the shock wave reflection cannot be ignored. In Figure 24(c) and Figure 24(d), distinct pressure boundaries were evident except at the bottoms of the walls; variations in the length of the Mach stem caused this result. When the Mach wave impacted a wall and the length of the Mach stem was less than the wall height, the Mach reflection enhanced the shock wave to some extent, thereby resulting in a greater peak pressure within the region affected by the Mach wave than in other areas. When the length of the Mach stem exceeded the wall height, as shown in Figure 24(b), the pressure decreased gradually from the center of the wall toward both ends, except at the bottom of the wall. When the Mach stem was very short, or the Mach reflection was not fully formed, as shown in Figure 24(e), the pressure difference was minimal (except at the bottom of the wall), resulting in an approximately planar pressure distribution.
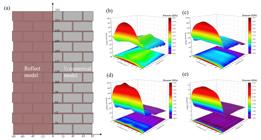
Peak wall pressures for different blast scaled distances: (a) schematic diagram of the pressure measurement model, (b) PW2.5:12.5-5, (c) PW2.5:12.5-4, (d) PW2.5:12.5-3, (e) PW2.5:12.5-2.
5 DAMAGE ASSESSMENT
The analysis of the damage caused to polyurea-reinforced masonry walls at different blast scaled distances, which was discussed in Section 4, revealed that accounting for the ground is crucial in numerical simulations. Mach reflections that propagate along the ground can enhance shock waves to a certain extent, thereby affecting the load distribution that acts on the wall surface. As the blast scaled distances decreases, the position of the three-wave point is closely related to the peak pressure on the wall. In this section, by combining the numerical simulation results from Sections 3 and 4, wall displacement and mass loss values were used to comprehensively assess the damage of the wall.
5.1 Displacement variations of the wall
The displacement response of a wall is related to several factors, such as the material strength of the wall, the support conditions, and the explosive load. Displacement information for the maximum deflection nodes in the hollow masonry walls investigated in this study was extracted during numerical simulations. According to the UFC standard (US Department of Defense 2008), the damage degree of a wall can be determined by the degree of deflection of the wall (the maximum displacement of the wall). The wall thickness (i.e., 24 cm) is an important parameter. When the wall deflection reaches the wall thickness, it is considered that the wall has sustained catastrophic damage.
Figure 25(a) presented the maximum deflections of the PWs subjected to explosive loading that were obtained from numerical simulation. For the uncollapsed PW, the maximum deflection in the oscillation period is taken. For the collapsed PW, the overall deflection of the wall was difficult to determine and quantify. The deflection at 150 ms was selected to represent the maximum deflection for collapsed PWs. The choice of this time point is based on the fact that compared with the average oscillation period of 80 ms of the uncollapsed wall, the period of 150 ms is large enough to make the deflection develop to reflect the damage degree of the wall. It can be observed from the figure that the displacement responses of the masonry walls varied when the coating method was changed. The maximum displacement increased as the blast scaled distances decreased. The maximum wall deflection rate, DM (the ratio of the maximum wall deflection to the wall thickness) with respect to the ratio of the thicknesses of the front and rear polyurea layers, K, were defined shown in Figure 25. The figure showed that, as K increased, the overall DM value exhibited an increasing trend; the minimum value of DM was 16.3% when K = 0.2. Figure 25(c) reflected the relationship between DM and Z (the blast scaled distance). It was found that, as Z decreased, the DM value of the PW2.5:12.5 gradually increased. The maximum blast-resistance ratio distance of the PW2.5:12.5 was between 1.1 and 1.47. Based on the information collected from the numerical results, two engineering formulas were fitted. One formula was a function of the polyurea coating method and the other was a function of the blast scaled distances, presented in Eqs. (6) and (7), respectively:

Prediction of PWs deflection response: (a) numerical maximum deflection results for the PWs, (b) fitting curve for the PW maximum deflection ratio as a function of the polyurea-layer thickness ratio, (c) fitting curve for the PW maximum deflection ratio as a function of the scaled distance.
Figure 25(b) showed that a distinct inflection point appeared when K = 0.2. This inflection point was produced because the front polyurea layer primarily served to alleviate the explosive load, while the back polyurea layer primarily served to reduce the deflection. When the sum of the thicknesses of the front and back polyurea layers remained constant, different values of K endowed the front and rear coatings with different thicknesses, which resulted in a certain degree of competitiveness between the layers. This result occurred because a polyurea layer must be of a certain thickness to fulfill its function (Zhang et al. 2022), and the magnitude of its effect increases as its thickness increases within a certain range. When K = 0.2, the rear polyurea layer produced the primary effect and the front polyurea layer produced the secondary effect, while DM reached a minimum value of 0.163. Therefore, a reasonable polyurea-layer thickness ratio can effectively improve the blast resistances of masonry walls.
5.2 Mass losses of the wall
When the masonry wall is subjected to an explosive load, cracks can form within it and on its surface, thereby causing changes in the mass of the wall. The results of these changes are closely related to the stability of the wall structure. During this study, data on the remaining mass of the wall were collected from the numerical simulations and analyzed from two perspectives: changes in the coating method and changes in the blast scaled distances. It is worth noting that the model established for the numerical simulations was only half of the actual size; thus, the mass changes in Figure 26 and the remaining mass in Figure 27(a) correspond to half of the total mass of the test wall.
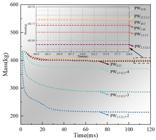

Prediction of remaining mass loss in PWs: (a) numerical residual mass results for the PWs, (b) numerical residual mass ratio results for the PWs, (c) fitting curve for the residual mass ratio as a function of the polyurea-layer thickness ratio, (d) fitting curve for the residual mass ratio as a function of the scaled distance
Using the data obtained by the numerical model, a relationship between the residual mass ratio, MR, and the ratio of the thicknesses of the front and rear polyurea layers, K, and a relationship between MR and Z were obtained through curve fitting. They are presented here as Eqs. (8) and (9), respectively:
The fitting results of Eq. (8) indicated that, as K increases, MR first increases rapidly and then stabilizes. The fitting results of Eq. (9) reveal a linear relationship between MR and Z, in which MR decreases as Z decreases.
5.3 Damage level
The masonry wall investigated in this study was not a load bearing structure; thus, the focus of the investigation was on whether the wall would disintegrate and whether any fragments would peel off and fly away. Further analysis was conducted using dimensionless wall damage parameters, and Figure 28(a) presents the specific values of the damage parameters. In the figure, ML = 100-MR.

According to Figure 28(a) and the relevant characteristics of long-distance explosions (Zhang et al. 2023b, Davidson et al. 2004), three PW damage modes were identified under different working conditions, summarized as follows.
-
Damage Level I: 20% < ML and DR < 33%. The region of compression damage on the wall surface is very small, and cracks are generated on the surface or within the wall due to stress concentrations. However, the masonry wall does not collapse after it oscillates and essentially retains its integrity.
-
Damage Level II: 20% ≤ ML < 40% or 33% ≤ DR < 200%. A portion of the wall surface is subjected to compression damage and the wall is divided into different regions by penetrating cracks. The collapse and stacking characteristics of the different regions preserve the wall integrity to a certain extent.
Damage Level III: 40% ≤ ML and 200% ≤ DR. The wall surface undergoes severe compressive failure, which leads to disintegration, during which the spalling and scattering of numerous fragments occur. The masonry structure loses its integrity.
Figure 28(b) presented a damage-mode retrieval map that was plotted with the mass loss rate, WL, as the x-axis and the maximum deflection rate, DM, as the y-axis. The local and overall damage characteristics of the masonry walls thus can be reflected from the perspectives of quality and deflection, respectively. Figure 28 shown that the overall explosion-resistance effects of the double-sided coating methods were superior to those of the single-sided coating methods.
6 CONCLUSIONS
In this study, the accuracy of the proposed numerical model was verified using publicly available experimental results. The damage patterns and protective performance of polyurea-coated hollow masonry walls subjected to explosive loading were then examined using the calibrated model. The damage patterns of the masonry walls were elucidated for a variety of coating methods and different scaled blast distances. The energy-absorption mechanisms and failure characteristics of the polyurea coatings were analyzed, and the extent of the damage sustained by the polyurea-reinforced masonry walls was evaluated. The main conclusions are as follows:
-
When a polyurea coating was applied to a single side of a wall, the polyurea layer on the back was superior to the polyurea in the front. The values of the peak stress, maximum deflection, peak velocity, and peak overpressure behind the wall for the PW0:15 were 12%, 28.92%, 17.54%, and 25% less, respectively, than the corresponding values for the PW15:0.
-
When polyurea layers were applied to both sides of a wall, both the front and rear polyurea layers contributed to stress alleviation. The front polyurea layer primarily acted during the explosive-loading stage, while the rear polyurea layer acted during the wall-response phase, during which its stress-mitigation effect was more pronounced and effective. However, a competitive mechanism existed between the front and rear polyurea layers with regard to enhancing the blast resistance of the masonry wall. The ratio of the maximum deflection of the wall to the wall thickness, DM, initially decreased and then increased as the ratio of the thicknesses of the front and rear polyurea layers, K, increased. When K = 0.2, (i.e., PW2.5:12.5), DM reached a minimum value of 0.163, while the maximum deflection at the rear of the wall was only 3.91 cm.
-
Numerical simulation studies were conducted with the PW2.5:12.5 for different blast scaled distances(Z). It was found that the Mach reflection wave that propagated along the ground significantly affected the pressure distribution on the surface of the PW2.5:12.5. When 0.74 m/kg1/3 < Z < 1.47 m/kg1/3, because the height of the three-wave point was less than the height of the wall, clearly defined high-pressure and low-pressure zones were formed on the wall. The height of the high-pressure zone was equal to the length of the Mach rod. The maximum blast-resistance distance of the PW2.5:12.5 was between 3 and 4 m, and it corresponded to a maximum blast-resistance ratio distance between 1.10 m/kg1/3 and 1.47 m/kg1/3.
-
Based on the damage-behavior characteristics of the PWs when they were subjected to explosive loading, and accounting for the mass loss rate and the maximum deflection rate, three typical masonry-wall failure modes were scientifically defined. A retrieval map of the damage modes of hollow masonry walls with different polyurea coating methods and blast scaled distances was established, providing a basis for rapid and intuitive judgments and evaluations of potential damage sustained by hollow masonry walls under various working conditions.
In this study, a reliable numerical model was established for thorough exploration and research regarding the blast-resistance characteristics of PWs with different polyurea coating methods. In the future, blast experiments with different types of polyurea, various boundary reinforcement methods, and different wall sizes will be considered, in addition to performing systematic analyses so that polyurea coating schemes with important reference significance for engineering designs can be proposed.
Acknowledgments
This research was supported by the Natural Science Foundation of Jiangsu Province (Grant No. BK20231489) and National Natural Science Foundation of China (Grant Nos.12102480 and 52278543). The authors would like to gratefully acknowledge this support.
-
Data availability:
Research data is available in the body of the article
References
- Wei X, Stewart M G. (2010) Model validation and parametric study on the blast response of unreinforced brick masonry walls. International Journal of Impact Engineering 37(11): 1150-1159.
- Zhang Y, Hu J, Zhao W, et al. (2023a) Numerical study on the dynamic behaviors of masonry wall under far-range explosions. Buildings 13(2): 443.
- Abou-Zeid B M, El-Dakhakhni W W, Razaqpur A G, et al. (2011a) Response of arching unreinforced concrete masonry walls to blast loading. Journal of Structural Engineering 137(10): 1205-1214.
- Chiquito M, Castedo R, Santos A P, et al. (2021) Numerical modelling and experimental validation of the behaviour of brick masonry walls subjected to blast loading. International Journal of Impact Engineering 148: 103760.
- Li Z, Chen L, Fang Q, et al. (2017a) Experimental and numerical study of unreinforced clay brick masonry walls subjected to vented gas explosions. International Journal of Impact Engineering 104: 107-126.
- Abhiroop G, Satadru DA. (2019) Retrofitting materials for enhanced blast performance of structures: Recent advancement and challenges ahead. Constr Build Mater 204:224–43.
- Zhengwei Zhang, Erxiang Song, Xinzheng Lu, et al. (2008) The effect of hollow block walls on the main structure under the action of nuclear explosion shock waves. Engineering Mechanics 25(5):6.(in Chinese)
- Abou-Zeid B M, El-Dakhakhni W W, Razaqpur A G, et al. (2011b) Performance of unreinforced masonry walls retrofitted with externally anchored steel studs under blast loading. Journal of Performance of constructed Facilities 25(5): 441-453.
- Hoemann J M, Shull J S, Salim H H, et al. (2015) Performance of partially grouted, minimally reinforced CMU cavity walls against blast demands. II: Performance under impulse loads. Journal of Performance of Constructed Facilities 29(4): 04014114.
- Shishegaran A, Karami B, Rabczuk T, et al. (2020) Performance of fixed beam without interacting bars. Frontiers of Structural and Civil Engineering 14: 1180-1195.
- Zehtab B, Salehi H. (2020) Finite-element-based monte carlo simulation for sandwich panel-retrofitted unreinforced masonry walls subject to air blast. Arabian Journal for Science and Engineering 45(5): 3479-3498.
- Xin Fang, Yingnan Xu, Chuanjin Hou, et al. (2019) Preparation and performance study of polyurea. Chemical New Materials 47 (03): 203-206(in Chinese)
- Hrynyk T D, Myers J J. (2008) Out-of-plane behavior of URM arching walls with modern blast retrofits: Experimental results and analytical model. Journal of Structural Engineering 134(10): 1589-1597.
- Zhang Y, Hu J, Zhao W, et al. (2023b) Numerical simulation of the blast resistance of SPUA retrofitted CMU masonry walls. Buildings 13(2): 446.
- Guo Y R, Zheng H. (2013) Numerical Simulation of Polyurethane Strengthened Perforated Masonry Walls under Blast Loading. Advanced Materials Research 639: 727-731.
- Wang J, Ren H, Wu X, et al. (2017) Blast response of polymer-retrofitted masonry unit walls. Composites Part B: Engineering 128: 174-181.
- Tao X, Jia Y, Fan C. (2020) Experimental research on explosion resistance of masonry structures reinforced with modified polyurea elastomer. Materials Science and Engineering 711(1): 012012.
- Wu G, Ji C, Wang X, et al. (2022) Blast response of clay brick masonry unit walls unreinforced and reinforced with polyurea elastomer. Defence Technology 18(4): 643-662.
- Zhu H, Luo X, Ji C, et al. (2023) Strengthening of clay brick masonry wall with spraying polyurea for repeated blast resistance. Structures 53: 1069-1091.
- Zhu H, Wang X, Wang Y, et al. (2022) Damage behavior and assessment of polyurea sprayed reinforced clay brick masonry walls subjected to close-in blast loads. International Journal of Impact Engineering 167: 104283.
- Sielicki P W, Łodygowski T. (2019) Masonry wall behaviour under explosive loading. Engineering Failure Analysis 104: 274-291.
- Santos A P, Chiquito M, Castedo R, et al. (2023) Experimental and numerical study of polyurea coating systems for blast mitigation of concrete masonry walls. Engineering Structures 284: 116006.
- Abou-Zeid B M, El-Dakhakhni W W, Razaqpur A G, et al. (2011) Performance of unreinforced masonry walls retrofitted with externally anchored steel studs under blast loading. Journal of Performance of constructed Facilities 25(5): 441-453.
- Govindjee S, Kay G J, Simo J C. (1995) Anisotropic modelling and numerical simulation of brittle damage in concrete. International Journal for Numerical Methods in Engineering 38(21): 3611-3633.
- Livermore Software Technology Corporation. (2015) LS-DYNA 971. Livermore, CA, USA: Livermore Software Technology Corporation
- Wu G, Wang X, Wang Y, et al. (2022a) Bioinspired nacre-like steel-polyurea composite plate subjected to projectile impact. Materials & Design 224: 111371.
- D’altri A M, Sarhosis V, Milani G, et al. (2020) Modeling strategies for the computational analysis of unreinforced masonry structures: review and classification. Archives of Computational Methods in Engineering 27: 1153-1185.
- Zhan Li, Li Chen, Qin Fang, et al. (2017b) Experimental and numerical study of basalt fiber reinforced polymer strip strengthened autoclaved aerated concrete masonry walls under vented gas explosions. Engineering Structures 152: 901–919
- Wu J, Liu Z, Yu J, et al. (2022b) Experimental and numerical investigation of normal reinforced concrete panel strengthened with polyurea under near-field explosion. Journal of Building Engineering 46: 103763.
- Lu Gan, Li Chen, Zhouhong Zong, et al. (2021) Definition standards and load models for proportional explosion distance in close range explosions. Explosion and Impact 41(6):12. (in Chinese)
- Aghdamy S, Wu C, Griffith M. (2013) Simulation of retrofitted unreinforced concrete masonry unit walls under blast loading. International Journal of Protective Structures 4(1): 21-44.
- US Department of Defense. Structures to resist the effects of accidental explosions. (2008) Washington, DC, USA: United Facilities Criteria Report no. UFC 3–340-02.
- Davidson J S, Porter J R, Dinan R J, et al. (2004) Explosive testing of polymer retrofit masonry walls. Journal of Performance of Constructed Facilities 18(2): 100-106.
- Zhang L, Ji C, Wang X, et al. (2022) Strengthening and converse strengthening effects of polyurea layer on polyurea–steel composite structure subjected to combined actions of blast and fragments. Thin-Walled Structures 178: 109527.
Edited by
-
Editor:
Marcílio Alves
Research data is available in the body of the article

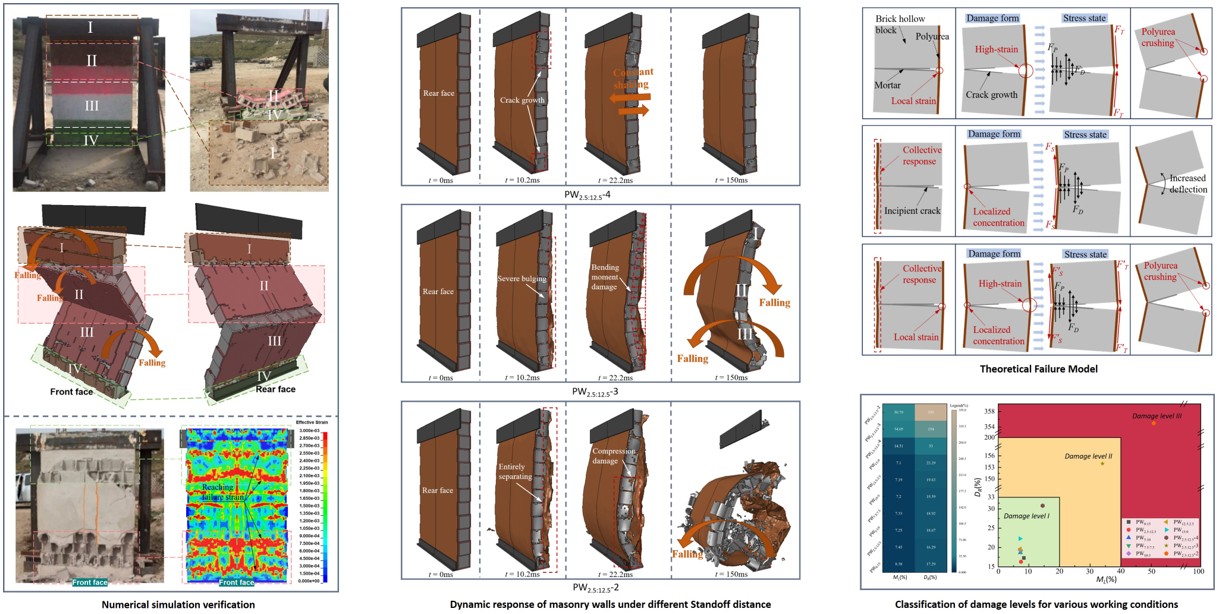


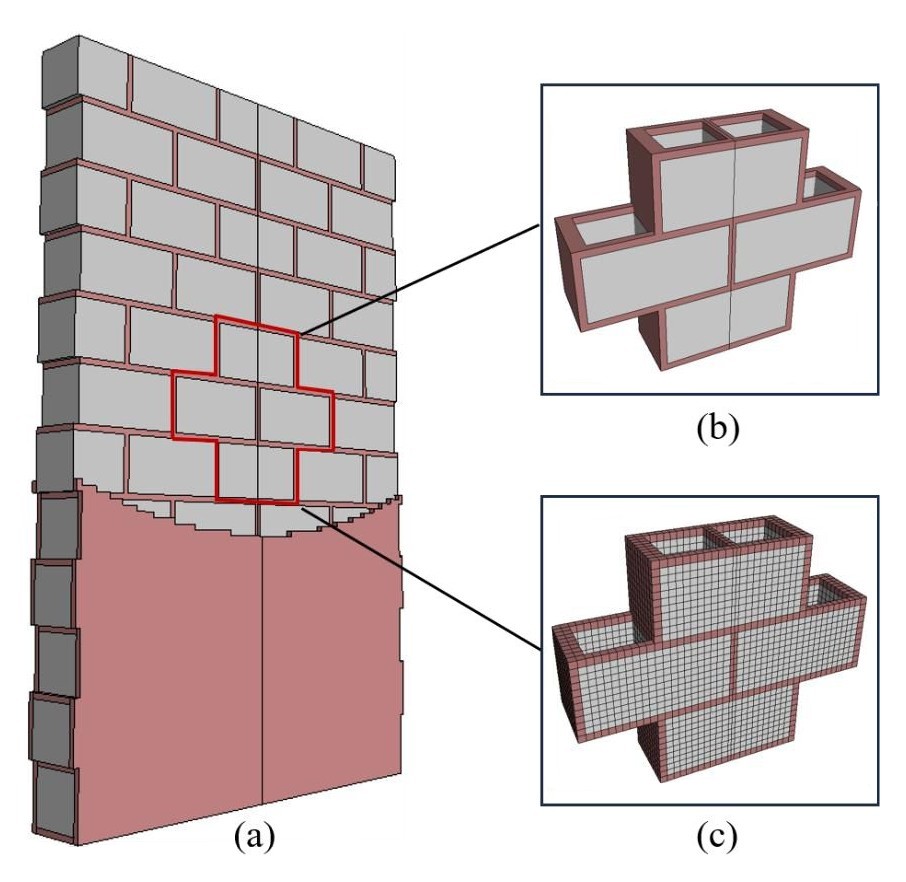

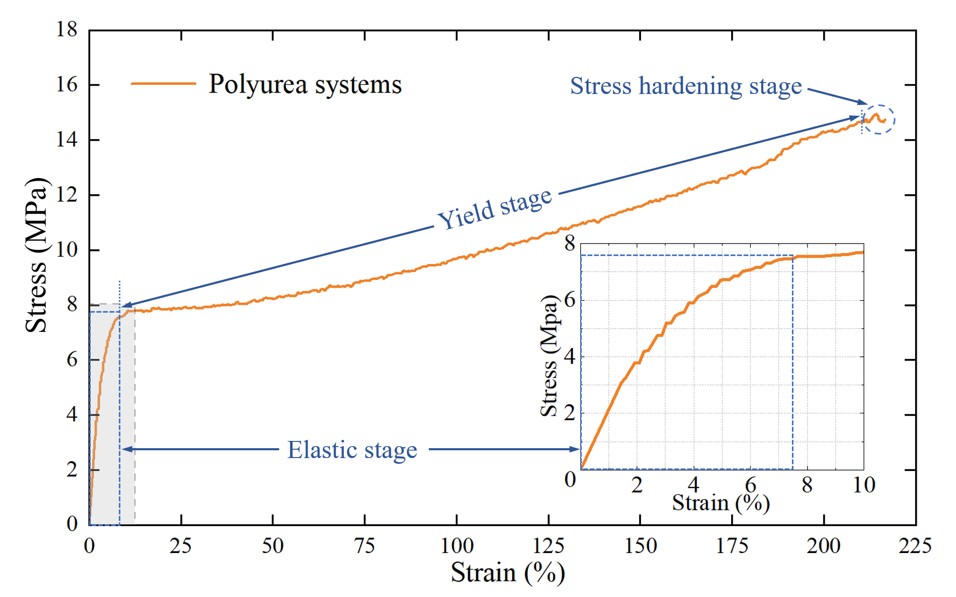

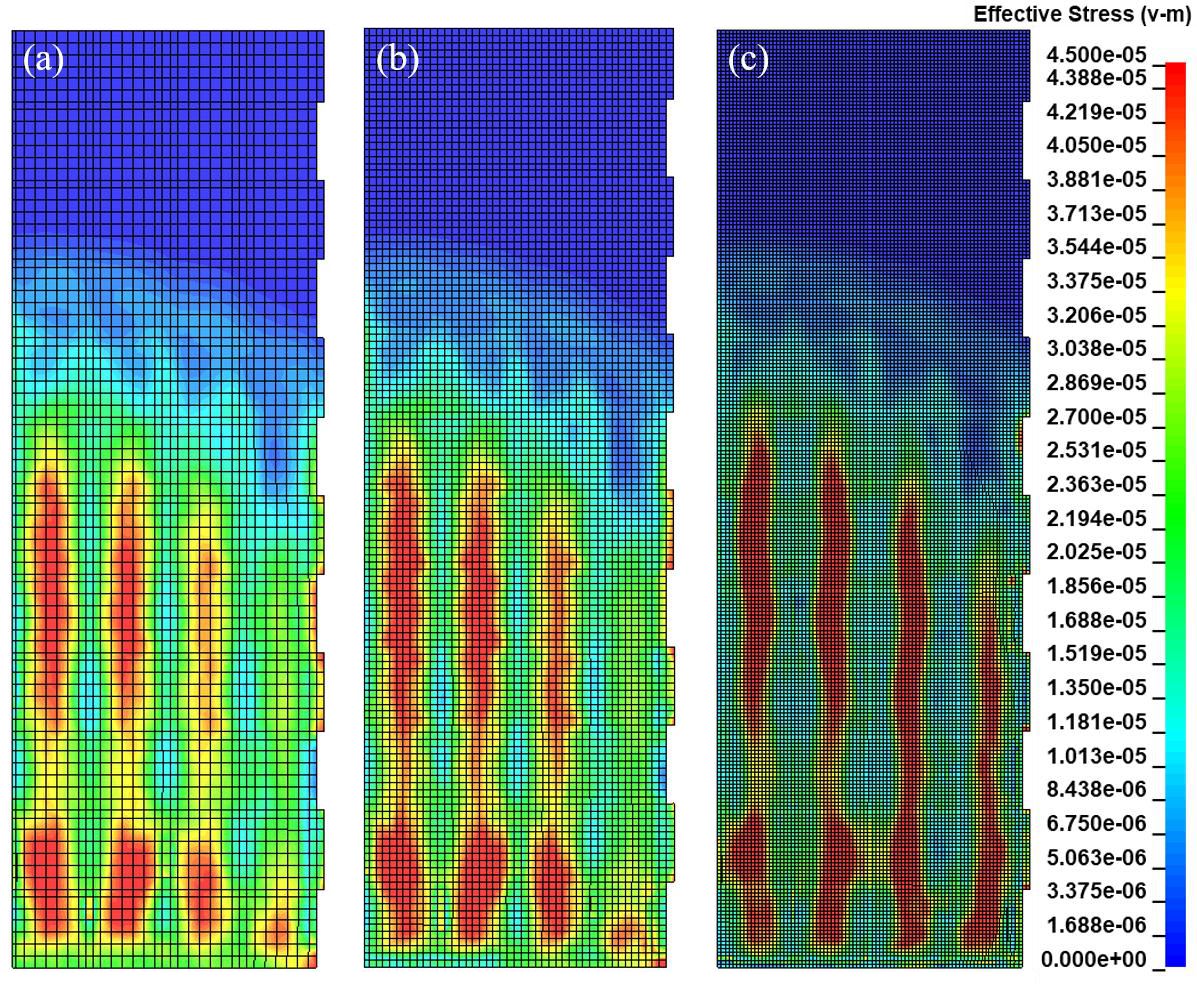


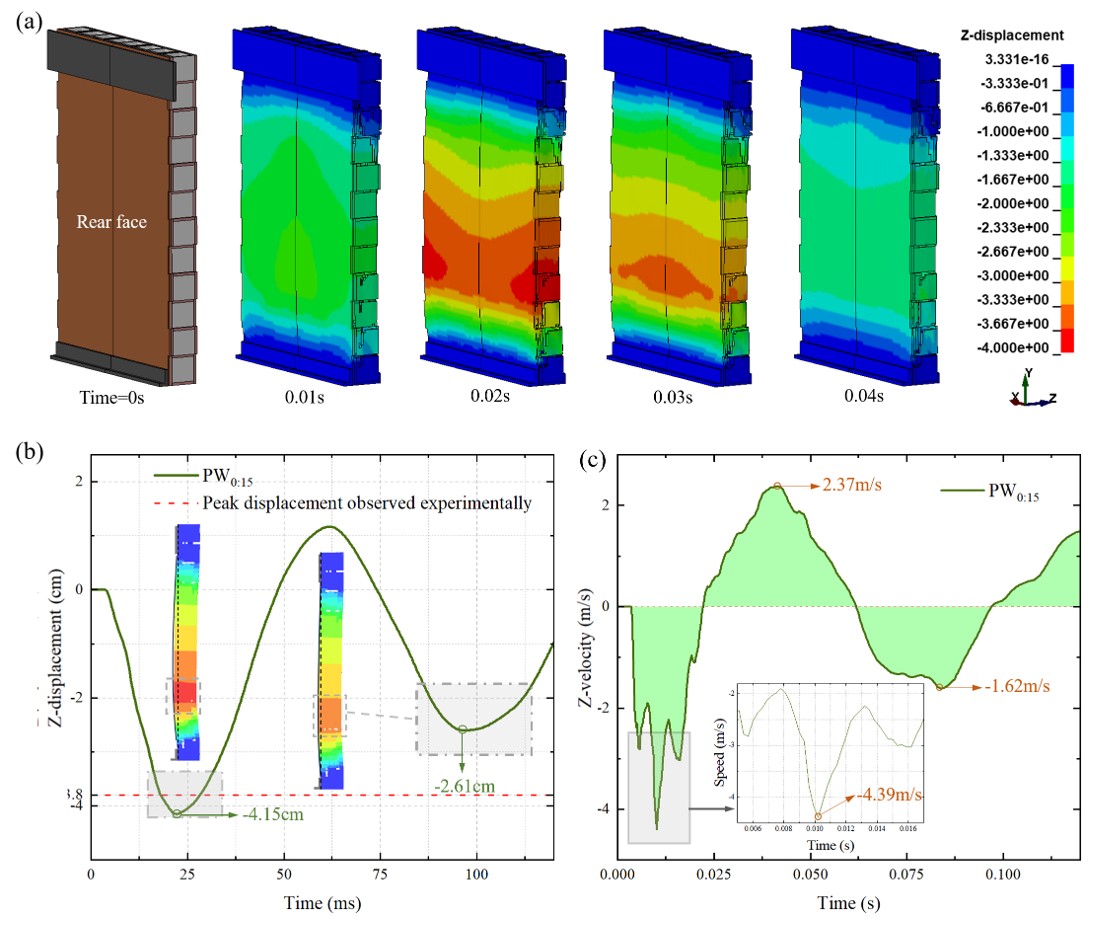
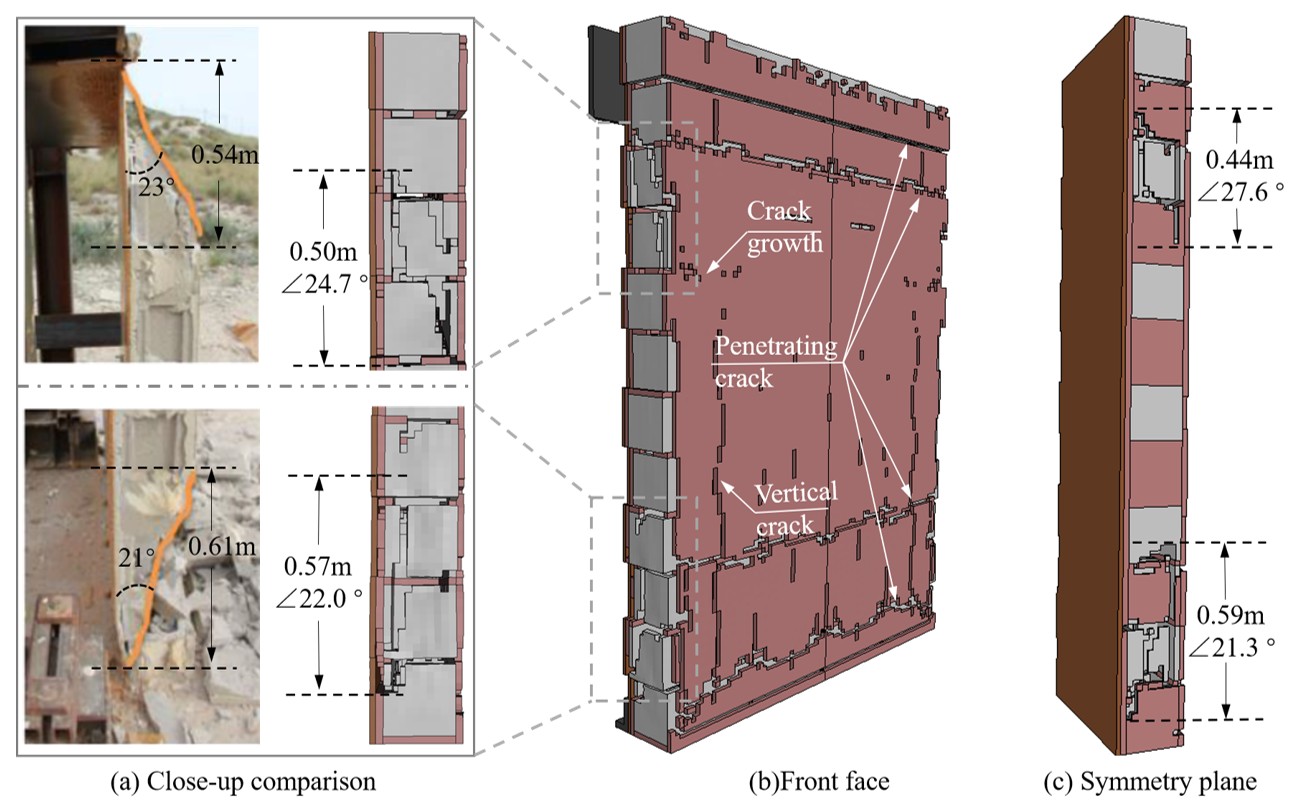
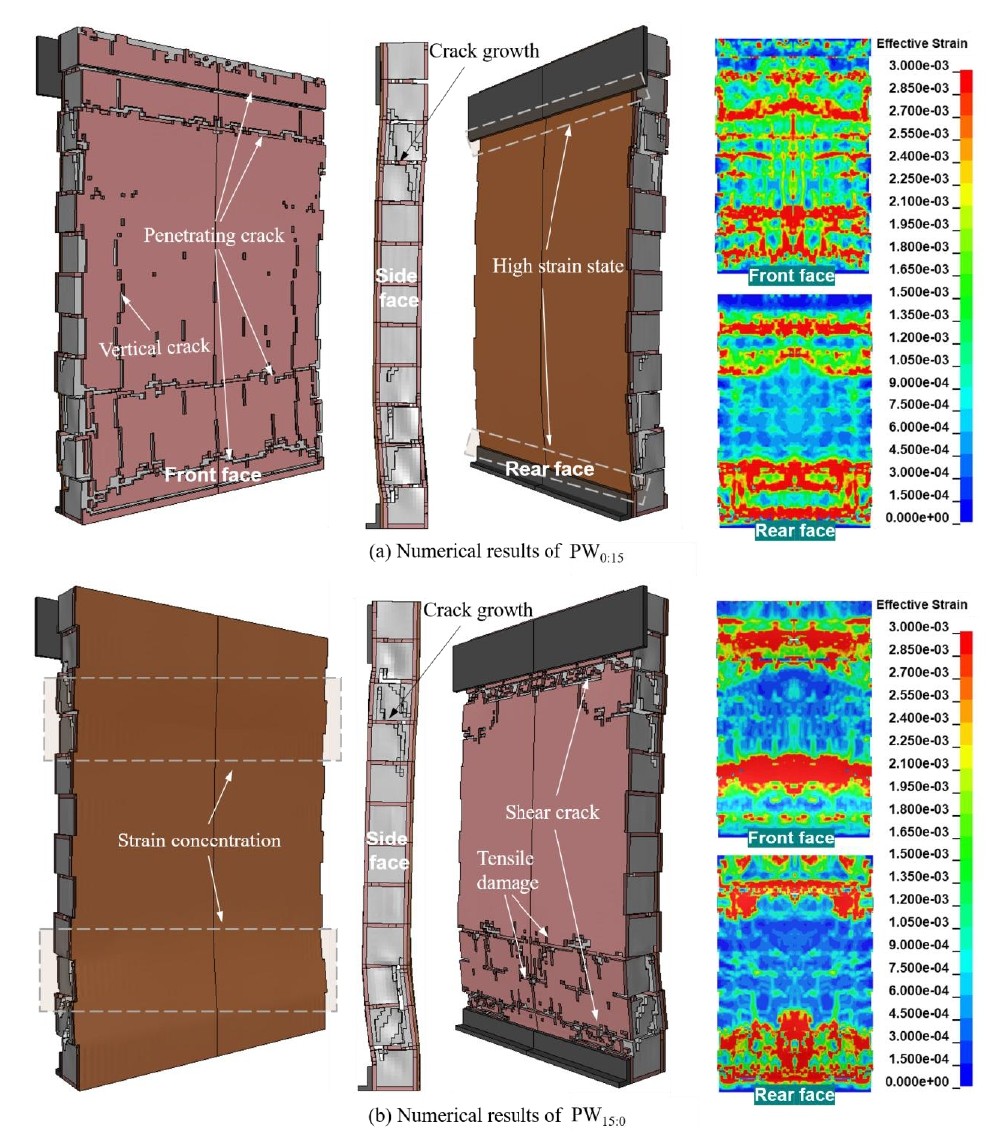


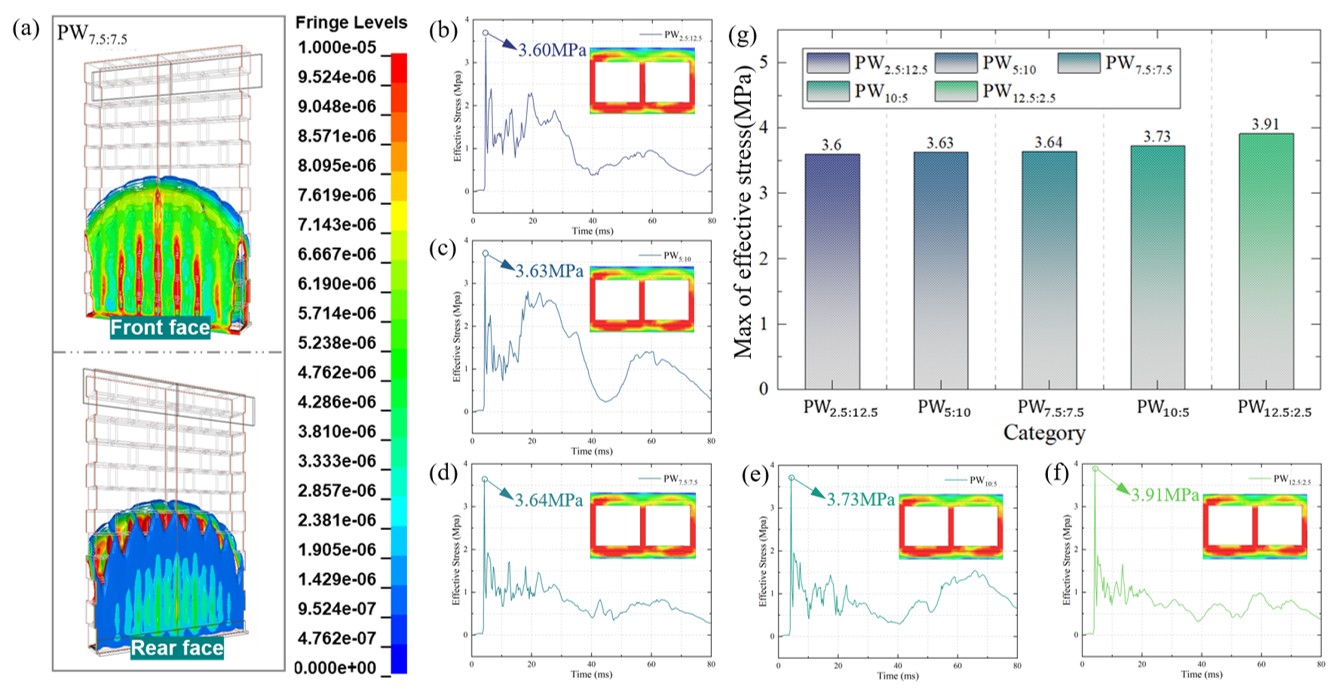


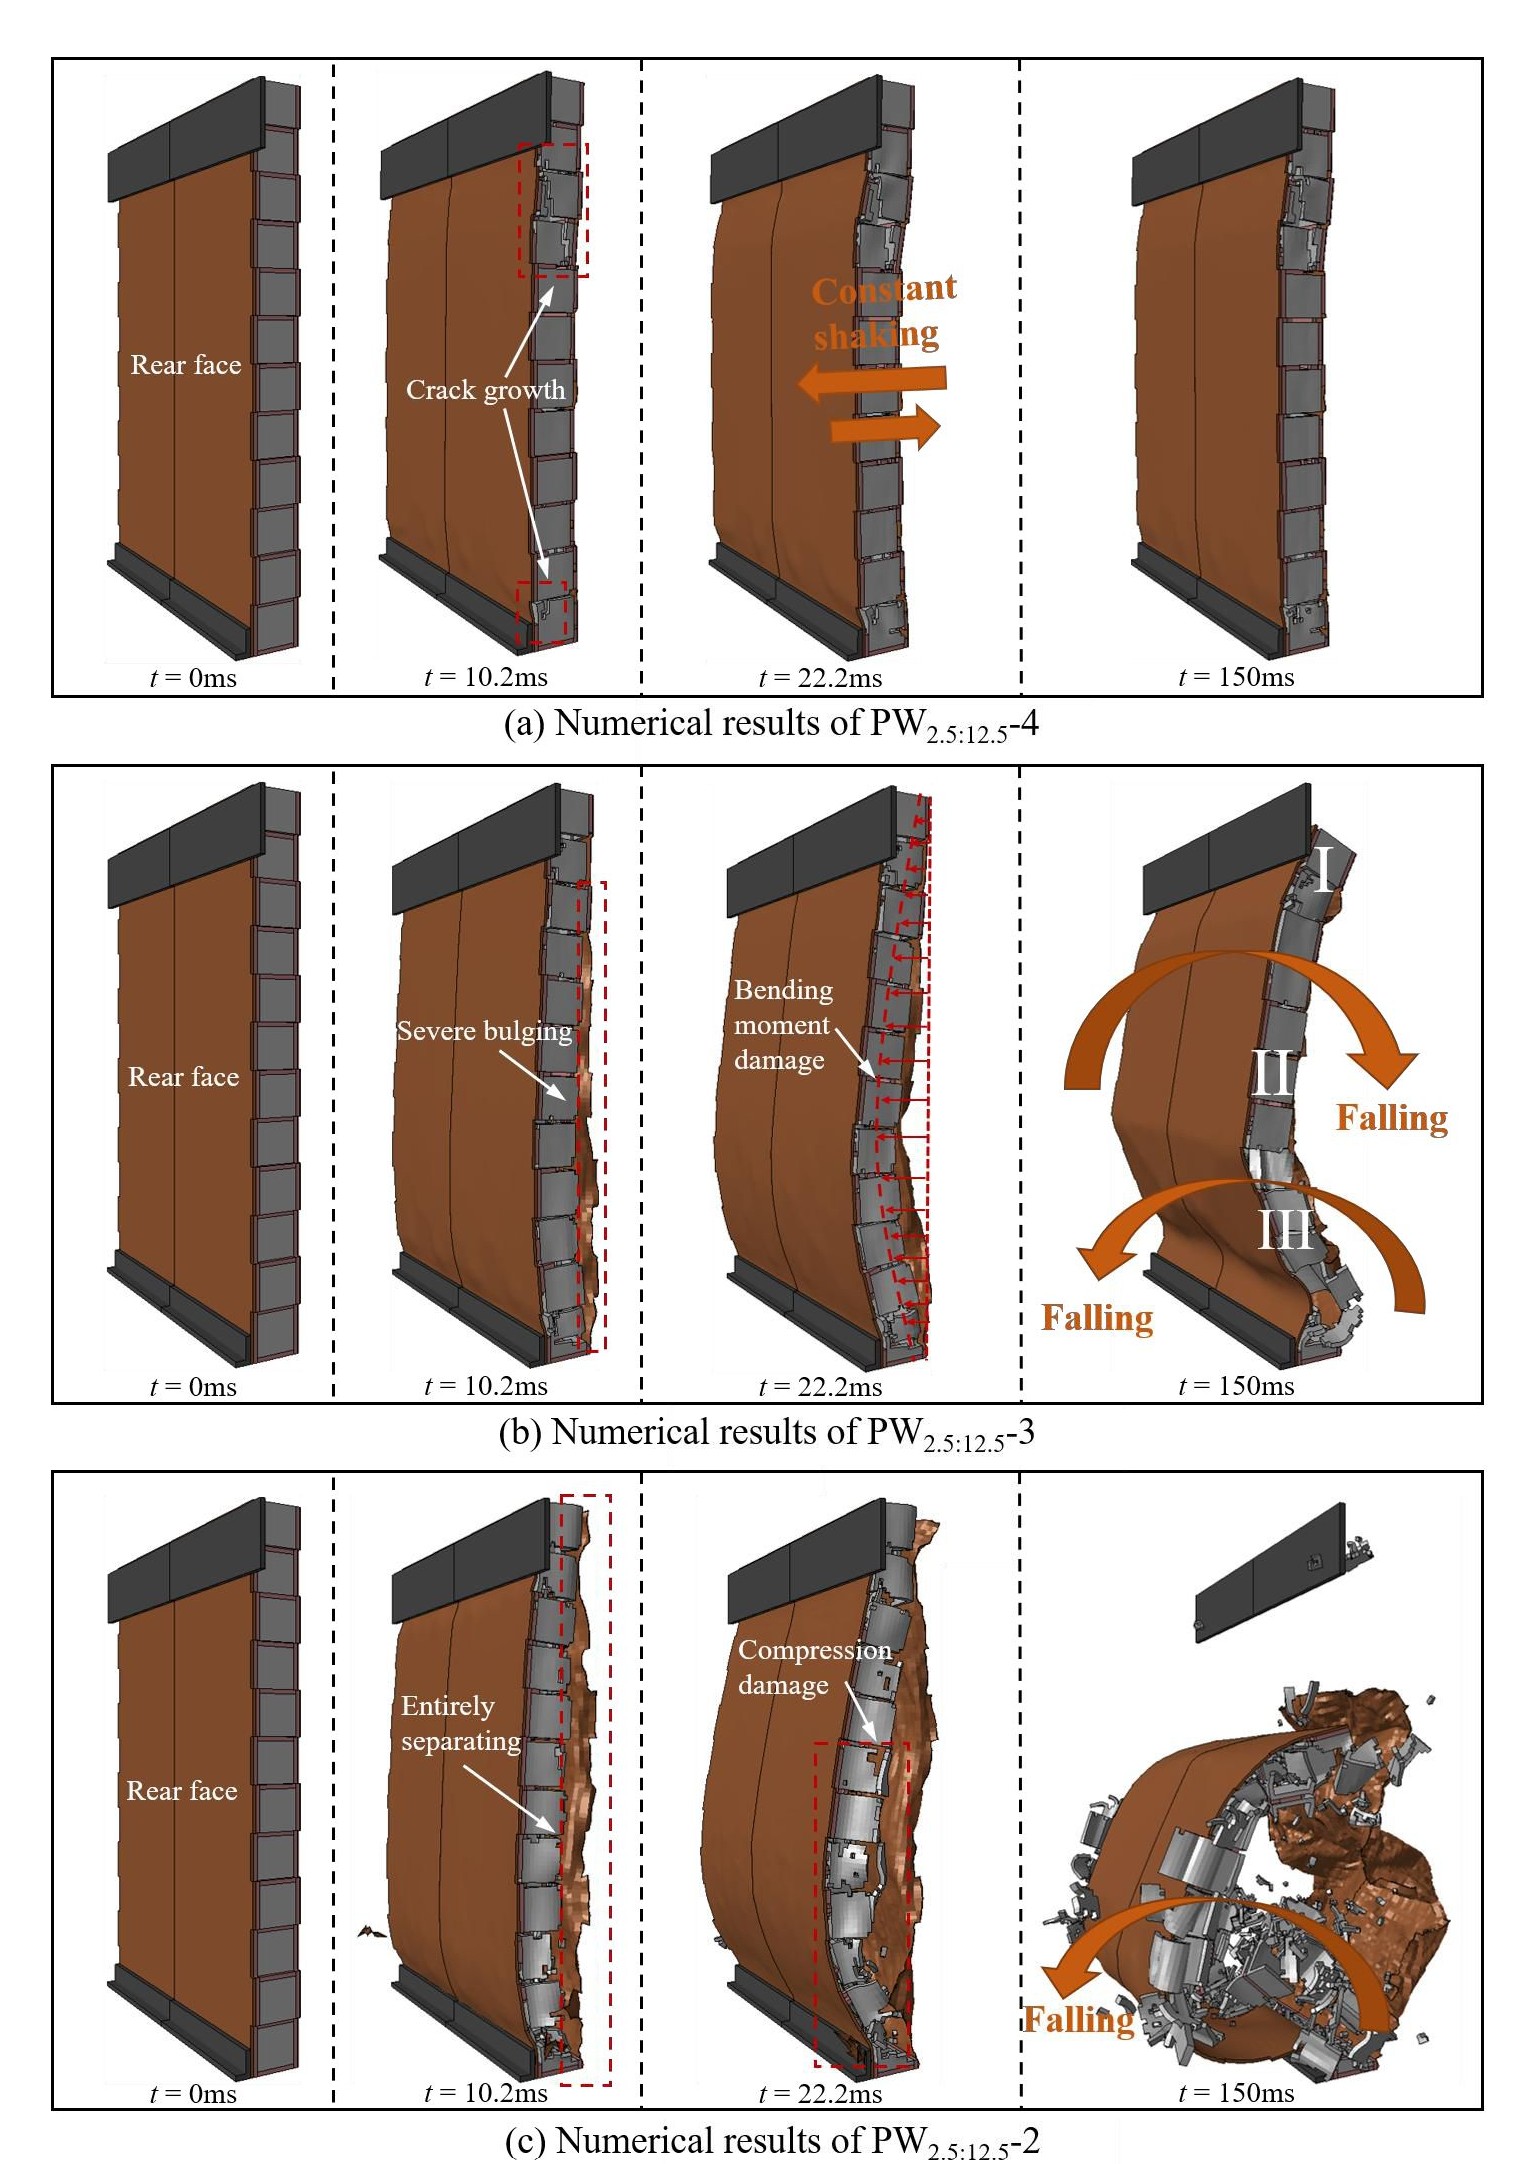


 represents the polyurea layer,
 represents the masonry wall.)