Phase-field modeling of hydraulic fracturing in RVEs of heterogeneous materials
Abstract
Modeling hydraulic fracturing requires capturing the interaction between fluid flow and solid deformation, which leads to complex crack patterns, especially in materials that are heterogeneous at a given scale. At the microscale, such materials can be described as multiphase media with distinct mechanical properties, where damage initiates and may be significantly affected by internal pressure. This work models pressure-driven fracture propagation in heterogeneous materials using a phase-field approach. Representative volume elements with random particle distributions are generated through a take-and-place strategy and subjected to tensile tests within a phase-field framework. Internal pressure is incorporated by coupling it to the gradient of the phase-field variable, enabling the simulation of pressurized crack propagation. A numerical study evaluates the influence of pressure magnitude and aggregate volume fraction on the fracture response. Results demonstrate the ability of the approach to reproduce pressurized crack patterns in quasi-brittle media, providing a consistent and computationally effective approach for future multiscale analyses.
Keywords:
Representative volume elements; Crack propagation; Pressurized cracks

1 INTRODUCTION
Hydraulic fracturing occurs when the crack environment is under the influence of hydraulic loads, commonly referred to as hydraulic pressure, which affects the onset and propagation of the crack. Adachi et al. (2007) highlight the challenges in modeling such problems, which require accounting for interactions between the medium and the fluid; crack propagation; and, in more complex models, fluid flow within both the medium and the fracture. The applications of hydraulic fracturing encompass different sectors such as the gas and oil extraction industry, structural engineering dealing with structures in hydraulic environments, geological material and geothermal reservoir studies, mining, among others, which justifies the increasing interest in this field of study.
Most applications of hydraulic fracturing concern industrial, engineering, and natural materials, which are heterogeneous at a certain scale. Addressing these heterogeneities remains a key issue for many researchers, since the presence of heterogeneities affects the mechanical response of the medium. Therefore, the study of hydraulic fracturing from a multiscale approach is an interesting topic to explore. In this context, at least one of the scales must be able to represent the different material phases, typically referred to as the microscale, which is modeled through representative volume elements (RVEs). According to Khan et al. (2022), in general, the fracture process begins at this microscale, affecting the stiffness and strength characteristics at the macroscale.
At the microscopic level, most materials can be interpreted as a heterogeneous medium comprising a variety of components with different mechanical properties. Numerical modeling of fractures in heterogeneous media faces several challenges, mainly related to fractures of complex topology with the presence of phenomena such as bifurcation and sudden changes in direction, as indicated by Seles et al. (2019). In this sense, the adoption of a robust model that does not limit the crack propagation path is essential, as is the case with the phase-field model. Wheeler et al. (2014) also highlights that the application of this model to heterogeneous media is straightforward, without the need for additional deductions.
The phase-field model has already been used in several applications involving pressurized cracks in homogeneous and heterogeneous media, with the pioneering formulation by Bourdin et al. (2012) being adopted in this paper. This model extends the classical variational framework for brittle fracture originally introduced by Bourdin et al. (2000), to account for the effects of hydraulic pressure loading. In the present work, this formulation is adopted to represent quasi-brittle materials, for which fracture is the dominant mechanism governing energy dissipation and failure. Accordingly, this study proposes an investigation of different samples of heterogeneous materials under traction tests to assess the influence of pressure load on material response and crack development. The importance of considering the interfacial transition zone (ITZ), identified by Wriggers and Moftah (2006) as having a major influence on the onset of microcracking, is also evaluated.
This paper evaluates the applicability of the pressurized phase-field formulation proposed by Bourdin et al. (2012) to pressure-driven fracture propagation in heterogeneous materials. The model is based on the classical phase-field framework and introduces a pressure load whose evolution is governed by the gradient of the phase-field variable, which reflects the current crack configuration. By construction, this approach does not involve a fully coupled hydromechanical formulation, as no flow equation is solved and the pressure is prescribed. Nevertheless, this simplified setting significantly reduces computational complexity, allowing a focused assessment of the formulation in heterogeneous RVEs. Consequently, the problem involves only two primary unknowns: the displacement field and the phase-field variable. The main contribution of this work is the investigation of heterogeneous random samples and their response to combined external loading and internal pressure, establishing a foundation for subsequent developments in multiscale analyses. A similar investigation by Seles et al. (2019) also aimed to support the incorporation of the phase-field model into multiscale frameworks, reinforcing the importance of this line of research. Nevertheless, the present study concentrates on the behavior of multiphase materials, especially concrete, under internal pressure loading, while Seles et al. (2019) focused mainly on the staggered solution algorithm used to treat the heterogeneities of nodular cast iron.
All implementation and numerical simulation were performed using INSANE software, an opensource program developed at the Department of Structural Engineering at the Federal University of Minas Gerais. Finite element meshes with different particle distributions were also generated in INSANE with the help of GMSH software features. The phase-field contour plots were generated using Paraview.
2 THEORETICAL FOUNDATION
This work is based on the use of the variational phase-field approach in modeling pressurized cracks in heterogeneous media. These topics will be briefly discussed below.
2.1 Phase-field modeling of hydraulic fracture
The phase-field model is a diffuse fracture model in which the level of degradation of the medium is quantified by using an additional continuous field variable to the classical elasticity problem, the phase-field variable, denoted by . The damaged material is represented by , while the intact material is represented by , extreme values separated by a smooth variation of , whose width depends on the material parameter called length scale (). Given that it is a model capable of representing complex cracking patterns without any prior knowledge of their trajectory, its use is widespread in the study of hydraulic fracturing, as reviewed by Heider (2021). Here, the formulation proposed by Bourdin et al. (2012), pioneers in the study of pressurized fractures based on the phase-field model, was employed. Their simplified approach considers a constant pressure load in a quasi-static setting, an impermeable medium with no porosity, and incompressible fluid.
The formulation of the model is based on minimizing the total energy functional, given by Equation 1, which presents an additional term in relation to the classical problem, referring to the work of the pressure load in the crack domain.
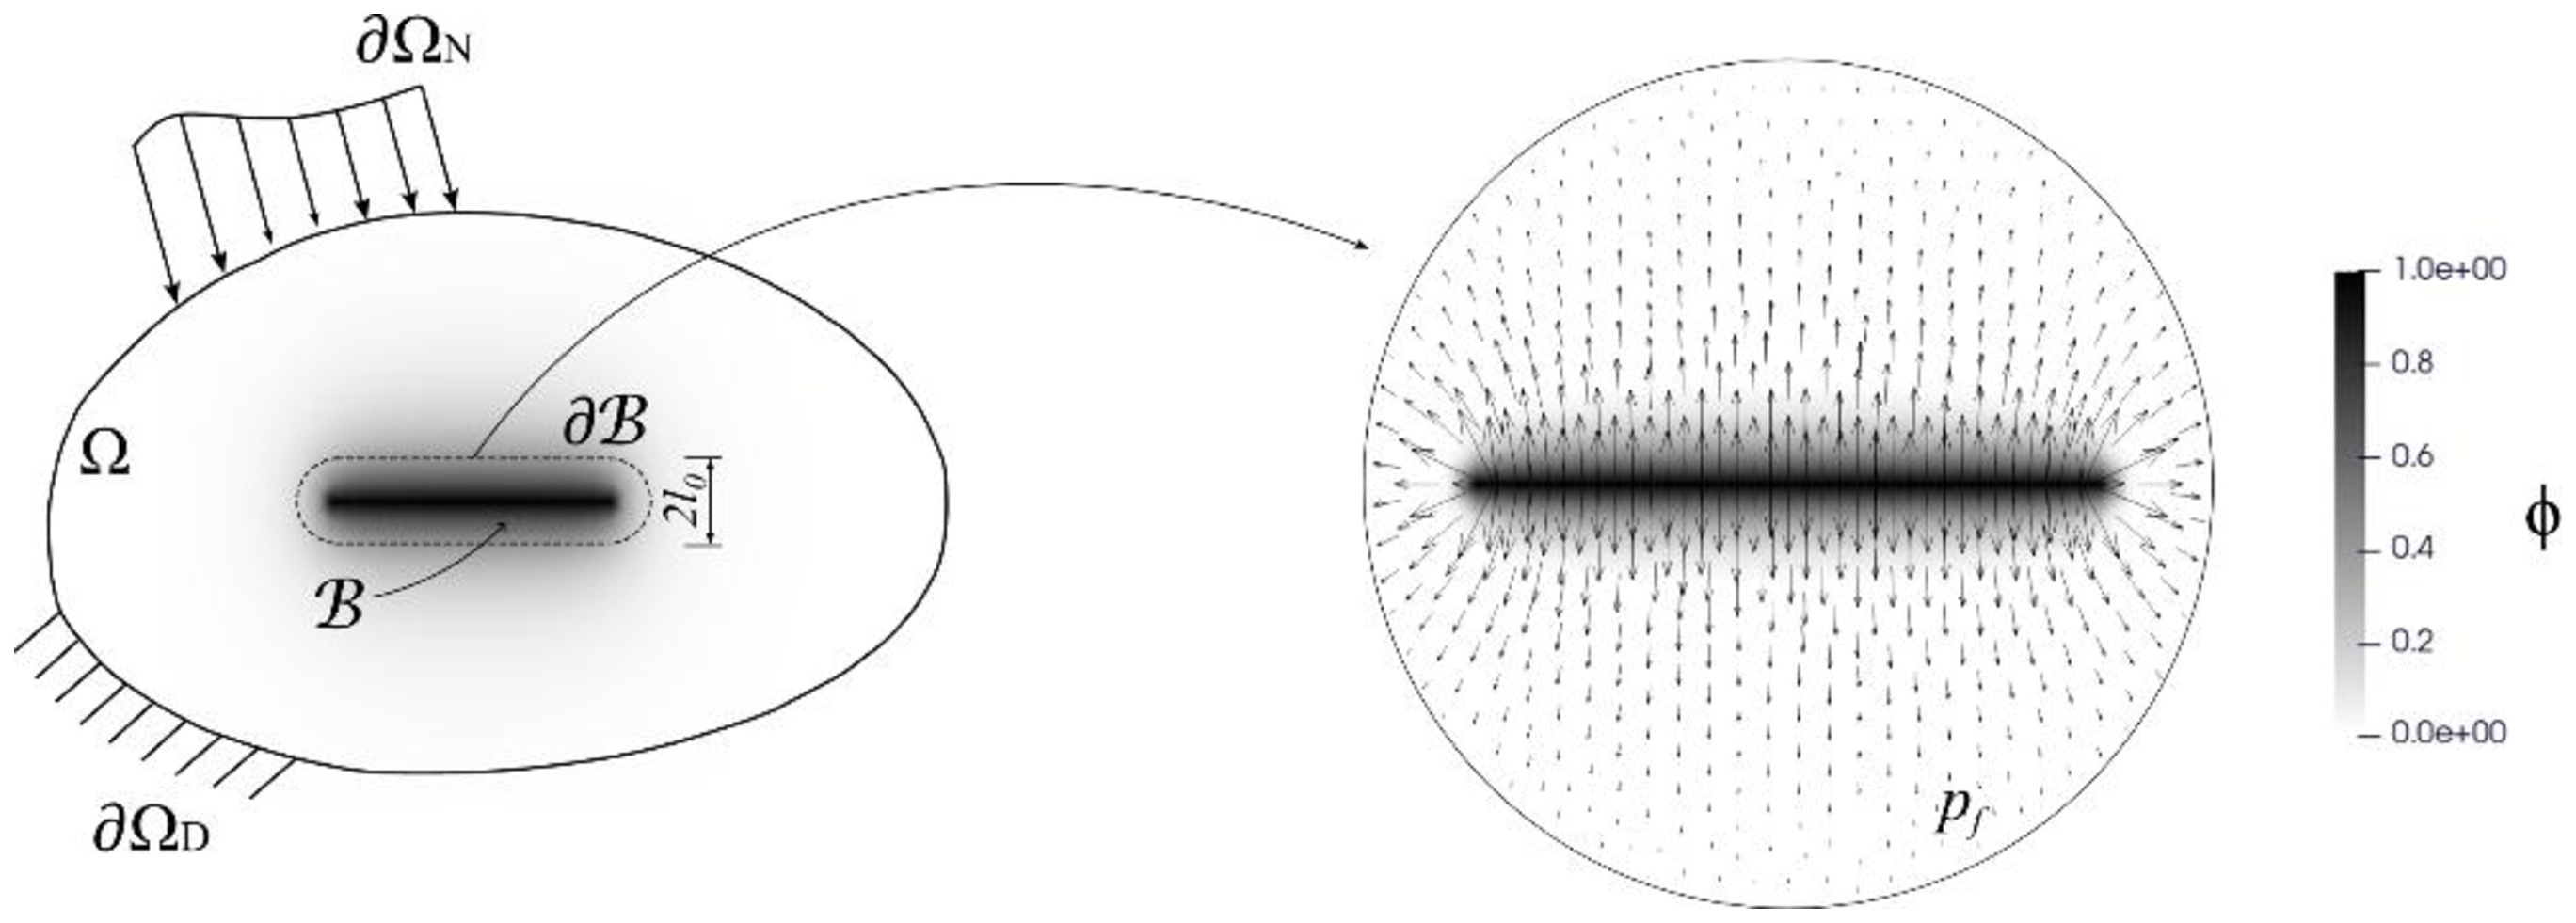
where is the problem domain with external boundary on which Neumann conditions are imposed and represents the broken part of the domain, is the cinematically admissible displacement field, is the strain energy density, is the critical energy release rate, is crack surface density, is the vector of body forces, is the vector of surface forces and is the fluid pressure load. An illustrative diagram of the problem with a phase-field fracture and the presence of pressure load is shown in Figure 1.

In the phase-field model, the strain energy depends on through the energy degradation function , responsible for connecting the mechanical field and the crack field. In this paper, the function will be used. The crack surface density function depends on the geometric crack function that defines the phase-field distribution along the degradation band. Here, the quadratic function was adopted. In addition, an isotropic constitutive model is adopted, allowing damage evolution under both tension and compression. The use of this model does not lead to the appearance of non-physical cracks in the study proposed here, since only plain tensile tests are simulated. Both the and functions and the constitutive model were proposed by Bourdin et al. (2000).
The solution that minimizes the energy functional presented in Equation 1 can be obtained using staggered solvers that seek convergence of each field independently until global convergence is achieved. Here, the staggered bound-constrained solver (Farrel and Maurini, 2017) will be used, which reinforces the crack irreversibility condition and the constraint of , criteria that are of concern to some researchers due to the fracture pressure term (Yoshioka et al., 2020).
2.2 Phase-field modeling of heterogeneous media
A major advantage of using phase-field modeling in heterogeneous media, in addition to the absence of strain concentration with the use of refined meshes, which allows the discretization of small phases, is its direct application to materials with different properties without any modification to the original model framework, as highlighted by Wheeler et al. (2014).
This paper will address the modeling of materials such as concrete, which have constituents with markedly different properties that are seen discretely at small scales of observation (i.e., microscale). The microscale will be defined by a representative volume element (RVE) where the constitutive behavior of each constituent is modeled. Here, the heterogeneous medium will be represented by a cementitious matrix into which particles representing the aggregates are inserted. The interfacial transition zone (ITZ) can also be considered in order to more accurately represent the behavior of the material. The domain is generated based on the definition of the volume percentage of aggregate and composition of the particle size distribution curve that follows the limits presented in ABNT NBR 7211 (2022). The arrangement of aggregates, taken as circular particles, in the matrix is performed using the take-and-place method described by Wang et al. (1999) and Wriggers and Moftah (2006).
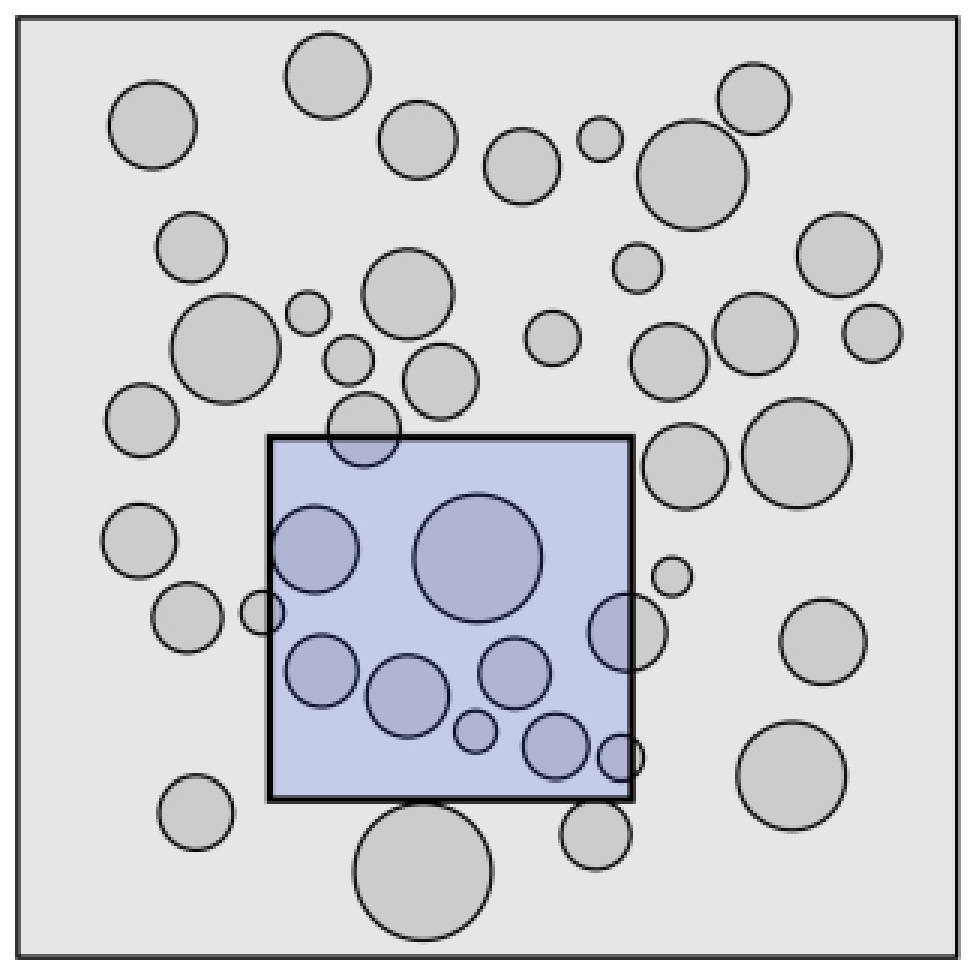
The aggregates are first distributed within an enlarged domain, approximately ten times larger than the target RVE size, according to the prescribed particle fraction and the gradation curve defined by ABNT NBR 7211 (2022). This enlarged domain allows for a more uniform distribution of aggregates of different sizes while ensuring compliance with the specified fraction. Subsequently, square samples corresponding to the RVE dimensions are randomly extracted from this larger domain. A schematic representation of this procedure is shown in Fig. 2. This approach ensures randomness in the particle arrangement and, consequently, in the crack propagation path, without imposing restrictions on the presence of aggregates along the RVE boundaries. As a result, different RVEs extracted from the same initial particle distribution may exhibit distinct cracking behaviors.

Initial larger domain containing the distributed aggregates, from which the RVE with the specified dimensions is extracted.
3 NUMERICAL RESULTS
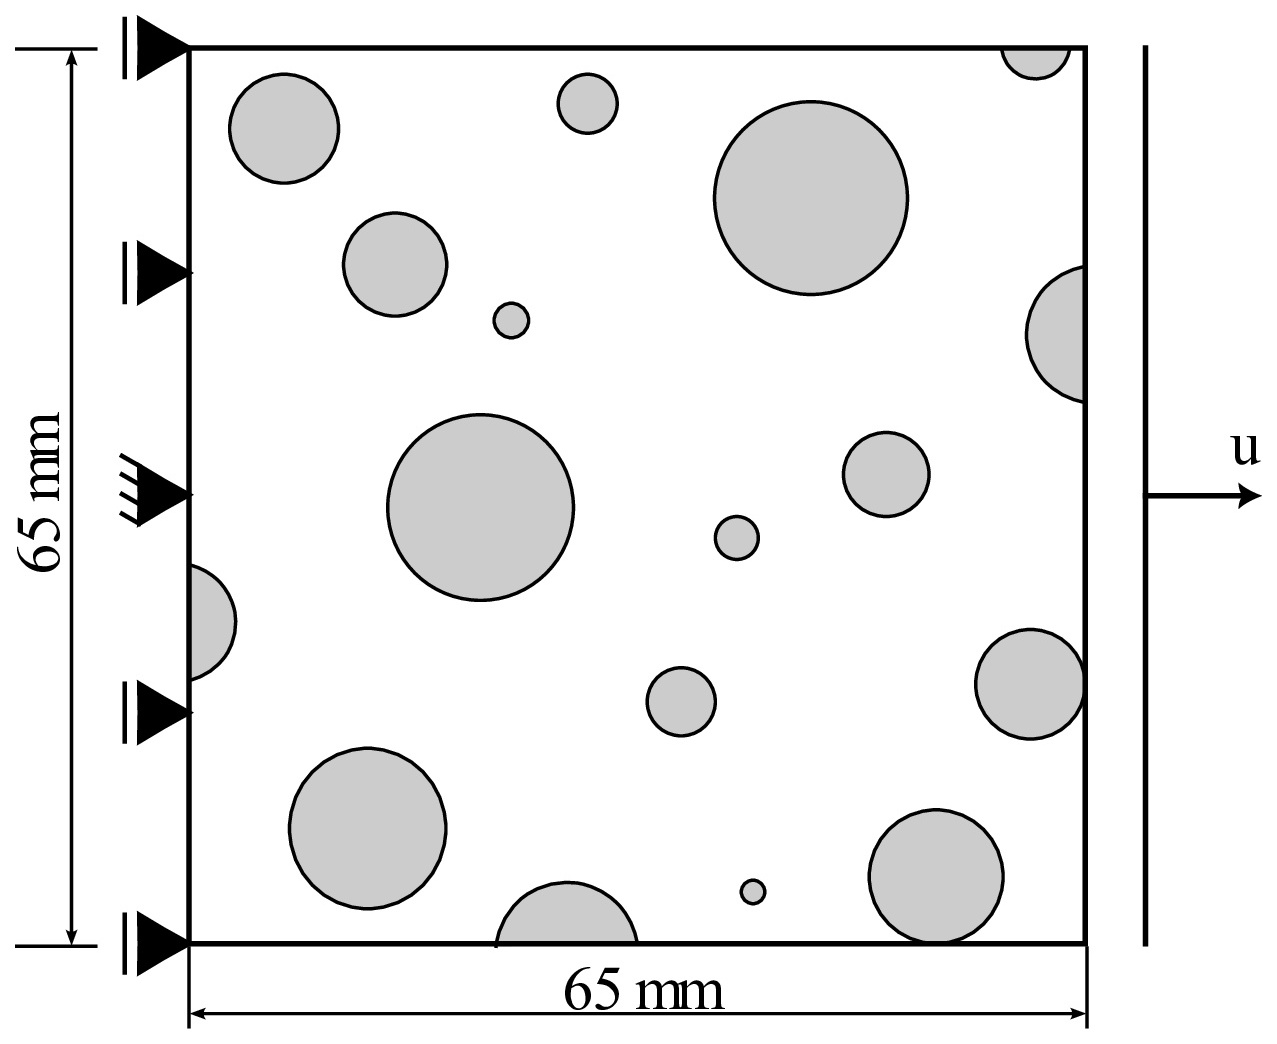
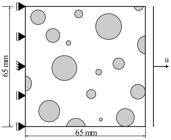
This section will present a series of numerical results obtained from simple tensile tests on RVEs of heterogeneous media. In Section 3.1, the RVEs have two distinct phases, namely aggregates and mortar, while in Section 3.2, the RVEs also present an interface between the materials. All simulations consider the left edge of the model with zero horizontal displacement, and the horizontal displacement of the right edge is incremented by 1.625E-4 mm per analysis step, that is, the prescribed displacement is defined as , where 1.625E-4 mm and denotes the analysis step, ranging from 0 to 200. In this context, the term step refers to the incremental pseudo-time of the analysis, which parametrizes the prescribed displacement applied to the right RVE boundary. A schematic representation of the simulations performed is shown in Fig. 3. Square RVEs measuring 65 x 65 mm were used, with a particle size distribution curve with a minimum aggregate size of 9.5 mm and a maximum aggregate size of 25 mm.
The phase-field model was used for the three constituents of the material with the properties shown in Table 1. The Young’s modulus (E), Poisson’s ratio (), and critical energy release rate () were adopted from Pitangueira (1998), whereas the length scale parameter () was calibrated based on the smeared cracking model reported in that study.
3.1 Specimen with aggregates and mortar
For tests with RVEs containing a cementitious matrix with aggregates, three aggregate fractions were considered: 30%, 35%, and 40%, each analyzed with five different random particle distributions. Figure 4 shows the finite element meshes for each of the distributions for RVEs with 30% aggregates, considering triangular elements with a mean nodal distance of 1.5 mm. This value complies with the recommendation of Miehe et al. (2010), namely , and was required to ensure an adequate representation of the aggregate boundaries, modeled as circular inclusions, using triangular elements. The fifteen meshes analyzed contained, on average, 5044 elements.

Finite element meshes for RVEs with aggregate volume fraction of 30% and different particle distributions.
Each of the five samples of three particle fractions were evaluated in the tensile test considering the pressure load in the fracture region, with = 0.05 MPa, and without considering the presence of this load. The equilibrium curves are shown in Figure 5. It can be seen that the characteristic behavior of RVEs is maintained with the presence of pressure load, making it possible to define a representative envelope of the material's behavior for all cases analyzed. As expected, higher peak loads are achieved in samples with a higher percentage of aggregate, and a decrease in the load factor is observed when the pressure load is considered, since, in this case, there is more load affecting the model for the same displacement increment. It should be noted that the RVEs are numbered from 1 to 5; however, an RVE associated with a given aggregate fraction is not related to an RVE with the same index in another fraction. For each fraction, the enlarged domain is generated as described in Sec. 2.2, and the RVEs are randomly extracted from this domain.

Equilibrium trajectory for RVEs with different particle distributions without pressure load (first row) and with pressure load = 0.05 MPa (second row). RVEs with the same index (RVEi, with i = 1-5) do not represent the same microstructure across different aggregate fractions.
From Fig. 5, it can be observed that, although the characteristic material response is identified in the set of trajectories, some RVEs may exhibit slightly different behavior within the same aggregate fraction. RVE2 (30%), for instance, presented a plateau in the softening regime that was not observed in the other RVEs of this fraction. Such behavior is expected given the randomness in the position and distribution of particles within the RVEs. In some cases, the fracture process, that follows a lower energy path, may result in a smoother crack trajectory, whereas in others it may need to bypass several aggregates, producing a more irregular response. Overall, the variability observed in the softening regime was attenuated by the presence of the pressure load. This may be attributed to the increased driving force introduced in the model, which promoted more pronounced crack propagation and resulted in a sharper drop in the load factor.
Figure 6 shows the phase-field contour plot for the final step of the analysis considering different distributions for a 40% aggregate fraction. It can be seen that the matrix forms a preferential path for the crack, which seeks to deviate from the aggregates. The pressure load caused instability in the crack propagation for almost all RVEs. The phase-field model was efficient in tracking the crack trajectory in all cases. A relevant feature is the crack bifurcation observed in RVE5 (40%) under the combined effect of external traction and a pressure load of MPa. This behavior can be attributed to the random distribution of particles within that RVE, which, under the given loading conditions, favored a propagation pattern characterized by bifurcation. In contrast, the remaining RVEs with the same aggregate fraction exhibited unstable crack propagation under the pressure load, with a preferential path developing along the right edge of the RVE.

Phase-field contour plot for aggregate volume fraction of 40% for five RVEs with random particle distributions: without pressure load (first row) and with pressure load = 0.05 MPa (second row).
A second study sought to evaluate the influence of pressure load magnitude. To this end, a particle distribution was selected for each of the fractions under study, and pressure values between 0.01 MPa and 0.1 MPa were considered. The results of the load versus horizontal displacement curves of the right side of the RVE are presented in Figure 7. A standard behavior of a decrease in the load factor with increasing pressure can be observed. This result is consistent, as the prescribed displacement in the nonlinear solution procedure is kept constant while the magnitude of the applied pressure load increases. Consequently, a smaller load multiplier is required to reach the same displacement level.
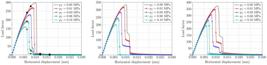
Equilibrium trajectory for different pressure load values: Aggregate volume fraction of 30% (first graph), aggregate volume fraction of 35% (second graph), aggregate volume fraction of 40% (third graph). Black markers in the first graph indicate the selected stages along the equilibrium paths for which the phase-field contours are shown in Fig. 8.
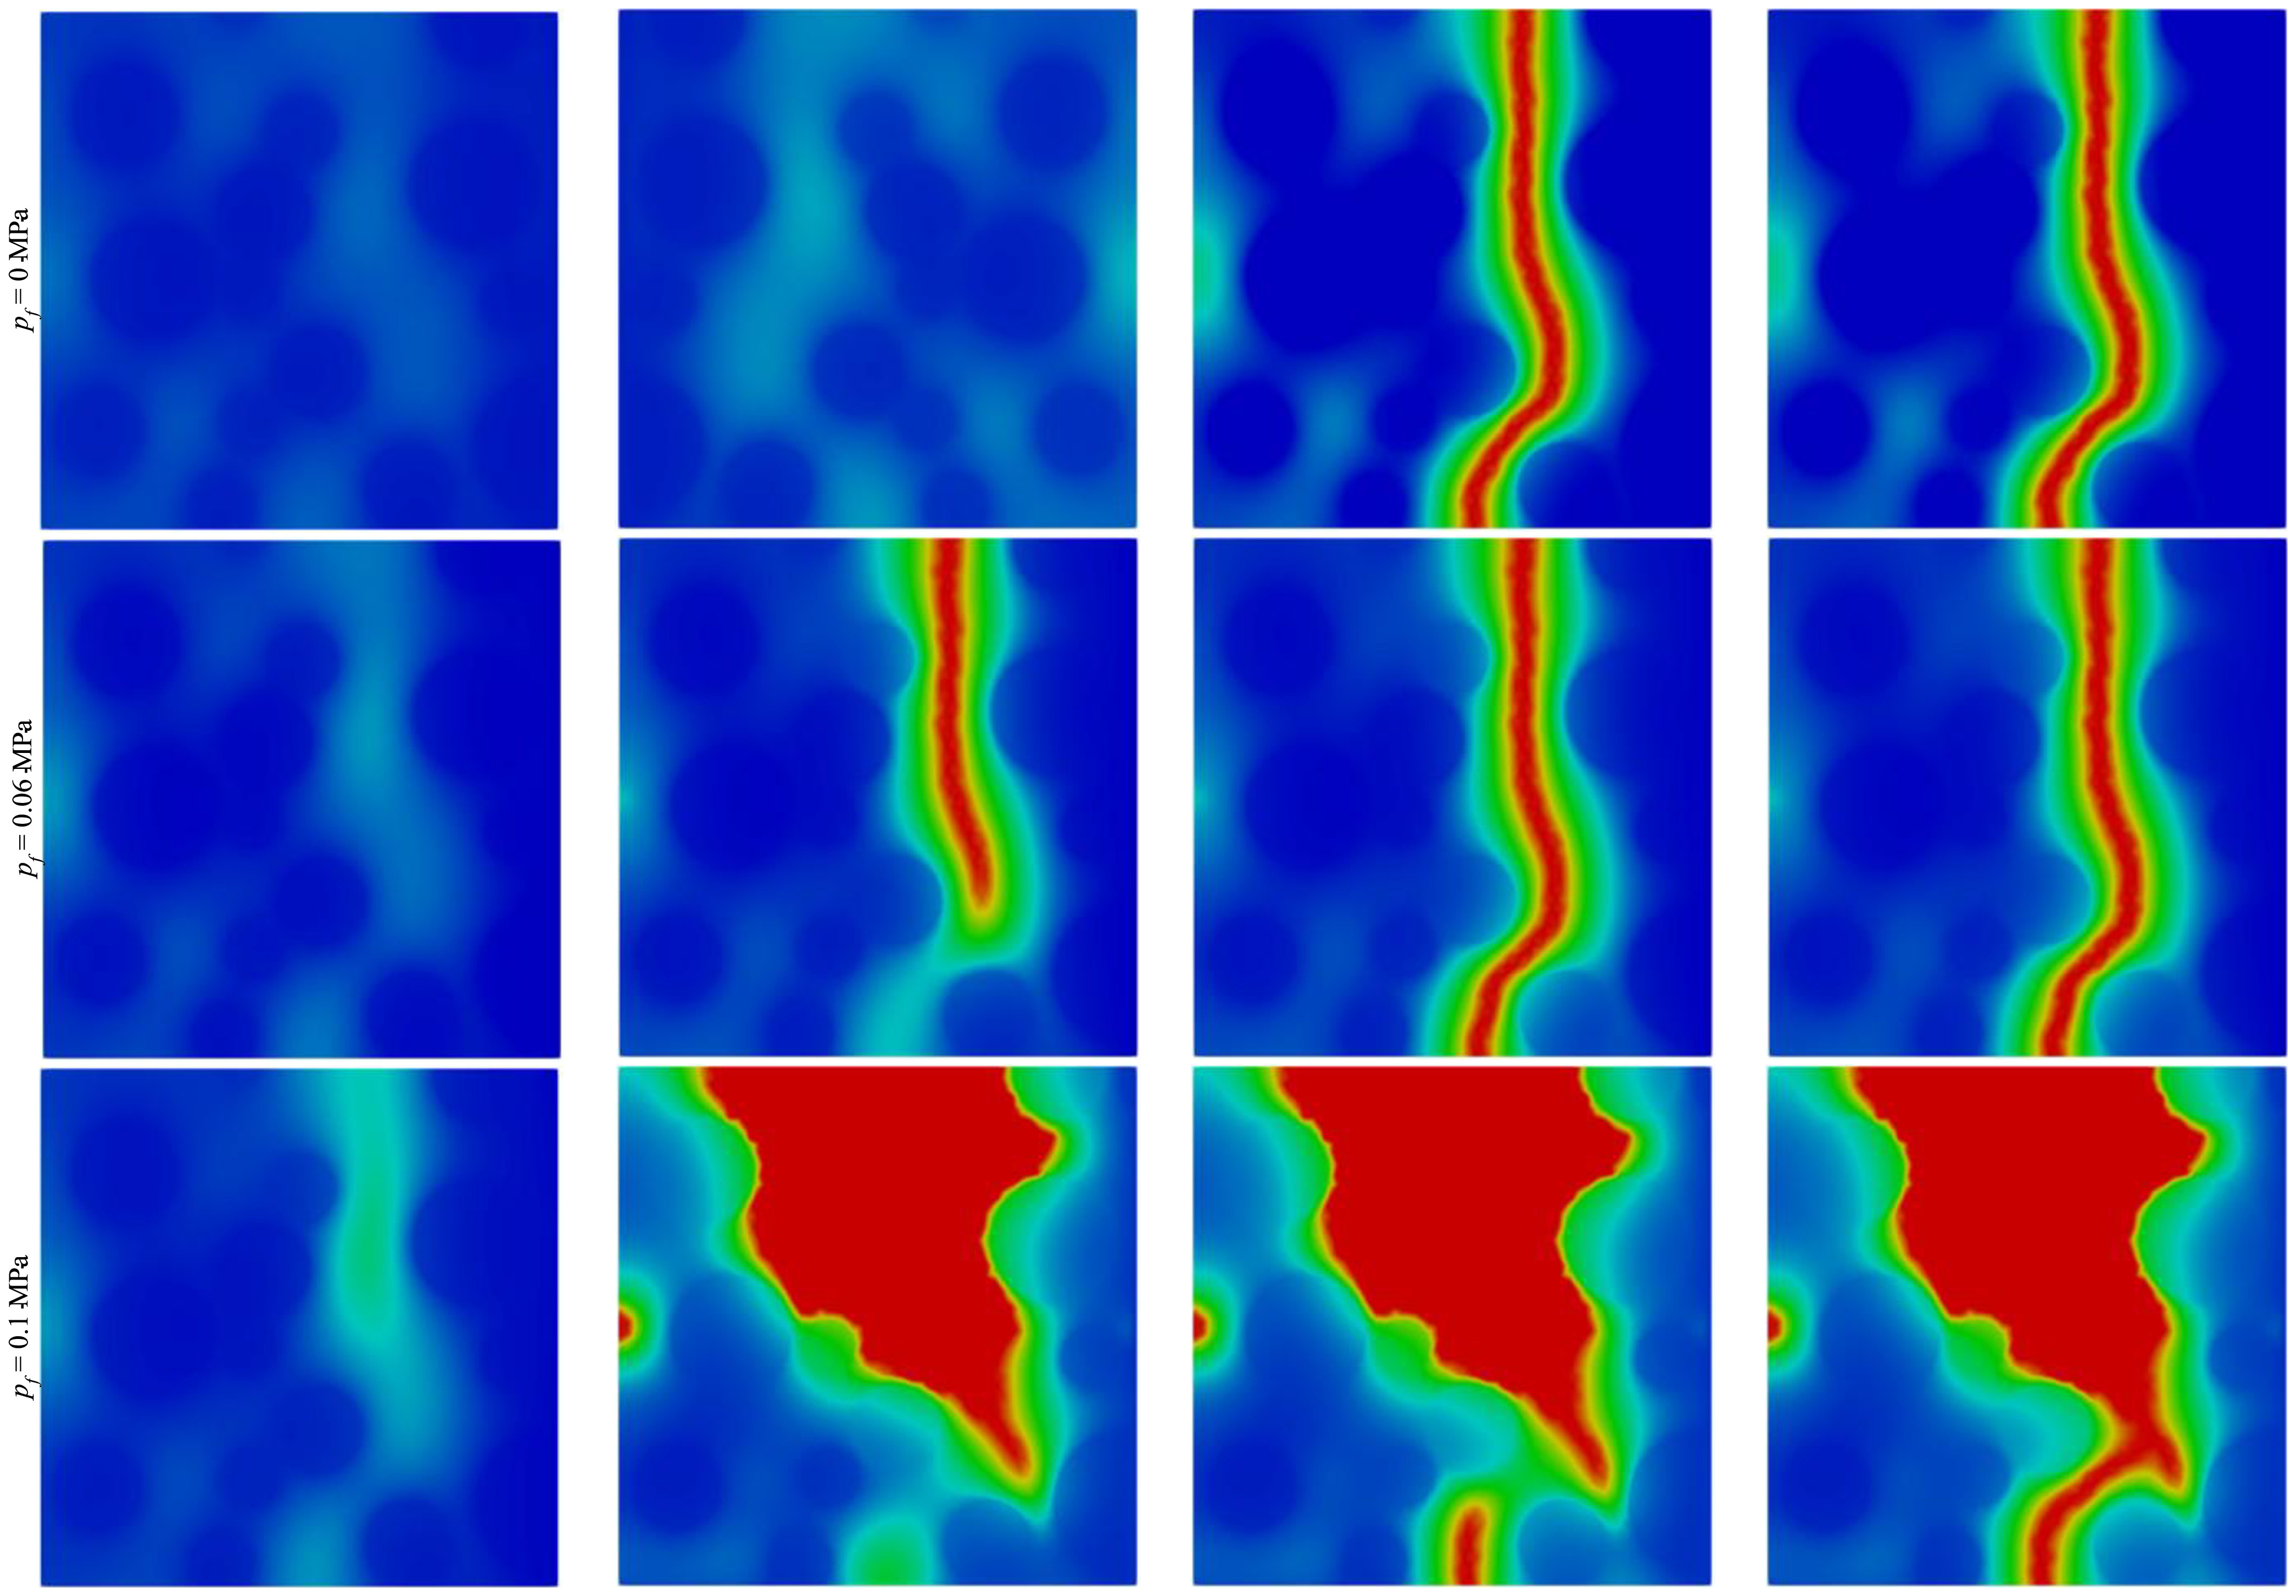
Figure 8 shows the phase-field contour plot for different pressure load values at different steps during the analysis for aggregate volume fraction of 30%. For lower pressure magnitudes, its presence only accelerated the propagation of the crack, without altering its trajectory. Whereas for a higher pressure load, the crack propagates in a more unstable manner, abruptly occupying a large part of the domain.

Phase-field contour plot for aggregate volume fraction of 30%: Step 40 (first column), step 50 (second column), step 75 (third column), step 100 (fourth column).
The markers shown on the three equilibrium trajectories in Fig. 7 indicate the structural states corresponding to each contour plot presented. The same level of horizontal displacement was considered for the different magnitudes of pressure load. For the case without pressure load, the first two contour plots correspond to the ascending branch of the equilibrium curve and therefore exhibit a low level of degradation. In contrast, for the same displacement level, the analyses including pressure load are already in the softening regime, with crack initiation and propagation clearly evidenced in the contour plots. The last two contour plots correspond to the markers located at a near-zero load factor, indicating a fully developed fracture and an almost complete loss of load-carrying capacity across the RVE.
3.2 Specimen with aggregates, mortar and ITZ
Tensile tests on RVE containing matrix, aggregates, and ITZ between materials were performed for only one particle distribution considering an aggregate volume fraction of 35%, as shown in Figure 9(a). In this study, the model was analyzed only with the external tensile load and in combination with pressure loads of 0.01 MPa and 0.03 MPa. The equilibrium trajectories are shown in Figure 9(b). Due to the presence of the interface, which has lower stiffness, the analysis became unstable and stopped converging in the softening regime for = 0.03 MPa. The interface was defined with a thickness of 0.55 mm, and in this region, the triangular elements have a mean nodal distance of 0.1375 mm, keeping the dimension of 1.5 mm in the rest of the mesh. The element size in the interface zone was selected such that its thickness was discretized with at least four elements, ensuring an accurate representation of the phase-field gradient in that region. The adopted mesh consisted of 105992 elements.

RVE with mortar, 0.35 aggregate fraction, and ITZ: (a) Finite element mesh; (b) Equilibrium trajectory for different pressure load values (black markers indicate the selected stages along the equilibrium paths for which the phase-field contours are shown in Fig. 10).
An important aspect observed in the equilibrium trajectories in Fig. 9(b) is that they reach a lower peak load than that recorded in Fig. 7 for the same 35% aggregate fraction in the two-phase model. This behavior can be attributed to the presence of the interface zone, which exhibits a lower critical energy release rate than the surrounding phases (see Table 1). Consequently, the interface represents the energetically favorable path for crack propagation. This effect is further illustrated in Fig. 10, where the crack propagates along the interface zone, circumventing multiple aggregates.

Phase-field contour plot for aggregate volume fraction of 35% with ITZ: Step 45 (first column), step 50 (second column), step 55 (third column), step 60 (fourth column).
Figure 10 illustrates the phase-field distribution in the analyses with and without pressure loading for different horizontal displacement increments. It can be observed that the presence of pressure caused a deviation in the crack trajectory. However, in both cases, the crack propagated preferentially along the ITZs, around the aggregates, crossing the matrix to pass from interface to interface.
The markers shown on the equilibrium trajectories in Fig. 9 indicate the structural states corresponding to the contour plots presented. The second marker, corresponding to the second displacement level, coincides with the peak of the trajectory in the absence of pressure load and therefore exhibits less damage in the contour plot compared to the case with MPa, for which the same displacement level already lies in the descending branch of the equilibrium path. The final contour plot in both scenarios corresponds to a stage where the RVE is fully fractured, as reflected by the negligible load factor recorded in the equilibrium trajectory.
4 CONCLUSION
This paper presented the application of a phase-field model for pressurized fractures in quasi-brittle heterogeneous samples. The model was able to accurately represent traction tests considering two- and three-phase media, namely matrix and aggregates, and matrix, aggregates, and interface, respectively. It was possible to observe complex crack trajectories that deviate from the aggregates, resulting in phenomena such as bifurcation. The pressure load significantly affects crack propagation and equilibrium trajectories, while the characteristic behavior of the RVE responses across different particle distributions is preserved. In general, low pressure load magnitudes only accelerate crack propagation, whereas higher pressures may alter the crack trajectory, often resulting in unstable behavior. Thus, it was possible to verify the ability of the phase-field model to simulate complex crack patterns, even with the presence of hydraulic stimulation within the crack domain, and its application to material samples with constituents of different properties. The applications presented highlight the potential of the model as an efficient approach for multiscale studies of hydraulic fractures, a topic of considerable scientific and practical importance. Future work could apply this model to microscale analysis of complex structural systems, including dams and geological massifs, where material-scale damage and its macroscale effects can be better captured in a multiscale framework.
Acknowledgments
The authors gratefully acknowledge the support from the Brazilian research agencies CAPES (Coordenação de Aperfeiçoamento de Pessoal de Nível Superior), FAPEMIG (Fundação de Amparo à Pesquisa do Estado de Minas Gerais; grant APQ-04173-25), and CNPq (Conselho Nacional de Desenvolvimento Científico e Tecnológico; grant 316240/2021-4). Part of this paper was elaborated during a research stay of the fourth author at Università di Trento (financed by the Coordenação de Aperfeiçoamento de Pessoal de Nível Superior - CAPES - Brasil - grant 88887.910684/2023-00).
Data Availability statement:
Research data is only available upon request.
References
- J. Adachi, E. Siebrits, A. Peirce, and J. Desroches (2007). Computer simulation of hydraulic fractures. International Journal of Rock Mechanics and Mining Sciences, vol. 44, n. 5, pp. 739–757.
- Z. H. Khan, M. A. Hasan, and R. A. Tarefder (2022). Phase field approach to damage and fracture in asphalt concrete using multiscale finite element modeling of an instrumented pavement section. Engineering Fracture Mechanics, vol. 272, pp. 108686.
- K. Seles, A. Jurcevic, Z. Tonkovic, and J. Soric (2019). Crack propagation prediction in heterogeneous microstructure using an efficient phase-field algorithm. Theoretical and Applied Fracture Mechanics, vol. 100, pp. 289–297.
- M. Wheeler, T. Wick, and W. Wollner (2014). An augmented-lagrangian method for the phase-field approach for pressurized fractures. Computer Methods in Applied Mechanics and Engineering, vol. 271, pp. 69–85.
- B. Bourdin, C. Chukwudozie, and K. Yoshioka (2012). A variational approach to the numerical simulation of hydraulic fracturing. Proceedings of the 2012 SPE Annual Technical Conference and Exhibition, vol. SPE 146951.
- B. Bourdin, G. A. Francfort, J-J. Marigo (2000). Numerical experiments in revisited brittle fracture. Journal of the mechanics and Physics of Solids, vol. 48, pp. 797-826.
- P. Wriggers and S. Moftah (2006). Mesoscale models for concrete: Homogenisation and damage behaviour. Finite Elements in Analysis and Design, vol. 42, pp. 623–636.
- Y. Heider (2021). A review on phase-field modeling of hydraulic fracturing. Engineering Fracture Mechanics, vol. 253, pp. 107881.
- B. Bourdin, G. A. Francfort, and J. J. Marigo (2000). Numerical experiments in revisited brittle fracture. Journal of the Mechanics and Physics of Solids, vol. 48(4), pp. 797–826.
- P. Farrell and C. Maurini (2017). Linear and nonlinear solvers for variational phase-field models of brittle fracture. International Journal for Numerical Methods in Engineering, vol. 109, n. 5, pp. 648–667.
- K. Yoshioka, D. Naumov, and O. Kolditz (2020). On crack opening computation in variational phase-field models for fracture. Computer Methods in Applied Mechanics and Engineering, vol. 369, pp. 113210.
- ABNT NBR 7211:2022. NBR 7211 – Agregados para concreto – Requisitos. Technical report, Associação Brasileira de Normas Técnicas, Rio de Janeiro, Brasil.
- Z. Wang, A. Kwan, and H. Chan (1999). Mesoscopic study of concrete I: generation of random aggregate structure and finite element mesh. Computers and Structures, vol. 70, pp. 533–544.
- R. L. S. Pitangueira. Mecânica de estruturas de concreto com inclusão de efeitos de tamanho e heterogeneidade. Phd thesis. Pontifícia Universidade Católica do Rio de Janeiro, 1998.
Edited by
-
Editor:
Elcio Cassimiro Alves e João Victor Fragoso Dias