Assessment of Brazilian highway bridge live load models on five girders decks under free flow and traffic jam conditions
Abstract
The design of Brazilian highway bridges is based on the NBR 7188 code, which prescribes a live load model consisting of a 450 kN truck load and a distributed load of 5 kN/m2, both affected by an impact factor. Previous studies have shown that this load pattern does not adequately reproduce the effects of the real traffic. Two alternative load models that are more appropriate to represent actual Brazilian traffic effects were recently proposed; both were calibrated considering two-girder deck bridges, with span lengths up to 40 m. In such cases, the critical effects are associated with the free flow of heavy vehicles, including dynamic effects. This paper presents the procedures developed to assess the applicability of the previously proposed load models to five-girder bridges, with spans lengths ranging from 30 m to 50 m. For this span range, traffic jam scenarios are included in the analyses. The results indicate that the NBR 7188 load model is unsafe in several situations. Furthermore, one of the load models previously proposed was found to satisfactorily reproduce the effects of real traffic for this new set of bridges.
Keywords:
Highway bridges; traffic simulation; traffic jam; live load models; dynamic analysis
1 INTRODUCTION
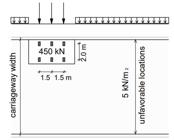
The design of highway bridges in Brazil is based on the NBR 7188 code (ABNT, 2024), which specifies a live load model consisting of the 450 kN vehicle shown in Figure 1, referred as TB-450, combined with a uniformly distributed load of 5 kN/m2, affected by an impact factor to account for dynamic effects. This loading configuration is based on old German design codes and may not adequately represent actual Brazilian traffic conditions (ROSSIGALI et al., 2023).
The objective of live load models is to accurately reproduce the target values of internal forces induced by real vehicular traffic in a representative set of bridges, considering both free flow conditions (including dynamic effects) and traffic jam conditions, in order to ensure consistent reliability levels across the analyzed structures. The calibration process consists of seeking, by optimization procedures, the configurations of these idealized models.
Data collected directly from moving vehicles using weigh in motion (WIM) systems were used to calibrate the live load models of the two main highway bridge design codes worldwide: AASHTO LRFD (2014), in the United States, and Eurocode 1 (CEN, 2005), in the European Union. In both cases, the original collection of road data began several decades ago, in the 1970s and 1980s, respectively (NOWAK, 1993; PRAT, 2001). With the widespread of WIM technology, the development of live load models representative of actual traffic conditions has been pursued in several other countries, including Australia (HEYWOOD et al., 2000), Hong Kong (MIAO and CHAN, 2002), Mexico (GARCÍA-SOTO et al., 2015) and South Africa (VAN DER SPUY and LENNER, 2019).
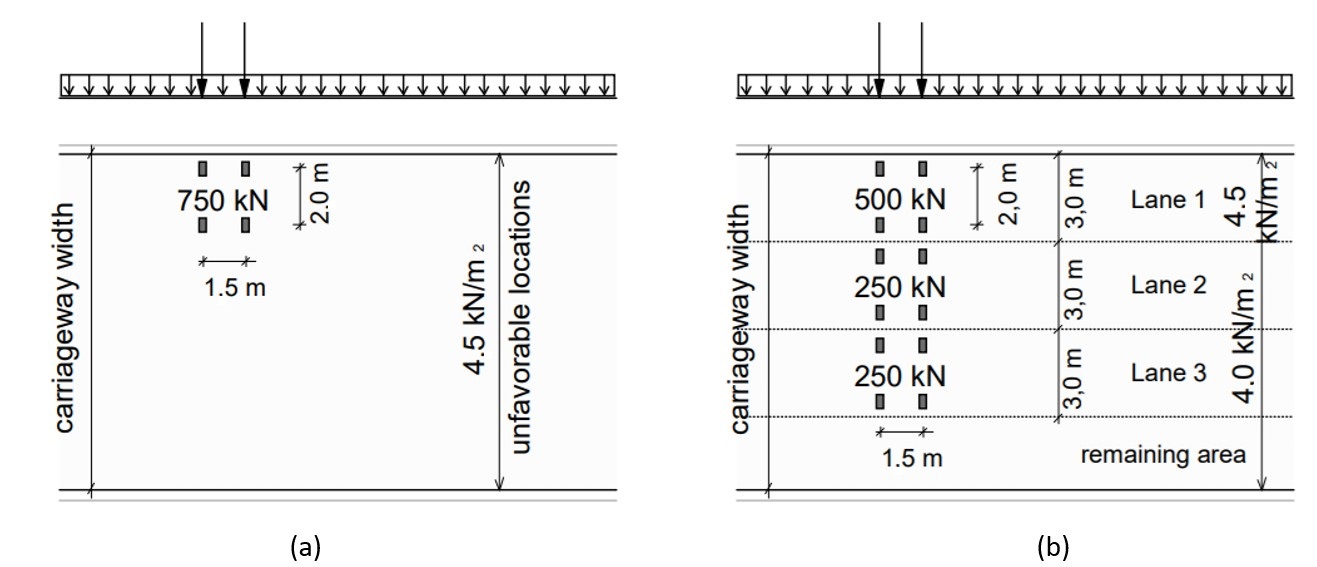
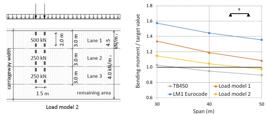
In Brazil, some studies have addressed this issue, although without directly modeling the traffic jam conditions, such as those by ROSSIGALI (2013) and PORTELA (2018). More recently, ROSSIGALI et al. (2023) calibrated two load models (Figure 2) to represent the effects of the actual traffic on two-girder bridges, for three longitudinal schemes: (i) simply supported; (ii) two continuous spans; (iii) cantilever, considering only free flow traffic conditions. The span lengths ranged from 10 m to 40 m for cases (i) and (ii) and from 2.5 m to 10 m for case (iii). According to MENDES (2009), these are the most common structural configurations of Brazilian highway bridges. The model shown in Figure 2a (Model #1) consists of a single vehicle combined with a distributed load, inspired by the loading scheme prescribed by NBR 7188 (Figure 1). The model presented in Figure 2b (Model #2) considers three vehicles, each associated with a traffic lane, in addition to distributed loads, following the concept of the LM1 load model from Eurocode 1 (CEN, 2005).
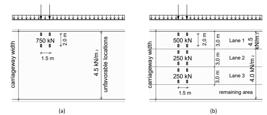
Plan view of the live load models proposed to play actual traffic on short-span 2-girder bridges in Brazil: (a) load model #1; (b) load model #2, with 3 traffic lanes. Units: m (ROSSIGALI et al., 2023, OLIVEIRA, 2019).
For short-span bridges, the critical loading cases are generally induced by the passage of heavy vehicles in free flow conditions, including the corresponding dynamic amplification effects. For longer spans, however, heavy vehicles can occupy the bridge with all their axles making the critical loading cases dependent on the simultaneous presence of several vehicles - including cars - under traffic jams or mixed flow conditions (PRAT, 2001; CAPRANI et al., 2008; O’BRIEN and ENRIGHT, 2011; O’BRIEN et al., 2012; WU et al., 2015; CAPRANI et al., 2016; SORIANO et al., 2017). The threshold span length separating these two situations typically lies between 30 m and 50 m (O’CONNOR e O’BRIEN, 2005; CAPRANI, 2013).
Research on live load models emphasizing traffic jam modeling, as well as studies evaluating their performance, is still at an early stage in Brazil. LUCHI (2006) performed traffic simulations for simply supported bridges with spans ranging from 30 m to 200 m, considering only traffic jam mode, and reached the following conclusions:
-
for bridges with three or four traffic lanes, the design according to NBR 7188 is overly conservative in most situations;
-
for bridges with two traffic lanes in the same direction, the NBR 7188 design model is safe only when the spacing between vehicles is greater than 5 m;
-
for two-lane single carriageway bridges, the design according to NBR 7188 is safe only when the spacing between vehicles exceeds 10 m; however, this situation would already be associated with dynamic amplification effects caused by higher speeds.
Since load models should adequately reproduce the effects of actual traffic on as many bridges configurations as possible, the representativeness of the live load models shown in Figure 2 should also be investigated for other structural systems and longer span lengths. If these models do not fulfill this goal in an acceptable manner for the new set of structures, a new model could be calibrated, based on a broader set of reference structures. Alternatively, a specific model could be calibrated for this new class of structures, provided that the adoption of different models for different situations is justified.
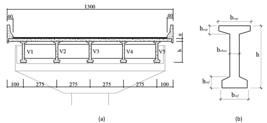
The objective of this study is to evaluate the adequacy of the live load models shown in Figure 2, originally developed for short-span two-girder bridges (ROSSIGALI et al., 2023), in reproducing the target load effects for a new representative set of highway bridges. The analyzed structures are prestressed concrete grid bridges consisting of 5 girders (Figure 3a), with intermediate and support cross beams. The following structural systems are considered: simply supported bridges and 2-span continuous bridges, with span lengths of 30 m, 40 m and 50 m. The girders consist of precast I-shaped cross section commonly used in these structural systems, as shown in Figure 3b. Although less common than two girders’ bridges, these structures still represent a significant amount of Brazilian network’s road structures. Within this span range, both free flow and traffic jam must be considered in the analysis.
2 METHODOLOGY
The first step in verifying the adequacy of the proposed load models for a new set of structures and different traffic conditions is to evaluate the static effects of the real traffic by calculating the critical internal forces in the structural models of the analyzed bridges, subjected to numerically simulated traffic loading. The traffic database used to represent actual traffic conditions is the same as that adopted in the development of the proposed live load models and was established by ROSSIGALI et al. (2015).
Probability distribution functions (PDFs) are fitted to the histograms of critical effects, which are extrapolated to specified return periods. Both free flow and traffic jam analyses are considered for nine different traffic scenarios. In free flow analyses, dynamic effects are taken into account. For this purpose, vehicle-pavement-structure dynamic interaction analyses are carried out.
Once the target values of the load effects in the analyzed bridges have been established, they are compared with the effects generated in the same structures by the proposed load models, in order to assess their suitability for the new set of bridges. Additional comparisons are performed using the load model of NBR 7188 and the load model LM1 from Eurocode 1.
3 STRUCTURAL MODELS
As shown in Figure 3, bridge decks are 13 m wide, corresponding to the current standard adopted by the National Department of Transportation Infrastructure (DNIT). The spacing between adjacent girders is equal to 2.75 m and the deck slab thickness is 20 cm. The dimensions of the I-girders and rectangular cross beams are presented in Table 1 for each span length and structural configuration, identified as S for simply supported and C for 2-span continuous spans. The concrete compressive resistance fck is assumed equal to 30 MPa.
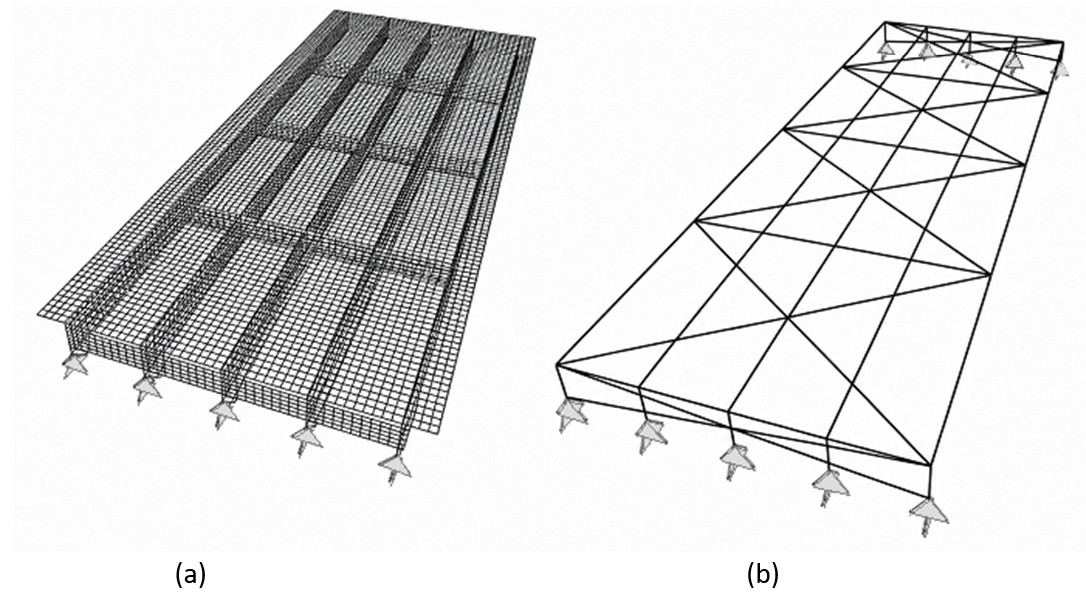
The numerical bridge models consist of quadrilateral shell finite elements used to represent the slab, the girders and the cross beams, as shown in Figure 4a. The boundary conditions are simulated by restraining translations along the x, y and z axes at each support point.
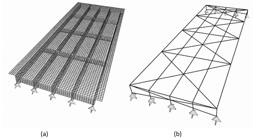
Due to the high computational effort required for the various structural analyses of the simulation, the shell models are used only for the calibration of equivalent structural grid models (Figure 4b), which are then employed in the analyses. The equivalent grid models are adjusted to reproduce the shell model responses in terms of displacements and natural frequencies.
In the grid model, the bridges girders and cross beams are modeled by bar elements. The geometric properties of the I-girders take into account the slab effective width. In addition, massless diagonal bar elements are introduced in the horizontal plane to simulate the high in-plane stiffness of the deck slab. The properties of these elements are defined through calibration to achieve agreement between the results obtained from the two modeling approaches.
Table 2 presents the comparison between the results obtained from the shell and grid models. The maximum deflections of girder V5 (see Figure 3) caused by the application of a uniformly distributed load 100 kN/m on girders V1, V2 and V3 are depicted for both models showing good agreement, with maximum difference of 15% for the larger displacements. The correlation between the natural frequencies associated with the first and second bending vibration modes (B in Table 2) and torsional modes (T in Table 2) is considered satisfactory. Additionally, to verify the compatibility between grid and shell models under eccentric point loads, results from both models are compared in terms of midspan deflections for bridges B-30 and B-50 due to the axles loads of the TB450 vehicle (see Figure 1). The vehicle was positioned at midspan and transversely placed in the most unfavorable location above girder V1. Table 3 presents the results showing excellent agreement between the models, with only a 1% difference in the deflection of girder V1 and a maximum difference of 6% for the deflection of girder V3. Therefore, the grid models are regarded as equivalent to the corresponding shell models for performing the static analyses of the traffic simulations as well as the dynamic analyses associated with free flow traffic conditions.
Deflections of girders V1, V2 and V3 caused by the application of TB450 vehicle axles loads.
4 TRAFFIC DATABASE
The applied traffic database used in this study (ROSSIGALI et al., 2015) was developed from weighing traffic data collected at various locations throughout Brazil and is, therefore, considered representative of the traffic circulating on country’s highways. Information such as vehicle speed and axle loads was obtained using static scales at weighing stations, as well as weigh-in-motion equipment. A brief description of the database is presented below.
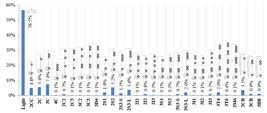
Traffic composition
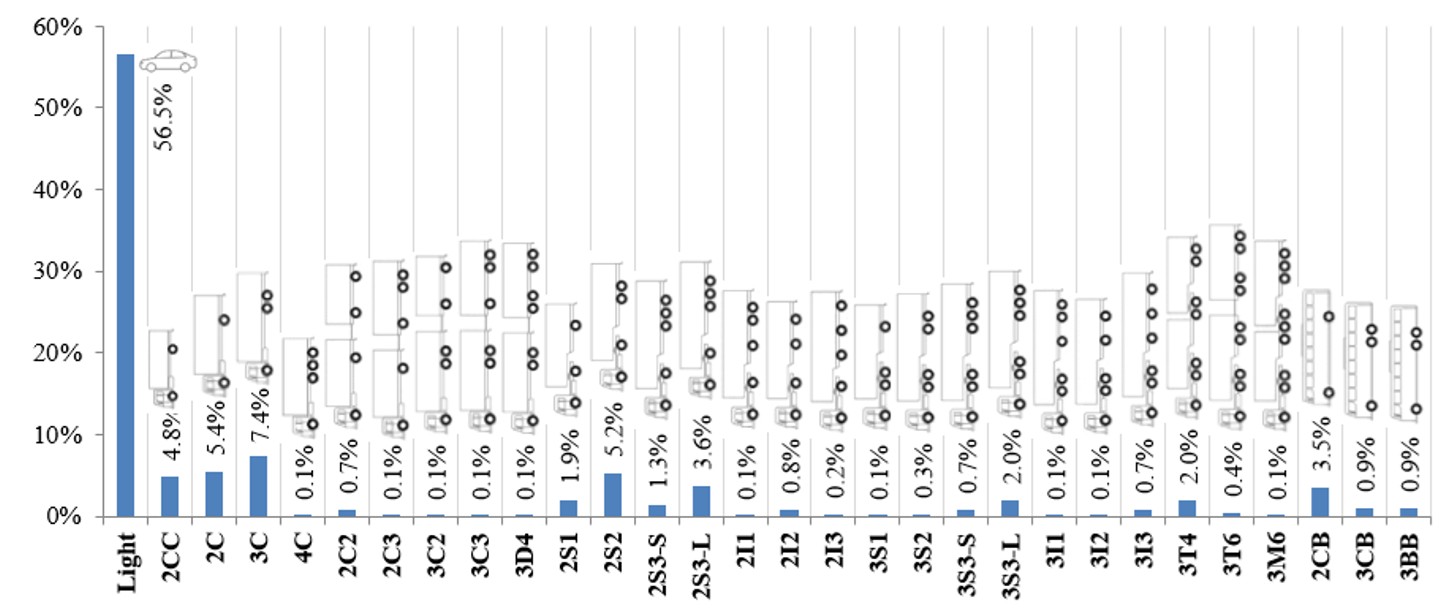
The database consists of 30 vehicle configurations, illustrated in Figure 5 together with their relative frequencies. The only non-commercial category is designated as “Light”, which includes passenger vehicles and pick-ups (utility vehicles).
Gross vehicle weight (GVW) and axles weights
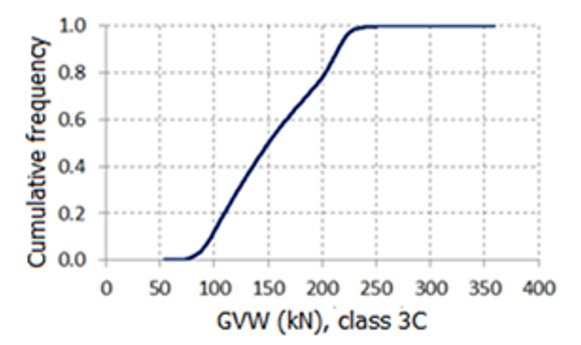
To simulate bridge traffic loading, continuous probability distributions were fitted to the gross vehicle weight (GVW) data for each vehicle class. Figure 6, for example, presents the cumulative distribution function (CDF) adjusted for vehicle 3C. The most appropriate curve to represent each random quantity was selected from among commonly used statistical models through goodness-of-fit tests. Table 4 shows the distributions adjusted to the GVW of selected vehicle classes.

Axle weights within each vehicle class were also treated as random variables. To avoid the use of correlation matrices, scatter plots relating the weight of each axle group to the corresponding GVW were analyzed for each vehicle class. These relationships were subjected to adjustments by least squares regression lines.
Wheelbases
Most of the vehicle wheelbases were modeled as random variables with their distributions fitted using goodness-of-fit tests, as described for the GVWs. Table 5 shows the fitted probability density functions (PDFs) for some of these wheelbase distances. In the case of grouped axles or small coefficient of variation, the distances were treated as deterministic.
5 TRAFFIC SIMULATION FOR STATIC ANALYSIS
The computational tool developed to obtain the structural internal forces generated by real traffic consists of two steps. First, all vehicle characteristics required for the simulation - such as vehicle class, speed, wheelbases, GVW and axle weights - are generated using the Monte Carlo technique, providing random realizations of traffic streams. Next, the generated vehicles are moved along the analyzed structure, and the internal forces at critical cross sections are recorded. The resulting force values are then summarized in the form of histograms.
In the free flow, the time headway between consecutive vehicles is modeled as a random variable. In traffic jam conditions, the distance between the rear bumper of the previous vehicle and the front bumper of the later vehicle is treated as a random variable instead of time.
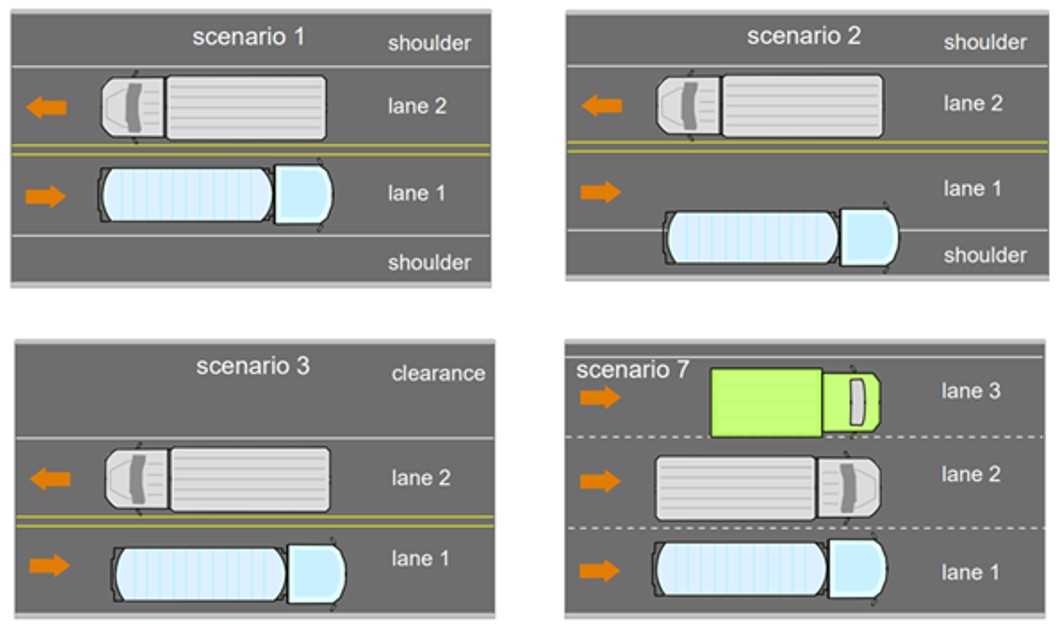
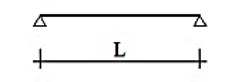
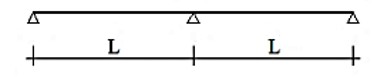
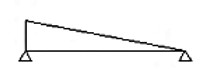
Table 6 presents the internal force effects considered for simply supported and two-span continuous bridges: shear force at supports, bending moments at midspans and intermediate supports. Traffic simulations and corresponding static analyses are performed for 9 traffic configurations (ROSSIGALI et al., 2023), some of which are illustrated in Figure 7. Scenario 1 represents the most frequent traffic configuration while Scenarios 2, 4 and 6 are considered as possible persistent situations. Special temporary situations such as construction works may generate configurations such as Scenarios 3, 5, 7 and 9.
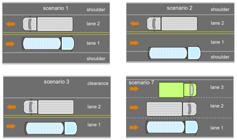
The characteristic values of the internal static forces are determined by extrapolating Weibull distributions fitted to their histograms as obtained from the simulations (O’CONNOR and O’BRIEN, 2005; O’BRIEN et al., 2010; ENRIGHT and O’BRIEN, 2013; LEAHY et al., 2015; O’BRIEN et al., 2015). Return periods of 100 years are adopted for Scenarios 1, 2, 4, 6 and 8 (usual situations) while a 10 years return period is used for Scenarios 3, 5, 7 and 9 (special situations) (NOWAK, 1995; DAS, 1997; CALGARO, 1998; PRAT, 2001). The maximum value among all scenarios is adopted as the characteristic value of each static effect (ROSSIGALI, 2013).
6 FREE FLOW SIMULATIONS
Free flow simulations were performed for a period of 30 consecutive days. Light vehicles were removed from the database. The time between successive vehicles was modeled by a gamma distribution (O’BRIEN and CAPRANI, 2005; LIU et al., 2017; SORIANO et al., 2017) with a coefficient of variation equal to 0.5. The average daily truck traffic (ADTT) of commercial vehicles in the adopted database is 7,019 commercial vehicles, referred to as reference flow (RF). The adopted traffic flow distribution per lane is shown in Table 7, according to ROSSIGALI (2013).
Table 8 shows the maximum static effects obtained in the reference sections and the vehicles that have caused these effects. For all but two bridges, the maximum static effects are attained for the presence of 2 simultaneous heavy vehicles. Classes 3T4, 3T6, 2S3-S and 2S3-L are generally among the configurations that lead to maximum effects.
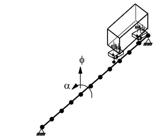
The analysis of vehicle-pavement-structure dynamic interaction is required to complement the static analysis in the free-flow simulations. For this purpose, vehicles are represented as assemblies of rigid bodies connected by springs and dampers. The dynamic analyses are performed using stick models (Figure 8), which are calibrated for each structure based on the bending and torsional vibration modes of the corresponding equivalent grid models (Figure 4b).
An asphalt pavement with medium roughness and a 3 cm step at the bridge entrance are considered to simulate the settlement of the approach slab (ROSSIGALI et al., 2023). The vehicle-pavement-structure dynamic interaction analyses provide values for the Dynamic Amplification Factor (DAF), defined as the ratio between the maximum dynamic effect and the corresponding static effect:
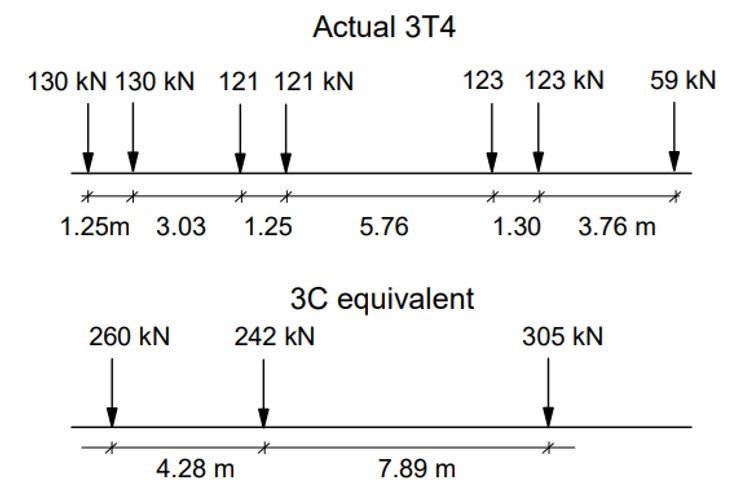
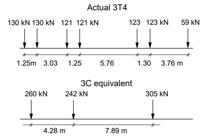
The DAF is applied to the characteristic values of the load effects. The dynamic analyses are performed using a simplified procedure based on the 3C vehicle configuration, since the adopted analytical-numerical model was experimentally validated only for this class of vehicles (ROSSIGALI et al., 2023). In this approach, idealized 3C vehicles are considered equivalent to the actual vehicles in terms of mass, stiffness and damping. Figure 9 presents the axles loads and wheelbases of an example of equivalent 3C vehicle. These characteristics are detailed in Table 9 for the four heaviest and most frequent vehicle classes (2S3-S, 3S3-L, 3T4 and 3T6), where dij indicates the distance between axles i and j and P represents the axle load. Two-dimensional models of a heavy vehicle from each class and of their corresponding equivalent 3C vehicle, both modeled as multi-degree of freedom mass-spring- damper systems, were compared in terms of fundamental natural frequencies to verify their equivalence as mechanical systems interacting with the bridge structure. Table 10 presents the results for the sprung mass bounce, unsprung mass hop and pitch vibration modes. The first two modes show very good agreement, with a maximum deviation of 16% observed for the bounce mode of the 3T6 vehicle. The differences in the third mode are significantly larger; however, these frequencies lie well above the range of the natural fundamental frequencies of the bridges (see Table 2). Therefore, given the focus on the bridge response, it is concluded that equivalent 3C vehicles can be used to estimate FAD values.
Natural frequencies (Hz) of the actual vehicles and of the corresponding equivalent 3C vehicles.
The adopted DAF for each structure is taken as the maximum value obtained from the analyses considering the 3C equivalent vehicles corresponding to the aforementioned vehicle classes, each traveling individually on the bridges, at different speeds: 40, 60, 80, 100 and 120 km/h. Table 11 shows the characteristic values of the static forces and the dynamic amplification factors. The target values of the effects in free flow conditions are given by the product of these two quantities.
DAF and characteristic values of internal forces in free flow analysis for 5-girder bridges.
7 TRAFFIC JAM SIMULATIONS
In addition to traffic jams, congested traffic encompasses several distinct conditions, including platoons, stop-and-go waves, oscillatory congestion, and full-stop traffic (CAPRANI et al., 2016). Most of these conditions involve acceleration, braking, overtaking, and lane-changing maneuvers, which are particularly relevant for long-span bridges. However, most design codes do not address such structures. For instance, Eurocode 1 applies to bridge spans of up to 200 m. The Eurocode live load model was developed based on simulations of congested traffic moving at low speeds and fully stopped traffic with constant axle-to-axle spacing of 5 m (PRAT, 2001). In the present study, only slow-moving traffic is considered, whereas fully stopped traffic will be investigated in future work.
For the case of traffic jam simulations, light vehicles are included. The speed of all vehicles is assumed to be constant and equal to 10 km/h. The distance between subsequent vehicles is modeled by a beta distribution (BAILEY and BEZ, 1999; ZHANG and QUILLIGAN, 2020) within the range [1 m; 10 m], with a mean value equal to 3.0 m and a standard deviation of 1.5 m. Light vehicles are considered using deterministic values for the wheelbase (2.51 m), total weight (12.95 kN), total length (4.00 m) and distance between axle ends (1.47 m).
Since traffic is generally congested only during part of the day (typically peak hours), the number of vehicles in traffic jams per day is assumed as 15% of the reference flow (RF). When light vehicles are included, the ADTT of the database becomes 16,136 vehicles per day; therefore, the daily number of vehicles in each lane is limited to 2,420 vehicles. For multiple lanes in the same direction, the slower lanes (right lanes) typically present a higher percentage of trucks (WANG et al., 2024) and, therefore, a lower traffic flow compared to the faster lanes. Table 12 presents the adopted distribution of the total flow among lanes (OLIVEIRA, 2019).
The procedure for determining the characteristic values of the static effects in the case of congested traffic conditions is similar to that adopted for the free-flow case. However, two key differences are introduced: traffic jam simulations are performed for a total period of 100 consecutive days, and dynamic effects are not considered. Table 13 summarizes the maximum static effects at each reference cross section, as well as the corresponding number of vehicles on the bridge at the relevant time instant. Among the scenarios presented in Table 13, Scenarios 6 and 7 are the most frequent, as both correspond to three traffic lanes in the same direction. Lane #1, which has the highest proportion of commercial vehicles, generates the most severe effects in girder V1, located next to the lateral edge of the bridges.
8 SUMMARY OF TARGET VALUES
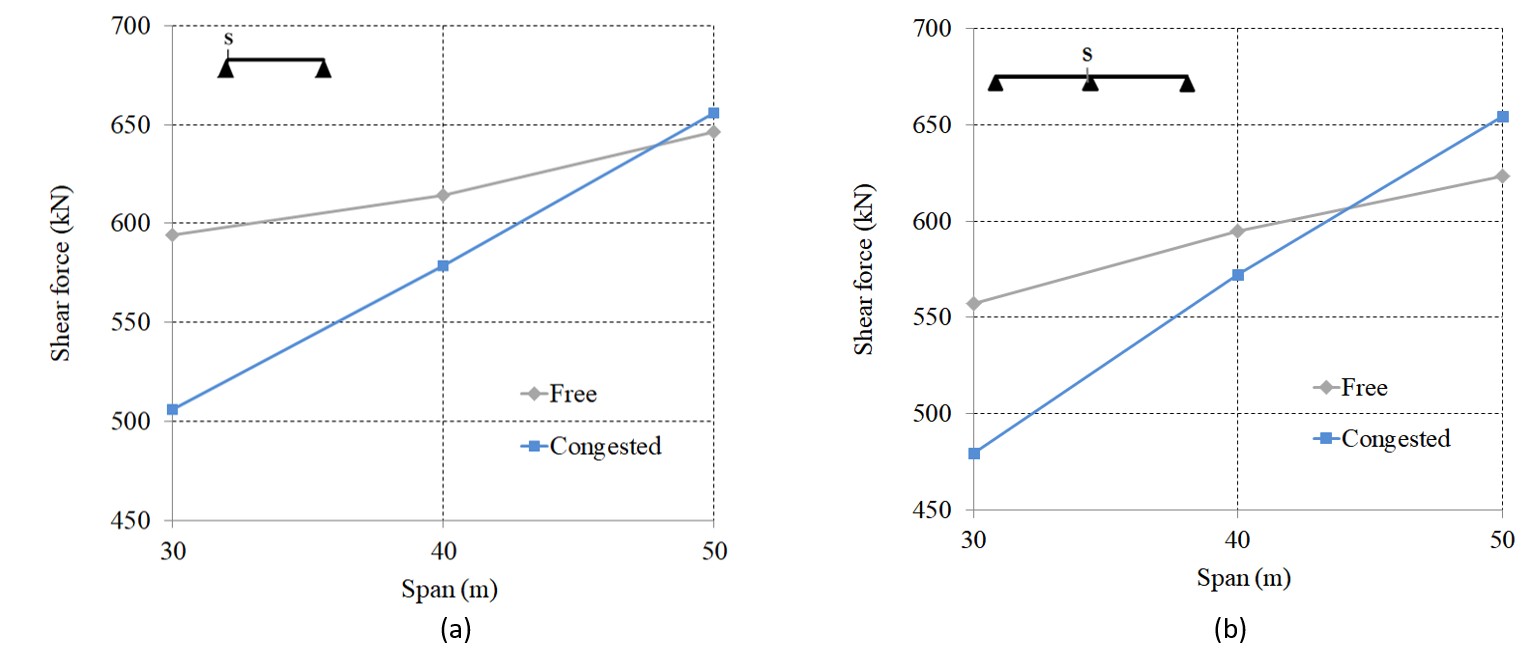
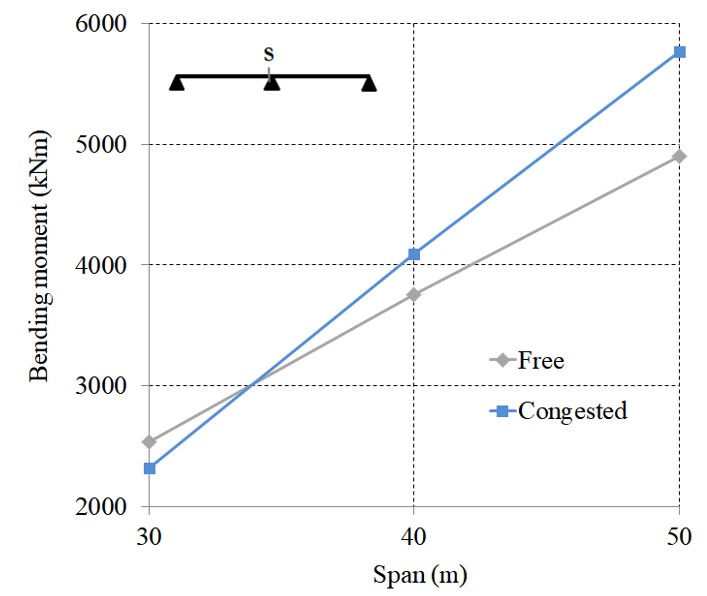
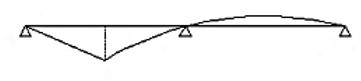
Figures 10 to 12 show the comparison between the results depicted in Tables 10 and 12. In most cases, the maximum effects are associated with free flow conditions for span lengths up to 40 m and with traffic jam for span length equal to 50m. The exceptions are: (a) the positive bending moment of continuous bridges, for which the free flow conditions generate higher effects in all cases, and (b) the negative bending moment in continuous structures, for which the transition from governing free flow to congested flow conditions occurs between 30 m and 40 m. In both cases, the shape of the corresponding influence line helps to explain the results (Table 5), considering that the spacing between vehicles in the traffic jam simulation is smaller than the bridge spans. In case (a), the influence line exhibits a sign change across adjacent spans, making the free flow conditions more critical, since in traffic jams some axle loads act in the favorable direction, reducing the midspan bending moment. In case (b), the traffic jam conditions become critical because all axle loads act unfavorably for this influence line; this accumulation overcomes the effect of dynamic amplification.
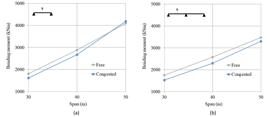
Comparison of target values of positive bending moment in free and jam flows: (a) simply supported bridges; (b) continuous bridges
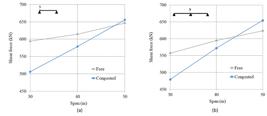
Comparison of target values of shear force in free and jam flows: (a) simply supported bridges; (b) continuous bridges
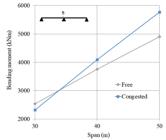
Comparison of target values of negative bending moment in free and jam flows: continuous bridges
9 COMPARISON BETWEEN THE TARGET VALUES AND THE LOAD MODELS EFFECTS
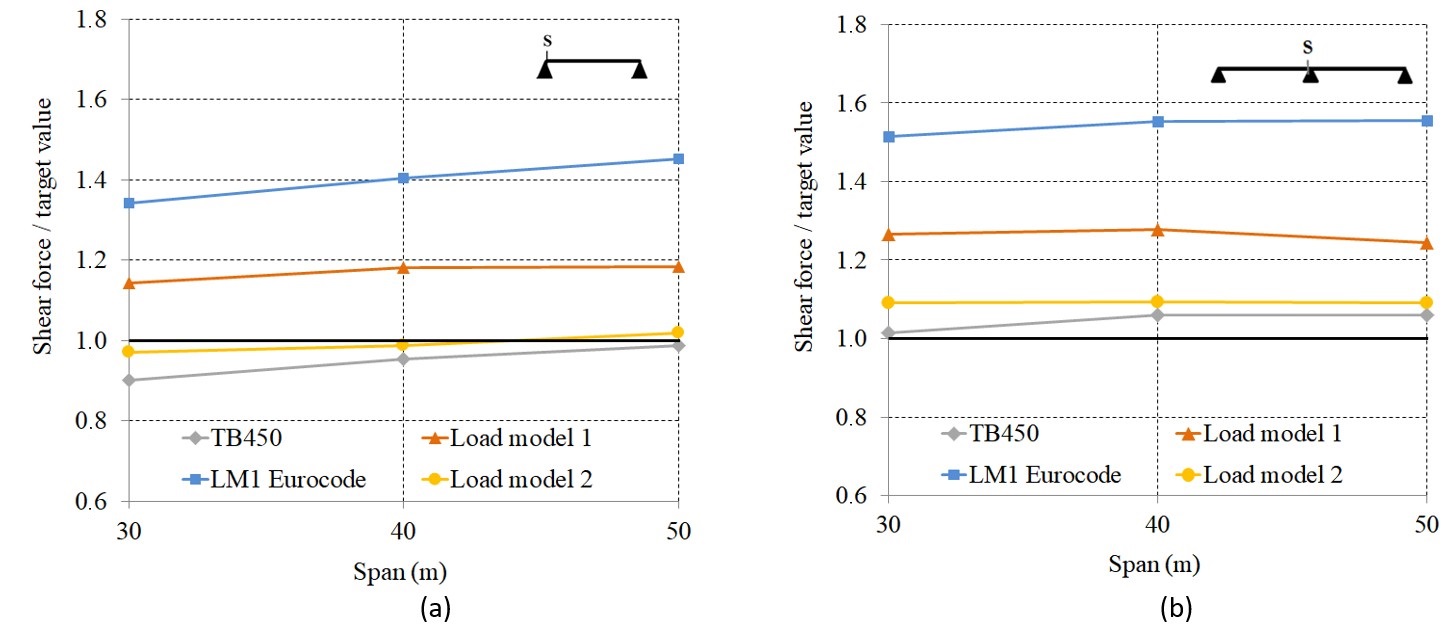
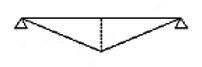
Figures 13 to 15 present the ratio between the static effects (see Table 5) generated by load models #1 and #2 (Figure 2) on the five-girder bridges and the corresponding target values. For comparison purposes, the Eurocode 1 LM1 load model and the NBR 7188 model (Figure 1) results are also shown; in the latter, the vertical impact coefficient is already included to account for dynamic effects. In each case, the target value is taken as the maximum between the free flow and traffic jam results (Figures 10 to 12).
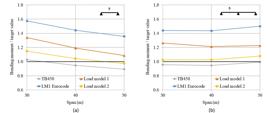
Ratio of the positive bending moments generated by the load models to the corresponding target values: (a) simply supported bridges; (b) continuous bridges
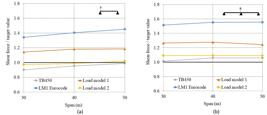
Ratio of the shear forces generated by the load models to the corresponding target values: (a) simply supported bridges; (b) continuous bridges
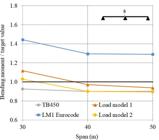
Ratio of the negative bending moments generated by load models to the corresponding target values: continuous bridges
Regarding the proposed load models, it is noted that Model #2 provides a more accurate representation of the actual traffic effect compared to Model #1, as it is composed of three traffic lanes; consequently, the greater number of optimization parameters favors the achievement of a more representative solution. Although initially calibrated for two-girder bridges subjected to free flow conditions, Model #2 can also be considered to satisfactorily represent traffic effects on five-girder bridges, in the span range addressed in this work. Except for the negative bending moments in continuous bridges with span lengths of 40 m and 50 m, Model #1 tends to be overly conservative.
It is also noted that the effects due to the NBR 7188 design load model, as well as those generated by Load Models #1 and #2, are significantly lower than those produced by the LM1 load model from Eurocode 1. However, comparisons involving load models from different design codes must be made with caution. In this case, it is worth mentioning that the Eurocode’s LM1 is calibrated for a 1,000 years return period, whereas Load Models #1 and #2 are associated with return periods of either 100 years or 10 years, depending on the traffic scenario considered.
It is also observed that, although the results obtained using the NBR 7188 load model are generally close to the target values, in most cases it underestimates the effects of actual traffic. This conclusion was already drawn in the case of two-girder bridges, particularly for small spans and cantilevers configurations (ROSSIGALI et al., 2015) as well as for the box-girder bridges analyzed by LUCHI (2006).
10 CONCLUSIONS
This paper describes some of the steps that support the updating of the Brazilian design code for highway bridges, which may not adequately represent the Brazilian vehicle traffic in certain situations.
Based on an equivalent grid structural model, simulations of free-flow and traffic jams conditions are performed to obtain histograms of the static effects at critical reference cross sections. The characteristic values of these static effects are determined by extrapolation of the adjusted frequency distributions of the internal forces. In the case of free flow conditions, dynamic analyses are also performed, considering the vehicle – pavement – bridge structure interaction to obtain dynamic amplification factors representative of heavy traffic. These factors are then applied to the characteristic values of the static effects yielding the corresponding target values.
The transition of the governing flow condition from free flow to congested traffic occurs between 40 m and 50 m for most cases and between 30 m and 40 m for one specific effect, corroborating the assertions of O’CONNOR and O’BRIEN (2005) and CAPRANI (2013) who indicate that this transition lies in the span range of 30-50 m.
Two live load models previously proposed to represent actual Brazilian traffic, calibrated exclusively based on free flow conditions in small-span two-girders grid bridges, are used as reference for the comparative analysis in this study. It is found that Load Model #2, which incorporates three traffic lanes and is similar to the configuration of the Eurocode 1 LM1 model, satisfactorily represents real traffic effects also in medium-span five-girders grid bridges, widely used in the Brazilian road network, except for negative bending moments in 40 m and 50 m spans. In fact, the latter was not reproduced in the safe side by any of the analyzed load models.
It is also shown that, for the structures considered in this study, the NBR 7188 load model provides an acceptable representation of actual traffic effects; however, in most cases on the unsafe side. The underestimation of real traffic effects by Brazilian design code has already been pointed out in previous studies and the extension of this conclusion to five-girder bridge configurations suggests that it would be appropriate to review the NBR 7188 load model.
Future works include the analysis of the vehicle-pavement-structure dynamic interaction considering models developed for the vehicles 2S3, 3S3, 3T4 and 3T6, the updating of the traffic databases and the improvement of traffic simulation including the full stop condition. Structural reliability analyses of the bridges with the aim of calibrating safety factors to achieve consistent probability of failure in the analyzed structures and the assessment of the applicability of the proposed load models for other structural systems and span ranges are also planned.
Acknowledgements
Authors would like to thank Brazilian agencies CNPq (National Council for Scientific and Technological Development) and Capes (Coordination for the Improvement of Higher Education Personnel), which funded the development of this research in the form of a doctoral grant from the first author and a master grant from the third author, respectively.
-
Data availability statement:
Research data is available in the body of the article
References
-
Bailey, S. F.; Bez, R. (1999). Site specific probability distribution of extreme traffic action effects. Probabilistic Eng. Mech., v. 14, p. 19–26. http://doi.org/10.1016/S0266-8920(98)00013-7
» http://doi.org/10.1016/S0266-8920(98)00013-7 - Brazilian Association of Technical Standards – ABNT (2024). NBR7188 - Road and pedestrian live load on bridges, viaducts, footbridges and other structures, Rio de Janeiro, Brazil.
- American Association of State Highway and Transportation Officials – AASHTO LRFD (2014). Bridge Design Specifications. AASHTO, Washington, DC, USA.
-
Calgaro, J.-A. (1998). Loads on Bridges. Progress in Structural Engineering and Materials, v. 1 (4), p. 452-461. http://doi.org/10.1002/pse.2260010415
» http://doi.org/10.1002/pse.2260010415 -
Caprani, C. C. (2013). Lifetime highway bridge traffic load effect from a combination of traffic states allowing for dynamic amplification. Journal of Bridge Engineering., v. 18, p. 901-909. https://doi.org/10.1061/(ASCE)BE.1943-5592.0000427
» https://doi.org/10.1061/(ASCE)BE.1943-5592.0000427 -
Caprani, C. C., O’Brien, E. J., Lipari, A. (2016). Long-span bridge traffic loading based on multi-lane traffic micro-simulation. Engineering Structures, v. 115, p. 207-219. https://doi.org/10.1016/j.engstruct.2016.01.045
» https://doi.org/10.1016/j.engstruct.2016.01.045 -
Caprani, C. C., O’Brien, E. J., McLachlan, G. J. (2008). Characteristic traffic load from a mixture of loading events on short to medium span bridges. Structural Safety, v. 30, p. 394-404. http://doi:10.1016/j.strusafe.2006.11.006
» https://doi.org/http://doi:10.1016/j.strusafe.2006.11.006 - Comité Européen de Normalisation – CEN (2005). Eurocode 1. Basis of design and actions on structures, Part 2 – Traffic loads on bridges. Brussels, Belgium.
- Das, P. C. (1997). Safety of Bridges. Thomas Telford: London, UK.
-
Enright, B.; O’Brien, E. J. (2013). Monte Carlo simulation of extreme traffic loading on short and medium span bridges. Struct. Infrastruct. Eng., v. 9, p. 1267–1282. http://dx.doi.org/10.1080/15732479.2012.688753
» http://dx.doi.org/10.1080/15732479.2012.688753 -
García-Soto, A. D.; Hernández-Martínez, A.; Valdés-Vázquez, J. G. (2015). Probabilistic assessment of a design truck model and live load factor from weigh-in-motion data for Mexican Highway bridge design. Canadian Journal of Civil Engineering, v. 42 (11), p. 970–974. DOI: https://doi.org/10.1139/cjce-2015-0216
» https://doi.org/10.1139/cjce-2015-0216 -
Heywood, R.; Gordon, R.; Boully, G. (2000). Australia’s Bridge Design Load Model: Planning for an Efficient Road Transport Industry. Transportation Research Record, v. 1696 (1), p. 1–7. DOI: https://doi.org/10.3141/1696-36
» https://doi.org/10.3141/1696-36 -
Leahy, C.; O’Brien, E. J.; Hajializadeh, D. (2015). Review of HL-93 bridge traffic load model using an extensive database. J. Bridge Eng., v. 20, 04014115. http:// 10.1061/(ASCE)BE.1943-5592.0000729
» https://doi.org/http:// 10.1061/(ASCE)BE.1943-5592.0000729 -
Liu, Y.; Zhang, H.; Deng, Y.; Jiang, N. (2017). Effect of live load on simply supported bridges under a random traffic flow based on weigh-in-motion data. Adv. Struct. Eng., v. 20, p. 722–736. https://doi.org/10.1177%2F1369433216664348
» https://doi.org/10.1177%2F1369433216664348 - Luchi, L. A. R. (2006). Reavaliação do trem-tipo à luz das cargas reais nas rodovias brasileiras (in Portuguese). D.Sc. Thesis, EPUSP, São Paulo, Brasil.
- Mendes, P. T. C. (2009). Contribuições para um modelo de gestão de pontes de concreto aplicado à rede de rodovias brasileiras (in Portuguese). D.Sc. Thesis, EPUSP, São Paulo, Brasil.
-
Miao, T. J.; Chan, T. H. T. (2002). Bridge live load models from WIM data. Engineering Structures, v. 24 (8), 1071-1084. doi.org/10.1016/S0141-0296(02)00034-2
» https://doi.org/doi.org/10.1016/S0141-0296(02)00034-2 -
Nowak, A. S. (1993). Live load model for highway bridges. Struct. Saf., v. 13, p. 53–66. http://dx.doi.org/10.1016/0167-4730(93)90048-6
» http://dx.doi.org/10.1016/0167-4730(93)90048-6 -
Nowak, A. S. (1995). Calibration of LRFD Bridge Code. Journal of Structural Engineering, v. 121 (8), p. 1245-1251. http://doi.org/10.1061/(ASCE)0733-9445(1995)121:8(1245)
» http://doi.org/10.1061/(ASCE)0733-9445(1995)121:8(1245) -
O’Connor, A., O’Brien, E. J. (2005). Traffic load modeling and factors influencing the accuracy of predicted extremes. Canadian Journal of Civil Engineering, v. 32, p. 270-278. https://doi.org/10.1139/l04-092
» https://doi.org/10.1139/l04-092 -
O’Brien, E. J., Enright, B. (2011), Modeling same-direction two-lane traffic for bridge loading. Structural Safety, v. 33, p. 296-304. http://dx.doi.org/10.1016/j.strusafe.2011.04.004
» http://dx.doi.org/10.1016/j.strusafe.2011.04.004 -
O’Brien, E. J., Hayrapetova, A., Walsh, C. (2012). The use of micro-simulation for congested traffic load modeling of medium- and long-span bridges. Structure and Infrastructure Engineering: Maintenance, Management, Life-Cycle Design and Performance, v. 8 (3), p. 269-276. https://doi.org/10.1080/15732471003640477
» https://doi.org/10.1080/15732471003640477 - O’Brien, E. J.; Caprani, C. C. (2005). Headway modelling for traffic load assessment of short to medium span bridges. The Structural Engineer. v. 83, p. 33–36.
-
O’Brien, E. J.; Enright, B.; Getachew, A. (2010). Importance of the tail in truck weight modeling for bridge assessment. J. Bridge Eng., v. 15, p. 210–213. http://doi.org/10.1061/(ASCE)BE.1943-5592.0000043
» http://doi.org/10.1061/(ASCE)BE.1943-5592.0000043 -
O’Brien, E. J.; Schmidt, F.; Hajializadeh, D.; Zhou, X.-Y.; Enright, B.; Caprani, C. C.; Wilson, S.; Sheils, E. (2015). A review of probabilistic methods of assessment of load effects in bridges. Struct. Saf., v. 53, p. 44–56. https://doi.org/10.1016/j.strusafe.2015.01.002
» https://doi.org/10.1016/j.strusafe.2015.01.002 - Oliveira, H. O. (2019). Ajuste do modelo de cargas móveis em pontes rodoviárias no Brasil (in Portuguese). M.Sc. Dissertation, COPPE/UFRJ, Rio de Janeiro, Brasil.
- Portela, E. L. (2018). Analysis and development of a live load model for Brazilian concrete bridges using WIM data. D.Sc. Thesis, EPUSP, São Paulo, Brasil.
-
Prat, M. (2001). Traffic load models for bridge design: Recent developments and research. Progress in Structural Engineering and Materials, v. 3, p. 326-334. https://doi.org/10.1002/pse.91
» https://doi.org/10.1002/pse.91 - Rossigali, C. E. (2013). Atualização do modelo de cargas móveis para pontes rodoviárias de pequenos vãos no Brasil (in Portuguese). D.Sc. Thesis, COPPE/UFRJ, Rio de Janeiro, Brasil.
-
Rossigali, C. E., Pfeil, M. S., Battista, R. C., Sagrilo, L. V. S. (2015). Towards actual Brazilian traffic load models for short span highway bridges. Ibracon Structures and Materials Journal. v. 8 (2), p. 124-139. http://dx.doi.org/10.1590/S1983-41952015000200005
» http://dx.doi.org/10.1590/S1983-41952015000200005 -
Rossigali, C. E., Pfeil, M. S., Sagrilo, L. V. S., Oliveira, H. M. (2023). Load Models Representative of Brazilian Actual Traffic in Girder-Type Short-Span Highway Bridges. Applied Sciences, v. 13, 1032. https://doi.org/10.3390/app13021032
» https://doi.org/10.3390/app13021032 -
Soriano, M.; Casas, J.R.; Ghosn, M. (2017). Simplified probabilistic model for maximum traffic load from weigh-in-motion data. Struct. Infrastruct. Eng., v. 13, 454–467. http://dx.doi.org/10.1080/15732479.2016.1164728
» http://dx.doi.org/10.1080/15732479.2016.1164728 -
Van Der Spuy, P.; Lenner, R. (2019). Towards a New Bridge Live Load Model for South Africa. Structure, v. 29 (2), p. 292–298. https://doi.org/10.1080/10168664.2018.1561168
» https://doi.org/10.1080/10168664.2018.1561168 -
Wang, X.; Ruan, X.; Casas, J.R.; Zhang, M. (2024). Probabilistic Modeling of Congested Traffic Scenarios on Long-Span Bridges. Applied Sciences, v. 14, 9525. https://doi.org/10.3390/app14209525
» https://doi.org/10.3390/app14209525 -
Wu, J., Yang, F., Han, W., Wu, L., Xiao, Q., Li, Y. (2015). Vehicle Load Effect of Long-Span Bridges: Assessment with Cellular Automaton Traffic Model. Transportation Research Record: Journal of the Transportation Research Board. v. 2481 (1), p. 132-139. https://doi.org/10.3141/2481-17
» https://doi.org/10.3141/2481-17 - Zhang, H., Quilligan, M. (2020). Simulation of Traffic Loading on Long Span Bridges. In Civil Engineering Research in Ireland 2020, Cork, Ireland.
Edited by
-
Editor:
Marco L. Bittencourt
Research data is available in the body of the article