Comparative Study Between Conventional Pushover Analysis and the Finite Element Method for Capacity Curve Construction
Abstract
Approximate seismic evaluation procedures based on the capacity curve have gained wide acceptance in practical engineering owing to their straightforward application and the valuable insights they provide, although they do not always yield results consistent with numerically robust methods. This study presents an investigation into the reliability of results obtained through so-called approximate procedures for constructing the capacity curve, comparing them with those derived from more robust and complex approaches, primarily based on the finite element method. The approximations examined are assessed against results from an experimental study on a full-scale three-dimensional frame tested by another research group, and from a non-linear analysis using the finite element software ATENA, which models the structure under identical conditions. Finally, the study discusses the findings and challenges analysts may face when modelling structures using both numerically refined and approximate procedures, such as those implemented in commercial software like ATENA.
Keywords:
Capacity curve; approximate procedures; finite analysis methods; full-scale test experiment; pushover analysis; damage models; distributed cracking

1 INTRODUCTION
Current trends in structural engineering reveal a growing interest in researching and developing new approximate procedures for structural evaluation, aimed at predicting and/or ensuring target limit states or performance levels under demands consistent with those considered in design. Despite substantial efforts dedicated to this topic, numerous uncertainties remain regarding the reliability of these procedure—particularly in their capacity to predict inelastic non-linear behaviour in critical regions such as beam–column joints, which are highly susceptible to damage.
As a result, recent studies have focused on the application of pushover analysis procedures incorporating numerically robust procedures, such as the Finite Element Method (FEM), to simulate both the linear and non-linear behaviour of structures using advanced analytical approaches. These include the smeared cracking procedure, the discrete crack approach, and the embedded discontinuity procedure, among others. However, the accurate implementation of such techniques requires the analyst to possess significant expertise, as well as a comprehensive understanding of the structural demand characteristics and the constitutive models and parameters governing the inelastic non-linear behaviour of materials.
One of the more detailed non-linear analysis approaches for reinforced concrete structures—employing numerically robust procedures and commercial software such as ATENA—is based on the Finite Element Method (FEM). This approach incorporates a distributed crack damage model, a formulation that enables a more comprehensive understanding of a structure’s inelastic non-linear behaviour at both local and global levels. In theory, this procedure yields more refined results than those produced by computationally simpler, yet less accurate, techniques. Nevertheless, despite the apparent effectiveness of FEM in conducting inelastic non-linear analyses, uncertainties persist regarding the consistency of its results when compared with those obtained from experimental tests under comparable conditions. Furthermore, within the context of structural engineering practice, it remains debatable whether the computational cost associated with the high level of detail provided by such procedures is justified, given the uncertainties in lateral demands and in the material properties.
The aim of this research is to investigate and validate the results related to the inelastic non-linear behaviour of reinforced concrete structures obtained through numerically robust analyses based on the Finite Element Method (FEM), incorporating the theory of distributed cracking. The study seeks to assess the consistency of the level of detail—such as crack patterns and crack widths—in potential damage zones of the structure, using experimental results as a benchmark. Additionally, it compares the outcomes derived from simplified non-linear static analyses, which provide a lower level of detail, with those obtained from FEM-based approaches.
2 PUSHOVER ANALYSIS
Pushover analysis is a procedure that involves statically pushing a structure using a monotonically increasing lateral load vector until a predefined target displacement is reached or a collapse mechanism develops within the structure. At each analysis increment, the capacity of the structural elements is compared against the demand imposed by a lateral force vector, which may be constant or adaptive in its distribution—typically representing lateral forces associated with an incrementally intensifying seismic demand.
The primary objective of pushover analysis provides an approximation of the non-linear behaviour of a structure subjected to forces like those generated by a progressively severe earthquake. The results of this analysis enable the construction of what is known as the capacity curve, recognised as a structural property that offers insight into the structural response under seismic-like conditions. This information is typically more difficult to obtain through other analysis procedures endorsed by most contemporary building codes, which tend to be more complex in their implementation.
A monotonically increasing pushover analysis—and, in particular, the results on which the capacity curve is based—facilitates the approximate identification of deformation patterns, cracking, and yielding within the structure as it progresses towards collapse under increasing intensity actions. Most importantly, it enables the estimation of performance indices associated with a specific level of demand (see Figure 1).

2.1 Lateral load pattern
Lateral force vectors characterise the distribution of inertia forces induced by accidental actions such as earthquakes and wind. However, accurately defining the distribution of such accidental forces presents a challenge comparable to that of determining structural performance indices. Currently, no building code provides a general and universally accepted specification for the distribution of forces within the lateral load vectors required for pushover analyses. In practice, the force distribution resulting from an accidental event varies over time and depends on the temporal characteristics of the action’s intensity. Consequently, it is difficult to represent such forces using a monotonically increasing load pattern. Nevertheless, in certain cases, these load vectors can be approximately defined using the dynamic properties of the structure to represent the accidental demand.
The capacity curve generated through pushover analysis is highly sensitive to the selected loading pattern, and its shape can vary significantly depending on the chosen vector. For this reason, codes that permit the use of non-linear static procedures recommend employing multiple lateral load vectors to evaluate the structural response. The most commonly used lateral force vectors include: the Uniform Load Pattern (ULF), the Equivalent Lateral Force distribution (ELF), the Fundamental Mode pattern (MF), and the Multimodal vector using the Square Root of the Sum of the Squares (SRSS), among others (FEMA 273, 1997).
Uniform Load Pattern (ULF): This pattern assumes a uniform distribution of forces across all storeys of the structure. Although such an assumption is unlikely to hold for a specific earthquake scenario, the application of this lateral load vector highlights the capacity of the lower storeys and emphasises the relative importance of shear forces in the upper storeys compared with overturning moments. Equivalent Lateral Force Distribution (ELF): This method determines the distribution of lateral forces according to the structural flexibility, applying a constant factor for extreme periods (short and long) and a variable factor for intermediate periods. Multimodal Vector (SRSS): This pattern accounts for the participation of higher modes. It defines the distribution shape using characteristic value analysis and a modal combination rule (SRSS). Fundamental Mode Pattern (MF): Only the participation of the fundamental mode is considered.
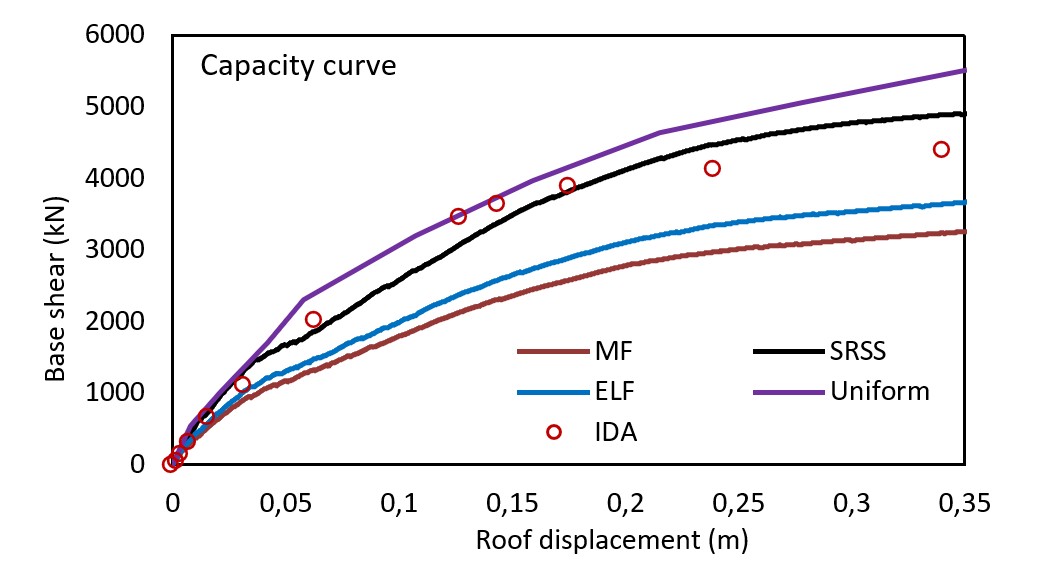
The shapes of these curves may vary significantly, potentially leading to seismic performance results that are inconsistent with those obtained from numerically robust methods such as IDA. Figure 2 shows various capacity curves obtained from approximate analyses with different lateral load patterns and from an incremental dynamic analysis.

2.2 Adaptive lateral load vector
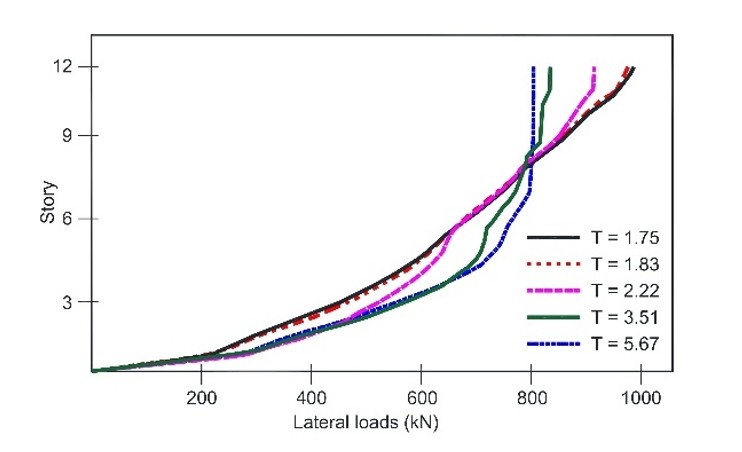
Adaptive pushover procedures are based on the assumption that a structure does not maintain a single modal shape throughout its inelastic response, as this shape may change—sometimes significantly—between different damage states. Consequently, the contribution of higher modes to the response may vary and potentially increase compared to that observed under linear conditions. For this reason, considering adaptable force distributions allows for a more accurate estimation of the capacity curve and performance indices of a structure exhibiting inelastic behaviour under accidental actions. This type of analysis employs variable lateral load patterns corresponding to the dynamic properties of the structure, which may change from one step to another during the inelastic response phase (e.g., Kunnath et al. 1990 Requena and Ayala 1999, Aydinoğlu 2003, Antoniu and Pinho 2004b, Mendoza and Ayala 2011, Bañuelos et al. 2025, among others). The equation 1 and Figure 3 illustrates the evolution of the adaptive lateral load vector. At each analysis step, the load vector is updated by adding the load vector from the previous step to the load increment required for a specific point of the structure to reach its ultimate capacity (Antoniu y Pinho 2004a-b). Figure 4 illustrates that the shape of the lateral load pattern evolves at each analysis step because of the stiffness degradation experienced by the structure upon entering the nonlinear range. Figure 5 presents two capacity curves obtained from an adaptive and a non-adaptive lateral pushover analysis.


Capacity curves considering adaptive and non-adaptive loading patterns. Escamilla M.A (2016).
Where is load factor increment, is current modal scaling vector, is load vector of the previous step and is nominal load vector.
3 FINITE ELEMENT METHOD
In recent years, robust numerical procedures have been developed, enabling refined structural analyses that account for both geometric and material non-linearity. Constitutive models have been formulated to reproduce the behaviour of concrete while considering stiffness degradation due to material cracking. These models are typically classified into three groups: (1) continuous damage models, (2) discrete crack models, and (3) hybrid models.
Continuous damage models (Figure 6a) describe material behaviour through stress–strain relationships. In discrete crack models (Figure 6b), the relationship is defined between internal forces at the nodes and the relative displacements of those nodes. Hybrid models combine features of both continuous and discrete approaches, Figure 6c (Ruiz et al., 2011).
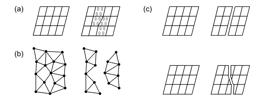
Constitutive models for defining the behaviour of quasi-brittle materials: a) continuum models; b) discrete crack models; and c) mixed models. (Ruiz et al., 2011)
The simplest and most commonly used continuous model in structural analysis is based on Hooke’s law; however, a notable drawback is that the accuracy of the results depends on the mesh size, as the energy release is influenced by this parameter (Ruiz et al., 2011). Discrete crack models were initially proposed by Ngo and Scordelis (1967). These models require the predefined location and trajectory of the initial crack, and to simulate its propagation and the failure process, repeated remeshing is often necessary.
A significant advancement in modelling concrete failure was introduced through the cohesive crack model proposed by Hillerborg et al. (1976), which represented a qualitative leap in the simulation of fracture processes in concrete. Based on this concept, various mathematical formulations have been developed for implementation in finite element models to replicate the behaviour of concrete, with particular emphasis on cracking phenomena and stiffness degradation in structural elements.
4 PLASTICITY MODELS
Inelastic structural models can be distinguished by the manner in which plasticity is distributed across the cross-sections of elements and along their length (Deierlein et al., 2010). Figure 7 illustrates the characteristics of five types of idealised models used to simulate the inelastic response of beam–column elements. These models are applicable to various structural components, including beams, columns, braces, and walls.
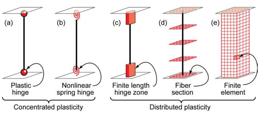
In the simplest representations, inelastic deformations are concentrated at the ends of elements, either through an inelastic hinge (Figure 7a) or an inelastic spring (Figure 7b). By concentrating plasticity in zero-length hinges, the numerical formulation of the structural model remains relatively compact. The finite-length hinge model (Figure 7c) represents a distributed plasticity approach considered efficient. Cross-sections within the inelastic hinge regions are characterised using non-linear moment–curvature relationships or through explicit integration of fiber-based section models, under the assumption that plane sections remain plane before and after deformation. The length of the inelastic hinge may be fixed or variable, depending on the moment–curvature properties of the section, the moment gradient, and the axial force. Integrating deformations over the hinge length provides a more realistic representation of yield propagation than concentrated hinges, while still facilitating the calculation of hinge rotations.
In the fiber model formulation (Figure 7d), plasticity is distributed using numerical integration both through the cross-sections and along the member length (Filippou and Taucer, 1996). The plane section assumption is retained, and uniaxial “fibers” are numerically integrated over each section to compute the resulting internal forces (axial force and bending moments). Cross-sectional responses are then integrated along the member length, typically using displacement shape functions or force interpolation functions (Kunnath et al., 1990; Spacone et al., 1996). The computed strain demands can be highly sensitive to the moment gradient, element length, integration technique, and material strain-hardening parameters.
The most complex models (Figure 7e) discretise the element both along its length and across its cross-section into small finite elements with non-linear hysteretic constitutive properties, involving numerous input parameters. This level of modelling offers the greatest versatility but also presents significant challenges in calibrating model parameters and managing computational demands. As with fiber-based models, strains computed using finite elements can be difficult to interpret directly in terms of acceptance criteria, which are typically expressed in terms of hinge rotations and strain limits.
5 DESCRIPTION OF THE STUDIED STRUCTURES
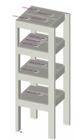
In this research on the non-linear analysis of reinforced concrete structures, two structures were studied: a three-dimensional, four-storey frame and a twelve-storey planar frame. The former is part of an experimental study conducted by Sharma et al. (2013), in which the building was tested under monotonically increasing lateral loads (see Figure 8). This structure was designed in accordance with Indian standards, following the IS 456:2000 code. The building’s structural system consists of reinforced concrete frames in both directions and a solid reinforced concrete slab floor system with a thickness of 12 cm. The structural geometry and configuration are illustrated in Figure 9. The dimensions of the structural elements, the reinforcement detailing, and the compressive strengths are presented in Tables 1 to 3.
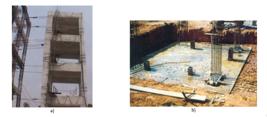
Structure being tested, a) tower testing facility and b) raft foundation. Sharma et al. (2013)

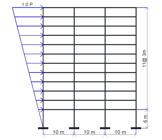
The second structure is a frame (Figure 10) forming part of a building whose structural system also comprises reinforced concrete frames in both directions, with a solid concrete slab floor system 15 cm thick. This structure was designed in accordance with the Complementary Technical Standards NTC-DS, GCDMX (2020). This structure was designed by the authors of this article and forms part of a group of reinforced concrete buildings designed in accordance with both current and former regulations, with the objective of evaluating the seismic performance of existing structures.The material properties used in the building’s design are as follows: concrete compressive strength of 24.52 MPa, Young’s modulus of 21.77 GPa, and unit weight of 23.54 kN/m3. The steel was assumed to have a yield strength of 411.89 MPa and a Young’s modulus of 196.14 GPa. The dimensions of the structural elements (beams and columns) and the reinforcement details are shown in Tables 4 and 5.

5.1 Lateral Load Vector Used in Robust and Simplified Procedures
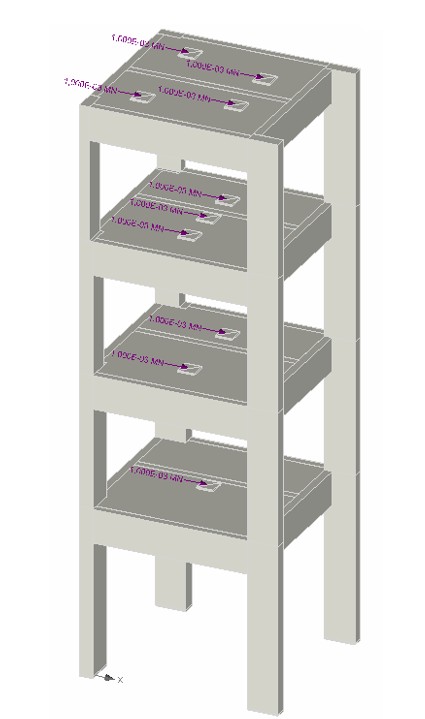
In the pushover analysis of both structures, a non-adaptive load vector with an inverted triangular distribution was employed. For the four-storey building, the analysis considered a gravitational load corresponding to its self-weight, as well as a monotonic lateral load with load increments of ∆ₚ = 50.97 kg. The lateral load was applied through steel plates placed on top of the slab (see Figure 11).
For the concrete frame, the gravitational load included both live accidental load and dead load, in accordance with GDF 2020 regulations. The lateral load was applied using estimated load increments based on a load factor, as proposed by Antoniu and Pinho (2004a), Figure 12.
5.2 Modelling of Studied Structures
The structures studied were modelled considering material properties in accordance with design specifications and experimental data. In cases where certain mechanical properties were unavailable, values recommended in the ATENA user manual were adopted. Key parameters considered in the numerically robust procedure include: (a) equivalent uniaxial stress–strain law; (b) softening function; and (c) yield surface, which facilitate the study of concrete behaviour, crack propagation, and distribution during a force-based pushover test. For the reinforcing steel properties, perfectly elastoplastic behaviour was assumed.
Regarding element selection for modelling, macro-elements with a linear grid mesh were employed, using mesh sizes of 0.30 m and 0.50 m to reduce computational time. Figure 13 shows the characteristics of the model for the four-storey structure (mesh, reinforcement detailing, and monitoring points). Figures 14 displays the reinforcement details of the beam–column joint connections.
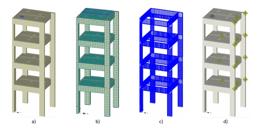
Model of the four-storey structure: a) concrete element (“macro element”); b) meshing of elements at 0.30 m; c) reinforcement steel; d) monitoring points.
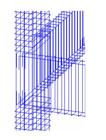
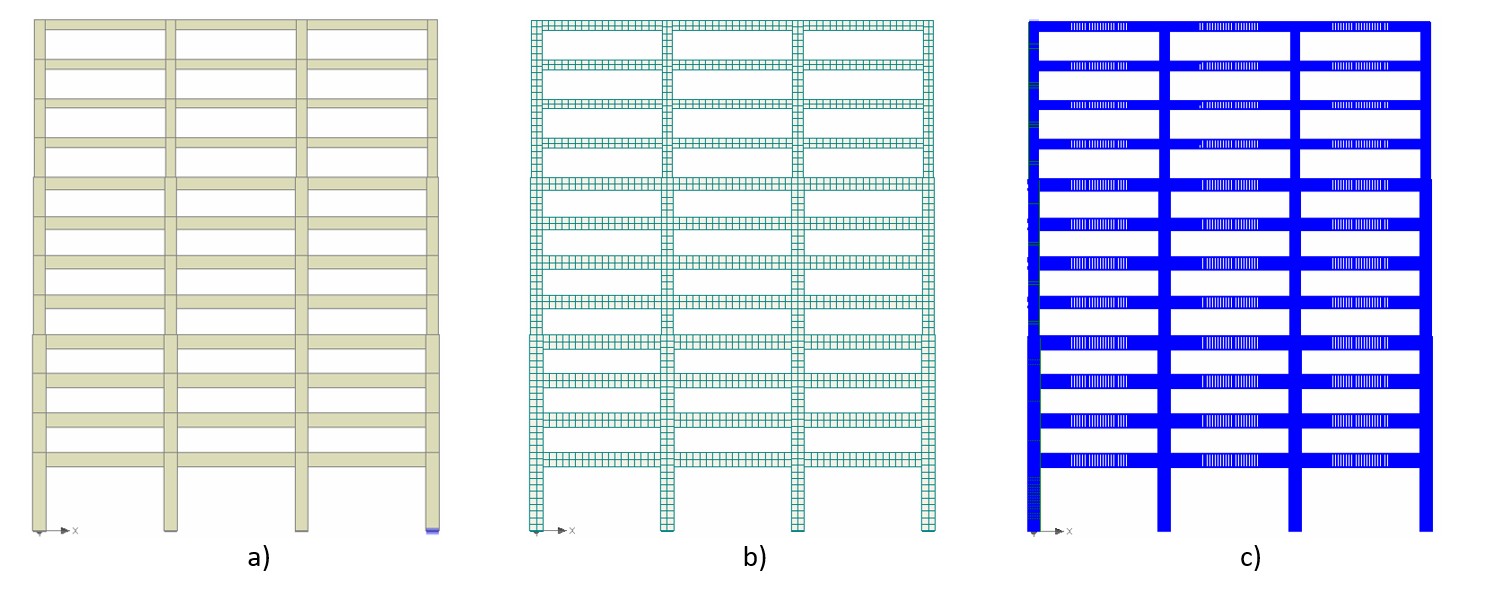
Figure 15 presents the corresponding details for the twelve-storey structure. Figures 11 displays the reinforcement details of the beam–column joint connections for both structures. Figures 16 displays the reinforcement details of the beam–column joint connections.
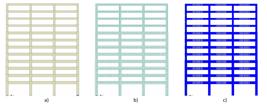
Model of the twelve-storey structure: a) concrete element (“macro element”); b) meshing of elements at 0.30 m; c) reinforcement steel.

Detail of reinforcement steel at the beam–column connection: a) four-storey structure; b) twelve-storey frame.
5.3 Analysis of Results
To validate the results obtained from a numerically robust procedure (Finite Element Method – FEM) and an approximate one (pushover analysis), data from a full-scale experimental test of a four-storey three-dimensional reinforced concrete structure were used. First, the capacity curve generated from the experimental test was compared with that obtained from a numerically robust analysis using the software ATENA. For the development of the mathematical model, solid elements and a damage model based on the distributed crack theory were employed.
Once the mathematical model (ATENA software) was calibrated according to the results from the experimental test, a comparison was made between the robust method (FEA) and the approximate analysis (pushover). The shape of the capacity curve from both methods was compared. In the pushover analysis, a damage model characterised by a plastic hinge and a fibre model was considered. Additionally, performance points were compared by considering seismic demand through a response spectrum associated with the SCT-EW-1985 earthquake record (see Figure 17).
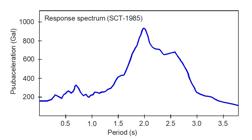
Figure 18 presents the damage observed in beam–column joints (experimental test conducted by Sharma et al., 2013) and the damage distribution characterised by cracking, as obtained from the structural analysis using the ATENA 2016 software.

Failure modes observed in beam-column joints of the test structure and crack patterns in columns, beams and joins. Figures a-d damage in experimental test (Sharma et al., 2013), Figures e and f crack distribution obtained from the finite element method.)
In Figure 18a, damage at the base of the columns is shown, attributed to flexural-compression effects. Figure 18b illustrates cracking in the beam due to a predominantly flexural failure mechanism. Figure 18c shows a joint failure governed by shear action. Figure 18d displays cracking resulting from a combination of internal forces: joint shear, beam flexure, and bond failure of the longitudinal reinforcement. Figures 18e–f schematically depicts the crack distribution obtained from the finite element model (FEM). In Figure 18e, cracking is shown for the Immediate Occupancy performance level, while Figure 18f presents the crack distribution corresponding to the Life Safety performance level, in accordance with FEMA 440 and ASCE 41-23. Overall, a good correlation is observed between the damage recorded in the experimental test and that estimated using the finite element method, considering a distributed crack damage model.
Figure 19 shows the comparison between the experimental test (Sharma et al., 2013) and the force-based pushover analysis using FEM. It can be observed that the approximate results are consistent with the experimental data. Within the linear elastic region, both curves are very similar, while in the non-linear range there is a slight variation.

With the objective of understanding the effect of cracking on the definition of limit states, the damage characterised by cracking (distribution and crack width) obtained from the pushover analysis of both structures (four- and twelve-storey) was correlated with the interstorey drifts established for limit states as defined in ATC (1996). Figure 20 illustrates the cracking patterns associated with different limit states: Immediate Occupancy (IO), Life Safety (LS), and Collapse Prevention (CP).
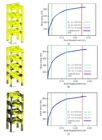
Crack pattern associated with different performance limit states: a) Immediate Occupancy; b) Life Safety; c) Collapse Prevention.
In Figure 20a, the cracking level associated with an interstorey drift corresponding to Immediate Occupancy (IO – 0.002) is mild, with cracks appearing only in some beams aligned with the load direction and within the first storeys. The maximum crack width at this stage was 0.79 mm. Figure 20b shows a considerable increase in cracking associated with an interstorey drift corresponding to Life Safety (LS – 0.02), present in all beams of the first three storeys as well as at the base of the columns. The maximum crack width at this stage was 9.25 mm. Figure 20c indicates a significant level of cracking corresponding to an interstorey drift of Collapse Prevention (CP – 0.03), occurring throughout all structural elements (floor system, beams, and columns). The maximum crack width at this stage was 19.9 mm.
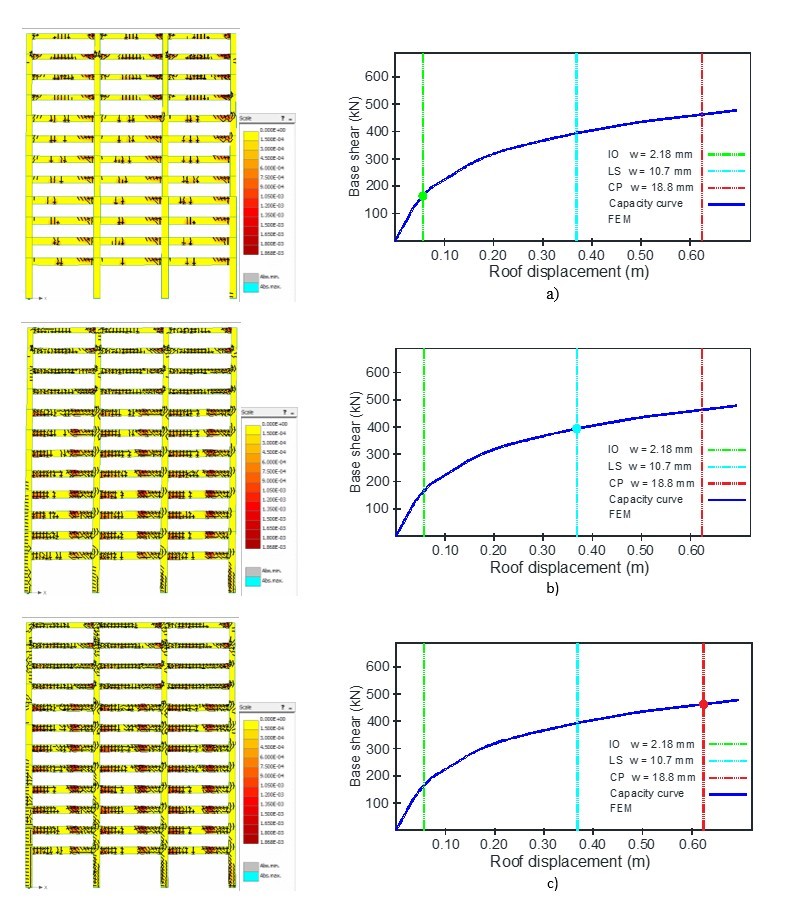
Figure 21 shows the cracking pattern associated with different limit states—Immediate Occupancy (IO), Life Safety (LS), and Collapse Prevention (CP)—of the twelve-storey reinforced concrete planar frame. In Figure 21a, the cracking level associated with an Immediate Occupancy interstorey drift (IO) is relatively significant and is present only in the beams, mainly those located on the upper levels, primarily due to gravitational loading. The maximum crack width at this stage of the analysis was 2.18 mm.
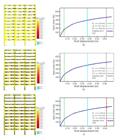
Crack pattern associated with different performance limit states: a) Immediate Occupancy; b) Life Safety; c) Collapse Prevention.
In Figure 21b, the cracking level associated with a Life Safety interstorey drift (LS) increases considerably and appears in all beams and columns on the lower levels. The maximum crack width at this stage of the analysis was 10.7 mm.
In Figure 21c, the cracking level associated with a Collapse Prevention interstorey drift (CP) is very extensive and is present in all structural elements (beams and columns). The maximum crack width at this stage of the analysis was 18.8 mm.
5.4 Capacity Curve Comparisons
In recent years, approximate procedures for estimating structural performance—based on the validity of the capacity curve—have been widely accepted in practical engineering due to their straightforward application. However, a comprehensive understanding of the true significance of this curve and the reliability of its approximated results remains limited. Several studies have addressed this issue by comparing capacity curves derived from approximate procedures with those obtained through more robust techniques, such as Incremental Dynamic Analysis (IDA) proposed by Vamvatsikos and Cornell (2001). Full-scale experimental results have been used as a reference for comparison, albeit on a limited basis.
In the present study, capacity curves obtained from pushover analyses using both approximate and numerically robust finite element method (FEM), employing a distributed crack formulation, were compared. The latter method (FEM) was validated by comparing its predictions against data obtained from a full-scale experimental test. To evaluate the scope of the approximate methods, planar frames were analyzed, thereby eliminating certain uncertainties unrelated to the methods themselves, such as bidirectional effects in lateral load analysis.
To construct the capacity curve using approximate procedures, a monotonically increasing, non-adaptive pushover analysis was employed, utilising a lateral load vector with an inverted triangular distribution. In the first case, a plastic hinge damage model was considered; in the second, a fibre-based force model was utilised. The approximate capacity curves were developed using the SeismoSoft 2023 software packages. For the FEM-based capacity curve, ATENA software was used, which implements a numerically robust non-linear finite element formulation with a distributed crack damage model.
Figure 22 presents a comparative analysis between the results obtained from a numerically robust analysis (FEM) and a pushover analysis for Structure 2 (plane frame). The comparison focused on the shape of the capacity curve and the performance point, considering a seismic scenario characterised by the response spectrum derived from the SCT-EW-1985 ground motion record.

Comparison of capacity curves generated using different procedures for the twelve-storey frame (FEM vs. approximate procedure, fiber model, and plastic hinge model).
In the pushover analysis, two different damage models were considered: one characterised by a plastic hinge model and another by a fibre-based model. In the finite element method, a distributed crack damage model was employed. It is observed that the capacity curves obtained from traditional pushover analyses (fibre and plastic hinge models) are approximate. However, there is a significant discrepancy when compared to the curve estimated using the finite element method. In the elastic range, the curves are similar; however, the curve derived from the more robust analysis loses stiffness earlier than those obtained from the pushover analysis. This difference is primarily due to the simplified assumption in the pushover method that damage occurs only at the member ends, which does not reflect actual structural behaviour. In contrast, the finite element model reveals that damage is distributed along the entire length of the element, resulting in greater stiffness degradation.
It is observed that the performance points obtained from traditional pushover analyses—both fibre and plastic hinge models—are very similar, due to the consistency in the shape of their capacity curves. However, the performance point derived from the more robust models differs significantly from that obtained through the pushover method. This discrepancy is primarily attributed to the difference in the shape of the capacity curve, which directly influences the intersection with the demand spectrum.
6 CONCLUSIONS AND RECOMMENDATIONS
6.1 Conclusions
This paper presents the results of ongoing research into the validity of outcomes obtained using numerically robust and approximate procedures for constructing the capacity curve of reinforced concrete structures. Reference is made to capacity curves derived from full-scale experimental tests conducted by other research groups, as well as the consistency of cracking patterns with the limit states established in ATC (1996). From the conceptual study of pushover analysis employing both the Finite Element Method (FEM) and approximate procedures applied to two reinforced concrete structures, the following conclusions are drawn:
The capacity curves constructed using the Finite Element Method (FEM) with a distributed crack constitutive model are consistent with those obtained from full-scale experimental tests.
The cracking patterns and crack widths predicted by the FEM with the distributed crack model show relative consistency with experimental observations, particularly in terms of crack distribution. However, the FEM tends to overestimate crack widths compared to the experimental results.
The computational cost associated with numerically robust methods (FEM) is significantly higher than that of approximate procedures. Their application—including data input, model calibration, and result interpretation—requires an experienced analyst. Consequently, these procedures are most valuable for research into the behaviour of reinforced concrete structures or for addressing highly specialised practical engineering problems.
The capacity curve obtained from approximate methods is not always consistent with those derived from numerically robust methods (FEM), with the degree of agreement depending on the pushover technique and damage model employed. Non-adaptive pushover analyses combined with plastic hinge damage models may yield coarse ap-proximations, whereas adaptive pushover techniques paired with fibre-based damage models substantially improve accuracy.
The performance point obtained from approximate methods is not always congruent with that obtained from numerically robust methods. Its approximation depends on several factors, including the shape of the curve itself.
6.2 Recommendations
Based on the conceptual study of pushover analysis via FEM and approximate procedures on two reinforced concrete structures, the following recommendations are proposed.
To validate the consistency of results obtained from numerically robust methods (FEM), further comparative studies involving a broader range of full-scale experimental tests are recommended.
To assess the reliability of approximate procedures, additional comparative studies should be conducted considering various pushover techniques (adaptive and non-adaptive) and a range of damage models.
A more detailed investigation into the validity of results from numerically robust procedures are advised, with particular attention to the consistency of cracking patterns (including damage distribution and crack widths) relative to the limit states established in current building codes.
Acknowledgments
The authors express their sincere gratitude to the Autonomous University of the State of Hidalgo for its support in the preparation and publication of this article. They also extend their appreciation to the Institute of Engineering for the support provided throughout the course of this research and for granting access to its facilities and technological resources. Furthermore, the authors gratefully acknowledge the Secretary of Science, Humanities, Technology and Innovation for the support provided in carrying out this research, as well as for the postgraduate scholarship awarded to the second author. Project CF-2003-I-2776.
-
Data availability statement:
Research data is available in the body of the article
References
- American Society of Civil Engineers, ASCE (2023). Seismic Evaluation and Retrofit of Existing Buildings, ASCE/SEI 41- 23, Reston, VA.
- Antoniou, S., & Pinho, R. (2004a). Advantages and limitations of adaptive and non-adaptive force-based pushover procedures. Journal of earthquake engineering, 8(04), 497-522. https://doi.org/10.1080/13632460409350498.
- Antoniou, S., & Pinho, R. (2004b). Development and verification of a displacement-based adaptive pushover procedure. Journal of earthquake engineering, 8(05), 643-661. https://doi.org/10.1080/13632460409350504.
- Applied Technology Council ATC-40 (1996). Seismic Evaluation and Retrofit of Concrete Buildings. Volumes 1 and 2, Report No. ATC-40, Redwood City.
- Aydinoğlu, M. N. (2003). An incremental response spectrum analysis procedure based on inelastic spectral displacements for multi-mode seismic performance evaluation. Bulletin of Earthquake Engineering, 1(1), 3-36. https://doi.org/10.1023/A:1024853326383
- Bañuelos-Garcia, F., Escamilla, M., Ayala, G., & Valdes-Gonzalez, J. (2025). Dynamic capacity curve and its application to the seismic evaluation of structures. Earthquakes and Structures, 28(1), 75. https://doi.org/10.12989/eas.2025.28.1.075
- Červenka V., Jendele L. y Červenka J. (2016), “ATENA Theory, ATENA Program Documentation Part. 1”. Červenka Consulting s.r.o., Prague.
- Deierlein, G. G., Reinhorn, A. M., & Willford, M. R. (2010). Nonlinear structural analysis for seismic design. NEHRP seismic design technical brief, 4, 1-36.
- Escamilla M.A (2016). Influencia de la evolución de las formas modales en el desempeño sísmico de estructuras irregulares, utilizando métodos aproximados de evaluación y diseño sísmico. PhD tesis (in spanish). Universidad Nacional Autónoma de México, CDMX, México.
- FEMA 273, F. E. (1997). Prestandard and commentary for the seismic rehabilitation of buildings. Federal Emergency Management Agency: Washington, DC, USA.
- FEMA 356, F. E. (2000). Prestandard and commentary for the seismic rehabilitation of buildings. Federal Emergency Management Agency: Washington, DC, USA.
- FEMA 440, F. E. (2005). Improvement of Nonlinear Static Seismic Analysis Procedures; Department of Homeland Security Federal Emergency Management Agency: Washington, DC, USA.
- Filippou, F. C., & Taucer, F. (1996). Fiber beam-column model for non-linear analysis of R/C frames: part I formulation. Earthquake engineering and structural dynamics, 25(7), 711-725. https://doi.org/10.1002/(SICI)1096-9845(199607)25:7<711::AID-EQE576>3.0.CO;2-9
- GCDMX (2020). Complementary Technical Standards for Earthquake Design in Mexico City, Section NTC-DS-2020, Instituto para la Seguridad de las Construcciones en la Ciudad de México, CDMX, México.
- Hillerborg, A., Modéer, M., & Petersson, P. E. (1976). Analysis of crack formation and crack growth in concrete by means of fracture mechanics and finite elements. Cement and concrete research, 6(6), 773-781. https://doi.org/10.1016/0008-8846(76)90007-7
- IS 456:2000 (2000), “Indian Standard plain and reinforced concrete – code of practice”. New Delhi: Bureau of Indian Standards.
- Kunnath, S. K., Reinhorn, A. M., & Park, Y. J. (1990). Analytical modeling of inelastic seismic response of R/C structures. Journal of Structural Engineering, 116(4), 996-1017. https://doi.org/10.1061/(ASCE)0733-9445(1990)116:4(996)
- Mendoza Pérez, M., & Ayala Milián, A. G. (2013). Procedimiento de evaluación de edificios de concreto reforzado basado en desempeño: desarrollo y validación. Ingeniería sísmica, (88), 23-41. https://doi.org/10.18867/ris.88.8.
- Ngo, D., & Scordelis, A. C. (1967, March). Finite element analysis of reinforced concrete beams. In Journal Proceedings. Vol. 64, No. 3, pp. 152-163. https://doi.org/10.14359/7551
- Requena, M., Ayala, A.V. (2000). Evaluation of a simplified method for determination of the nonlinear seismic response of RC frames. 12th World Conference on Earthquake Engineering, New Zealand, Paper 2109.
- Ruiz-Carmona, J., Rey, J. y Červenka, V. (2011), Cálculo no lineal de estructuras de hormigón con elementos finitos de fisuración distribuida. Ejemplos prácticos realizados con el programa ATENA. V Congreso de ACHE.
-
SeismoSoft. SeismoStruct User Manual 2023. Available online: https://seismosoft.com/
» https://seismosoft.com/ -
Sharma, A., Reddy, G. R., Vaze, K. K., & Eligehausen, R. (2013). Pushover experiment and analysis of a full scale non-seismically detailed RC structure. Engineering Structures, 46, 218-233. https://doi.org/10.1016/j.engstruct.2012.08.006
» https://doi.org/10.1016/j.engstruct.2012.08.006 - Vamvatsikos, D., & Cornell, C. A. (2001). Incremental dynamic analysis. Earthquake Engineering & Structural Dynamics, 31(3), 491-514. Portico. https://doi.org/10.1002/eqe.141.
Edited by
-
Editor:
Marco L. Bittencourt
Research data is available in the body of the article