Use of the Micro-Doppler Effect in Classifying and Differentiating Drones from Birds
Abstract
Small Remotely Piloted Aircrafts (RPAs) are gaining an increasingly prominent role in society. However, their growing use has raised concerns due to their potential misuse for illicit activities. Consequently, the detection and accurate classification of small RPAs have become crucial. Conventional radar systems, however, struggle to distinguish these aircraft from birds, as their Radar Cross-Sections (RCS) are very similar. To address this challenge, the Micro-Doppler (MD) effect has emerged as a valuable tool, enabling the differentiation of signals between birds and small RPAs. It also facilitates the classification of these aircraft. This study analyzed the Micro-Doppler (MD) effect generated by the motion of the rotating components of quadcopter RPAs and explored how this phenomenon can be utilized to extract information, such as rotor rotation speeds and propeller sizes, for an initial classification of these aircraft. Furthermore, the MD effect produced by birds was examined to identify characteristics that can be used to differentiate RPAs from birds. Lastly, the results of MD effect measurements using a Frequency-Modulated Continuous Wave (FMCW) radar during the RPA FIMI X8 SE flight were analyzed and discussed.
Index Terms
Birds; Classification; Radar; Small Remotely Piloted Aircraft.
I. INTRODUCTION
Remotely Piloted Aircrafts (Remotely Piloted Aircraft (RPA)), also known as drones, are increasing in number and popularity. They can be either fixed-wing or multirotor, with sizes ranging from a few centimeters (classified as micro) to several meters [1]. This variety enables their adaptation to numerous civil applications, such as goods delivery, surveillance, photography, filming, industrial and infrastructure inspections, and agricultural monitoring.
In addition to civil applications, the use of RPA is well-established in military operations, including airspace defense and support for search and rescue missions [2]. However, RPA can also be exploited for illicit purposes, such as espionage, drug transport, and terrorist attacks [3]. In this context, ensuring security and privacy requires identifying and studying methods to counter these threats.
Although the detection and identification of RPAs are challenging, particularly for models classified as micro and mini, which have a maximum takeoff weight below 25 kg, numerous research studies have been conducted to address this issue. These approaches include visual methods (e.g., images or videos), acoustic detection, passive detection of Radio Rrequency (radiofrequency (RF)) emissions between the operator and the RPA, radar-based detection, and hybrid techniques that combine two or more of these methods [4].
In this context, radar detection stands out due to its ability to overcomes several key limitations of other detection methods. Unlike visual detection, radars can operate effectively under adverse weather conditions (e.g., fog, rain, and snow) [5]. Since radars work by emitting and receiving electromagnetic waves, they are immune to environmental sound noise, which often reduces the accuracy of acoustic detection [6]. Additionally, unlike passive detection, which fails in the absence of RF signals between the operator and the drone, radar detection does not depend on such communication [7]. Moreover, radar detection technology is well-established in military applications.
However, conventional radar systems face challenges when detecting micro and mini RPAs. The primary factors contributing to these difficulties include the small Radar Cross-Section (radar crosssection (RCS)), the ability of these RPAs to fly at low speeds, hover, quickly change flight direction, and the materials used in their construction some of which are plastic composites that further reduce the RCS [8]. Furthermore, these RPAs are similar in size to birds, resulting in similar RCS values. This resemblance leads to mismatches in conventional radar systems and significantly increases the false alarm rate [9].
To address these limitations in radar detection, researchers have increasingly focused on investigating the Micro-Doppler (MD) effects in radar. Fundamentally, the MD effect, derived from the Doppler effect, occurs when an object or one of its structural components exhibits periodic motion in addition to its overall motion. This periodic motion induces additional frequency modulation in the reflected signal, generating sidebands around the conventional Doppler-shifted frequency caused by the object’s translational movement [10].
For instance, [11] presents a method for distinguishing between birds and rotary-wing drones using radar based on their MD features. The authors collected data from five different drones and two birds using K-band Frequency-Modulated Continuous Wave (FMCW) radar in both indoor and outdoor settings. They applied time-frequency analysis to extract and parameterize the MD signals of each target and proposed a modified multiscale Convolutional Neural Network (CNN) capable of capturing both global and local information of MD features while reducing computational costs. Their method was tested on various targets measured by FMCW radar and achieved an average classification accuracy for drones and birds that was 9.4 and 4.6% higher than common CNN methods based on AlexNet and VGG16, respectively.
In [12], the authors proposed a novel approach to extract target parameters, such as velocity, acceleration, rotor rotation frequency, rotor number, and rotor length, using an Fractional Fourier Transform (FRFT) and Short-Time Fourier Transform Based Synchrosqueezing (FSST) for MD signal detection. Compared to the standard Short-Time Fourier Transform (STFT), their method achieved significantly improved accuracy and operational efficiency.
The study by [13] compares three methods for classifying various types of drones and aerial targets using radar signals. The first method uses the signal’s classic spectrogram, the second applies the spectrum after the Moving Target Detector (MTD), and the third extracts features from the MTDprocessed signal and feeds them into a classifier. The authors developed and validated a theoretical radar signal model for different target types to simulate and compare these methods. Their results suggest that the third method outperforms the others in terms of performance and is more suitable for modern multifunctional radars due to its ability to reuse existing processing capabilities.
In [14], the authors provide a theoretical basis for linking MD features to the motion dynamics of small RPAs based on the Doppler spectrum. They analyzed spectral distributions using simulations and experimental data collected from various small RPAs, considering translational motion and aspect changes. Unlike prior studies, this work fully describes and anticipates Doppler spectrum variations relative to the physical characteristics of small RPAs (e.g., blade length and rotor rotation rate). The authors demonstrated that the Doppler spectrum, compared to Joint Time-Frequency (JTF) images, is a simpler and more effective tool for analyzing the MD effects of small RPAs. Their findings highlight the significant potential of MD features extracted from radar echoes for detecting and classifying small RPAs.
In general, previous studies on the MD effect have focused on analyzing variations between different types of RPAs and birds, without accounting for potential changes in rotor rotation speed and the elevation angles of drones relative to the radar. Therefore, this study aims to investigate the MD effect through simulations by varying bird parameters such as size, wing-beating frequency, and flight speed, as well as quadrotor RPAs parameters, including blade length, rotor rotation speed, size, and elevation angle relative to the radar. By examining these effects, it becomes possible to identify distinctive characteristics of both drones and birds, which can be used for their differentiation.
Finally, this work offers the following contributions:
-
Analysis of the MD effect for four commercial RPA models, considering variations in propeller sizes, rotor rotation speeds, and elevation angles relative to the radar. A coherent pulsed radar operating at 9.8 GHz is employed for detection.
-
Investigation of the MD effect generated by the flight of the black-headed gull (Larus dominicanus) and the great frigatebird (Fregata minor), taking into account their different wingbeat frequencies and flight speeds. The same radar system is used for this analysis.
-
Comparative analysis of the MD effects produced by RPAs and birds, emphasizing the primary differences observed between them.
-
Demonstrate that the results of the MD effect analysis obtained through simulations can effectively substitute for those derived from measurements.
-
Evaluation of the MD effect obtained from FMCW radar measurements generated during the ARP FIMI X8 SE flight.
The remainder of this paper is organized as follows: Section II introduces the modeling of echoes from RPAs and the wing-beat motion of birds. Section III details the simulation methodology and measurement setup. Section IV presents and discusses numerical results, and Section V provides the concluding remarks.
II. THEORETICAL FORMULATION
This section will first present the signal model of the echo from small multirotor RPAs in the time domain, followed by the mathematical modeling of bird wing-flapping motion.
A. Signal Model of the Echo from Small Multirotor RPAs
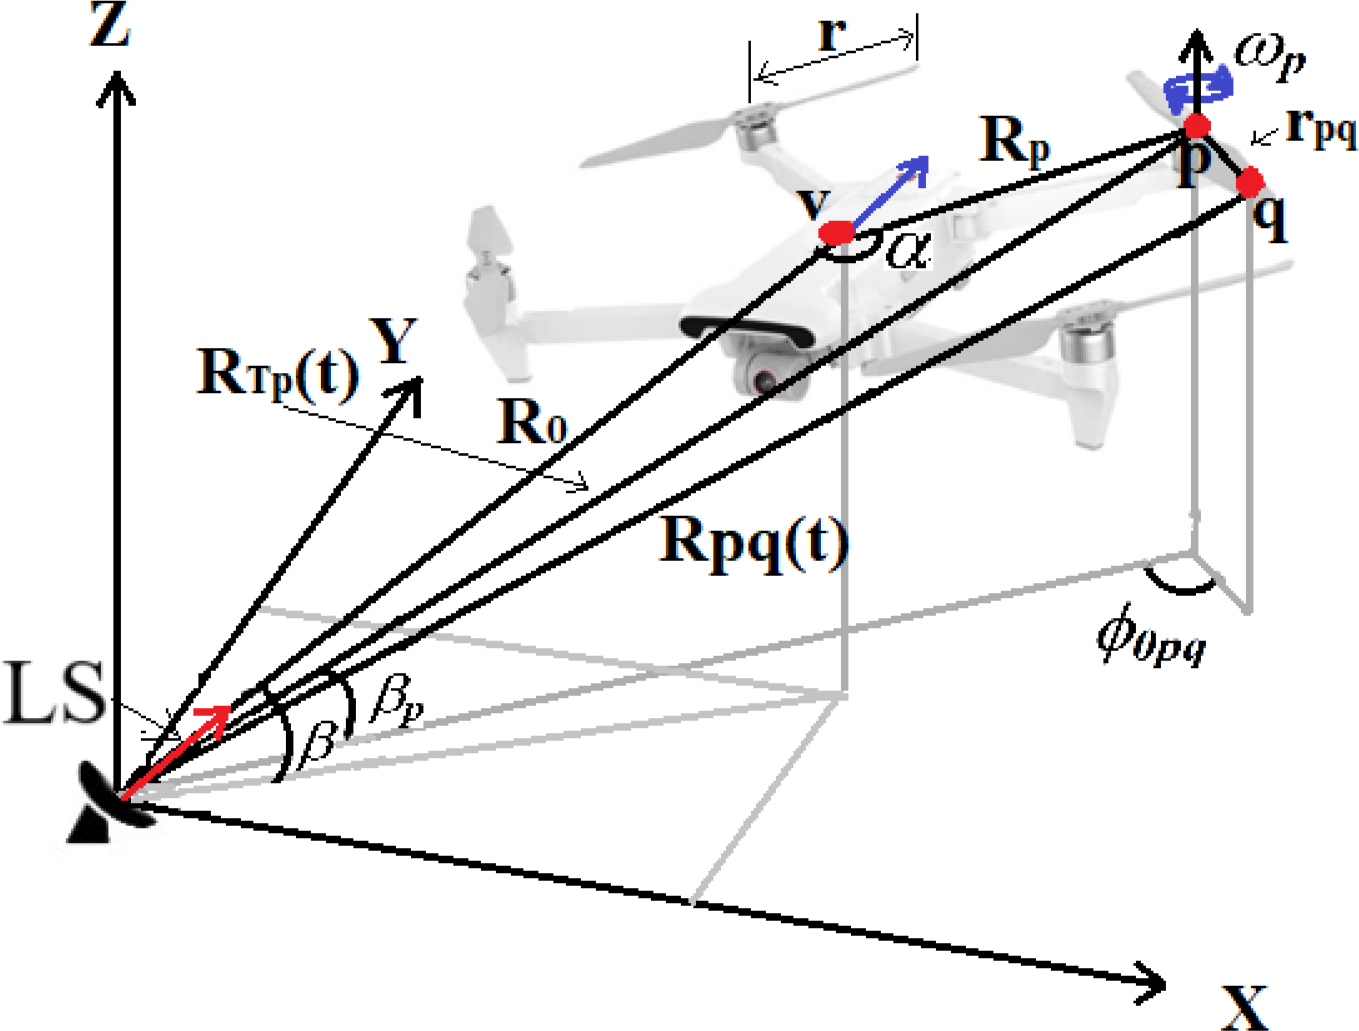
The echo signal of a small multirotor RPA is represented as the sum of the Doppler effect on the main body and the MD effect on the propellers [10].The geometry shown in Fig. 1, adapted from [14], serves as the reference for modeling the echo signal received from a small quadrotor in the time domain. The radar is located at the origin of the coordinate system (0,0,0). Additionally, R0 represents the distance between the radar and the center of the RPA along the line of sight (LS), while β is the elevation angle of the RPA main body relative to the radar. The constant radial velocity of the RPA is denoted by v, and the constant angular velocity by ωp, where the index p refers to the propellers.
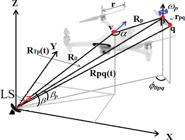
In this context, RTp(t) represents the distance between the radar and the center of the p-th rotor, ϕ0pq is the initial phase of the q-th scattering point, Rp is the distance between the center of the RPA and the center of the p-th rotor, and α is the angle between R0 and Rp. Additionally, considering a q-th scattering point on one of the blades of one of the rotors, the distance from this scattering point to the radar is Rpq. Furthermore, rpq is the distance between the center of the p-th propeller and the q-th scattering point, where rpq ≤ blade length.
According to [14], the echo signal received from a multirotor RPA can be expressed in the time domain as
where K is the number of scattering points on the RPA body, and Ak is the complex amplitude of the k-th scattering point. RMpq(t) represents the motion of the rotating parts, P is the number of propellers, Q is the number of micro-movements on the blade of each propeller, and Bpq is the complex amplitude of the q-th scattering point on the p-th propeller.
The Doppler spectrum of an RPA can be expressed as
where
where Jm is the m-th order term of the Bessel function of the first kind, and
In Equation (2), the Doppler spectrum of an RPA consists of pairs of harmonic spectral lines around the central frequency , where N is the number of propellers on each rotor. Additionally, λ is the wavelength corresponding to the central frequency of the radar. The gap between adjacent spectral lines, commonly referred to as the chopping frequency (fc) [15], is
To obtain the frequency spectrum bandwidth of the return signal from an RPA, it is first necessary to consider that for quickly converges to zero. Additionally, applying Carson’s bandwidth rule [14], the bandwidth becomes
where fdmin is the minimum value of the Doppler spectrum, and fdmax is the maximum value as given by Equation (2). Furthermore, r is the length of the propeller, and ωmax is the maximum angular velocity of the rotors. According to Equations (5) and (6), the Doppler spectrum of an RPA is spread over a frequency band with equally spaced spectral lines at a certain chopping frequency.
B. Mathematical Model of Bird Wings Beating Movement
Fig. 2, adapted from [10], shows the structure of a bird’s wing. It can be seen that the structure consists of the upper arm, forearm, hand, wingspan, and chord. The basic locomotion of a bird’s wings includes flapping, twisting, and sweeping movements [11]. The wing flapping motion involves raising and lowering the arm or forearm around the joints at specific flap angles. Wing twist refers to a rotation of the wing about its main axis, generating lift on the trailing side and depression on the leading side. Sweep denotes the forward or backward movement of the wing.

Structure of a bird’s wing used to develop the adopted mathematical model of the wing beat movement.
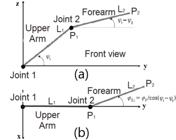
A suitable kinetic model is required to study the wing motion of birds. Fig. 3 presents the model used, which assumes the wing consists of two interconnected parts. Joint 1 connects the shoulder to the upper arm, which has a length of L1. The upper arm moves in the yz plane, forming an angle ψ1 with the origin on the y-axis, as shown in Fig. 3 (a). Joint 2 connects the upper arm to the forearm, which has a length of L2 and moves in both the yz and xy planes, as seen in Fig. 3 (b). The forearm forms an angle of ψ1 -ψ2 with the yz plane, with the origin on the y-axis, and an angle φ2⊥ with the xy plane, with the origin on the y-axis.
From the presented parameters, the upper arm strike angle (ψ1(t)), the forearm strike angle (ψ2(t)), and the forearm twist angle (φ2(t)) are time-varying harmonic functions, as defined by [10]:
where the terms ψ10, ψ20, and φ20 are the initial values of the angles and A1 represents the upper arm wing beat angle amplitude, while C2 corresponds to the forearm wing beat angle amplitude. In this way, point 1, located at joint 2, with position P1 = (x1,y1,z1), exhibits a time-dependent variation in its movement, as defined by [10].
The terms ψ10, ψ20, and φ20 represent the initial values of the movement angles. Thus, point 1, located at joint 2 with position P1 = (x1,y1,z1), exhibits a time-dependent variation in its movement, as defined by [10].
and
Similarly, the time-varying position of P2 = (x2,y2,z2) is given by [10].
and
Where . Through the mathematical modeling of bird wing motion, the author [10] developed an animated bird model within the MATLAB software environment. This model simulates the bird’s motion along a straight path, incorporating wing movements. In this environment, radar echo signals are generated from the animated bird model, and spectrograms are produced. The MD effect of birds with varying sizes, flight speeds, and wing-beat frequencies was then analyzed using these spectrograms. This type of graph is ideal for analyzing the MD effect because it enables visualization of Doppler frequency variations over time.
III. SIMULATION AND MEASUREMENT METHOD
A. Simulation Method through the Application of the RPA Echo Signal Model
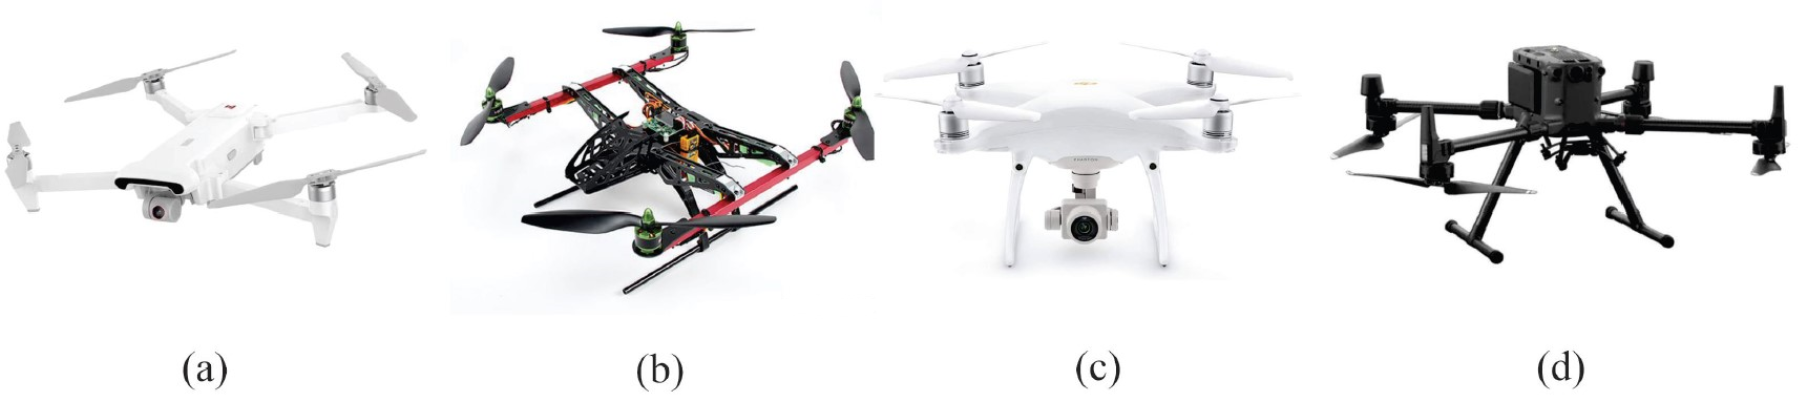
To analyze the MD effect generated by the micro-movements of the propellers of quadcopter RPAs, the mathematical model presented in Section II was implemented in software to simulate the returning signal from the rotating parts of these aircraft. The software implementation assumed that the radial velocity (v) of the RPA was zero. Four different quadcopter RPA models, with varying main body dimensions, propellers, rotor rotation speeds, and elevation angles (β) relative to the radar, were used. The following models were analyzed: the FIMI X8 SE (Fig. 4(a)), Hercules 500 (Fig. 4(b)), Phantom 4 (Fig. 4(c)), and Matrice 300 (Fig. 4(d)).

RPAs selected for MD effect analysis: (a) FIMI X8 SE, (b) Hercules 500, (c) Phantom 4 and (d) Matrice 300.
Table I presents the key parameters of the RPAs shown in Fig. (4). These characteristics were used to generate the simulation results. The selection of RPAs was aimed at analyzing how variations in parameters such as blade length (r), rotor rotation speed (ωp), and the elevation angle (β) relative to the radar affect the MD effect, as observed in the corresponding spectrograms and power spectra. The Hercules 500 RPA was chosen for further investigation of the variations in ωp and β to examine their impact on the generated spectrograms. Simulations for the Hercules 500 were run with rotor speeds (ωp) of 70 and 140 rev/s. Additionally, for the 70 rev/s rotor speed, simulations were conducted with β values of 0◦, 60◦, and 90◦. These parameters were selected within the actual specifications of the RPAs. The results from configuration 7 were then compared with those measured by [14].
The results obtained from configuration 7 were compared with the measurements presented by [14], which are shown in configuration 8. The radar used in the measurement work operates at a frequency of 9.85 GHz, with a Bandwidth (BW) of 20 MHz, a pulse repetition frequency of 20 - 30 kHz, a transmission power of 29.8 dBm, and horizontal polarization. The radar implemented in the simulation software was configured with the same parameters as those used in the measurements from [14].
B. Simulation Method Through the Application of the Mathematical Model of Bird Movement
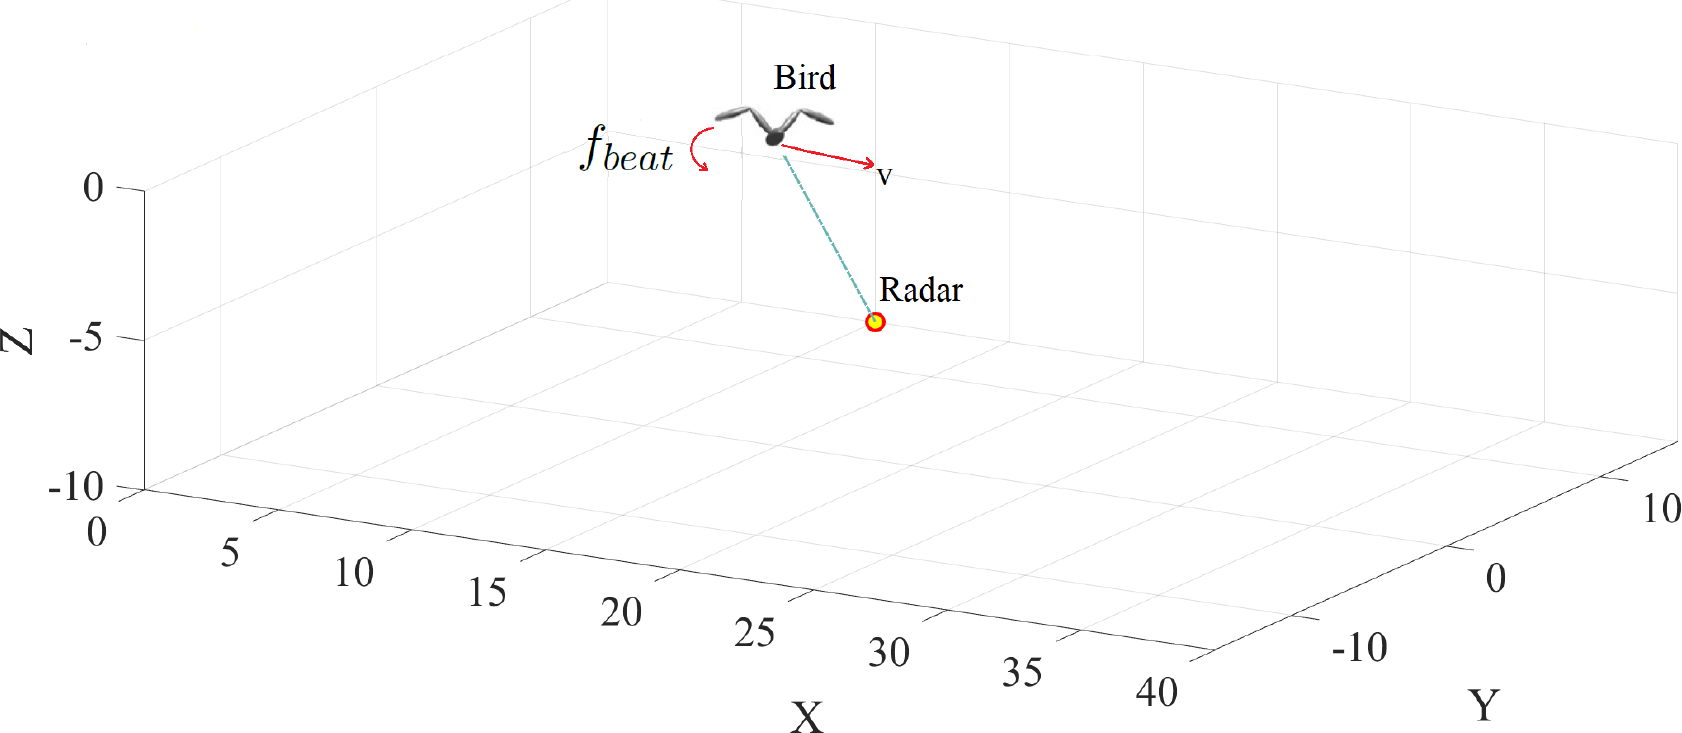
The mathematical model presented in Section III was implemented in software to analyze the MD effect generated by the movement of a bird. The simulation creates a model of the bird with wingbeat motion, where the bird moves from an initial to a final position with constant speed and a fixed wingbeat frequency (fbeat). The movement of the bird is illustrated in Fig. 5.

The bird’s trajectory starts in all configurations at X = 0, Y = 0, and Z = 0. Its flight is observed for 10 seconds, and the trajectory followed is performed along the X-axis only. Table II displays the selected flight speed and fbeat configurations, with speeds of 0.1, 2, and 4 m/s being used. For each speed, the bird traveled 1, 20, and 40 m along the X-axis in each trajectory.
The radar is located at half the distance traveled along the X-axis, and the position on the Y and Z axes was maintained at 15 m and -10 m, respectively. For a speed of 0.1 m/s, the radar was positioned at X = 0.5 m, Y = 15 m, and Z = -10 m; for a speed of 2 m/s, the radar was positioned at X = 10 m, Y = 15 m, and Z = -10 m; and for the speed of 4 m/s, the radar was positioned at X = 20 m, Y = 15 m, and Z = -10 m.
Through software, radar pulse signals were created, the return of the bird’s signal along the trajectory was obtained and processed, and the spectrograms of each setting were generated and analyzed. The flight speed characteristics, fbeat and two species with varying wing sizes were analyzed to evaluate their influence on the MD signature. Furthermore, a comparison with the results obtained from the analysis performed for the MD signature of RPAs was also carried out. Fig. 6, adapted from [10], shows the wingbeat movement of the animated model of the bird that was used to obtain the analyzed echo signal.

Two bird species were selected for analysis: the black-headed gull (Larus dominicanus) and the great frigate bird (Fregata minor). According to [16], the wingspan of the great frigate bird can reach up to 2.6 meters; however, in this work, a wingspan of 2.5 meters was considered, resulting in L1 = 0.625 m and L2 = 0.625 m. The upper arm wingbeat angle amplitude was set to A1 = 40◦, with an upper arm wingbeat angle offset of ψ10 = 15◦ and a forearm strike angle offset of ψ20 = 20◦.
Additionally, according to [17], the black-headed gull has a wingspan ranging from 1.5 to 1.7 meters. For this analysis, a wingspan of 1.5 meters was chosen, yielding L1 = 0.375 m and L2 = 0.375 m, while maintaining the same parameters as the frigate bird for consistency. The size difference between the Fregata minor and the black-headed gull was analyzed to assess its impact on the observation of the MD effect.
The birds’ flight speed and wingbeat frequency (fbeat) were varied according to Table II to analyze the effects of these parameters. Configuration (a) was chosen to observe the MD effect during slow movement, with the bird completing a wingbeat every two seconds. Configurations (b) and (c) illustrate the effects of different wingbeat frequencies-one wingbeat per second and one wingbeat every two seconds, respectively-at a moderate speed. Similarly, configurations (e) and (f) analyze the same wingbeat frequencies but at a higher flight speed. Finally, the various flight speeds selected highlight the corresponding MD effects observed by the radar.
The selected bird parameters were based on real-world data, ensuring a realistic representation of the analyzed MD effects.
The results were compared with a spectrogram obtained from the measurement of a real bird’s flight, as conducted by [14]. The radar used in the measurement experiment operated at a frequency of 9.85 GHz, with a BW of 20 MHz, a pulse repetition frequency of 20-30 kHz, a transmission power of 29.8 dBm, and horizontal polarization. The radar implemented in the simulation software replicated these same settings to ensure consistency with the measurements performed by [14].
C. Micro-Doppler Measurement
To capture the MD effect generated by a quadcopter RPA, experiments were conducted in an open field near the Electronic Warfare Laboratory (LabGE) at the Technological Institute of Aeronautics (ITA). For this purpose, the RPA FIMI X8 SE and an FMCW radar operating at 76 GHz were utilized. The main parameters of the FMCW radar are presented in Table III.
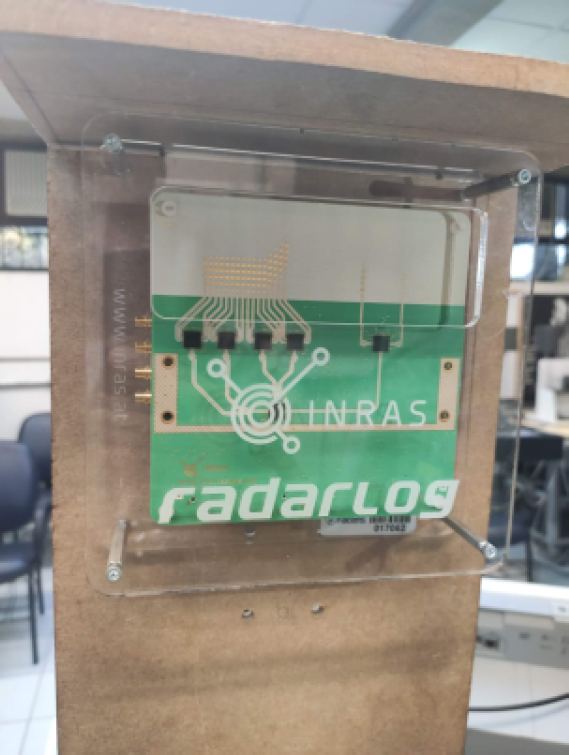
The radar system features a Multiple-Input, Multiple-Output (MIMO) configuration, equipped with 16 receiving antennas and 2 transmitting antennas. Manufactured by INRAS, the radar model, named Radarlog, is capable of storing data during measurements, allowing for subsequent analysis. Fig. 7 provides an image of the Radarlog device.

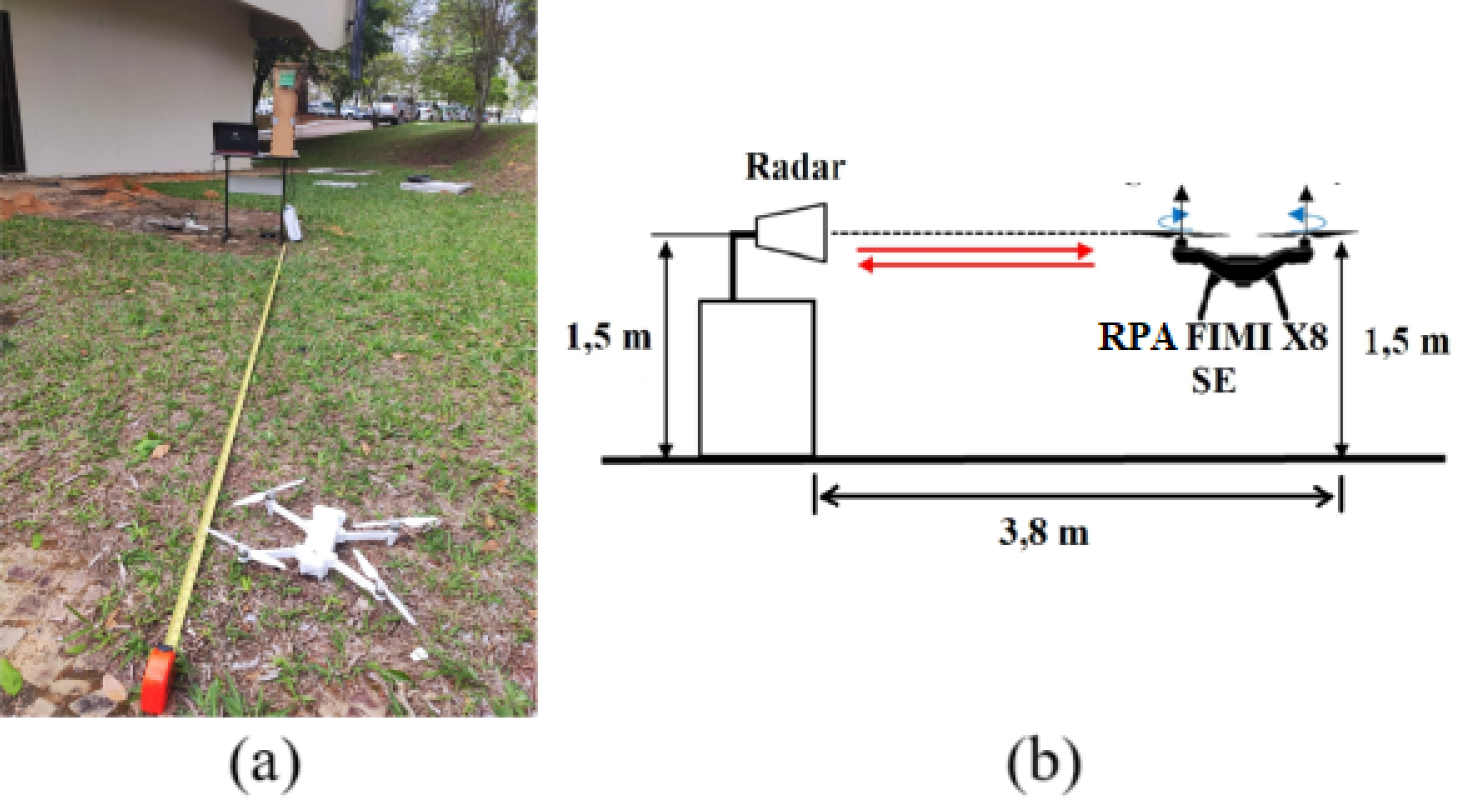
The experiment involved placing the RPA FIMI X8 SE, shown in Fig. 4(a), in flight at a distance of 3.8 m from the radar, with an elevation angle of 0◦. The return signal was recorded for subsequent analysis. Data collected during the measurements were saved in real time by the radar into a spreadsheet, where each row corresponds to an emitted chirp, and the signal obtained from each chirp provides distance information at that moment. A total of 19,712 chirps were stored.
The Doppler frequency information, used to determine the target’s velocity, was extracted by applying a Fast Fourier Transform (FFT) to the relevant parts of the chirps. These parts correspond to the spreadsheet columns indicating the distance at which the RPA was located. This process enabled the generation of spectrograms that display the variation of the Doppler frequency over time, allowing analysis of the additional modulation on the Doppler frequency that characterizes the MD effect.
Fig. 8 (a) shows the setup of the field experiment and Fig. 8 (b) its schematic representation. Initially, the RPA was positioned at a distance of 3.8 m from the radar and flown at a height of 1.5 m, matching the height of the radar antennas to maintain an elevation angle of 0◦. During the flight, the RPA’s distance from the radar varied between 3.1 and 3.8 m, and data were recorded for later analysis.

IV. RESULTS AND DISCUSSION
A. Micro-doppler Effect of Quadcopter RPAs
The spectrograms shown in Figs. 9, 10, 11, and 12 were generated by implementing the configurations presented in Table I in the software. Additionally, Table III displays the values obtained from the generated results and the parameters estimated from them. In the simulations, the r, ωp, and β were selected with varying values to enable observation of the effects produced. The selected parameters align with the actual technical specifications of the RPAs.
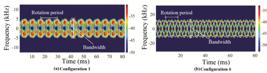
Comparison of spectrograms for different configurations: (a) Configuration 1 and (b) Configuration 6.
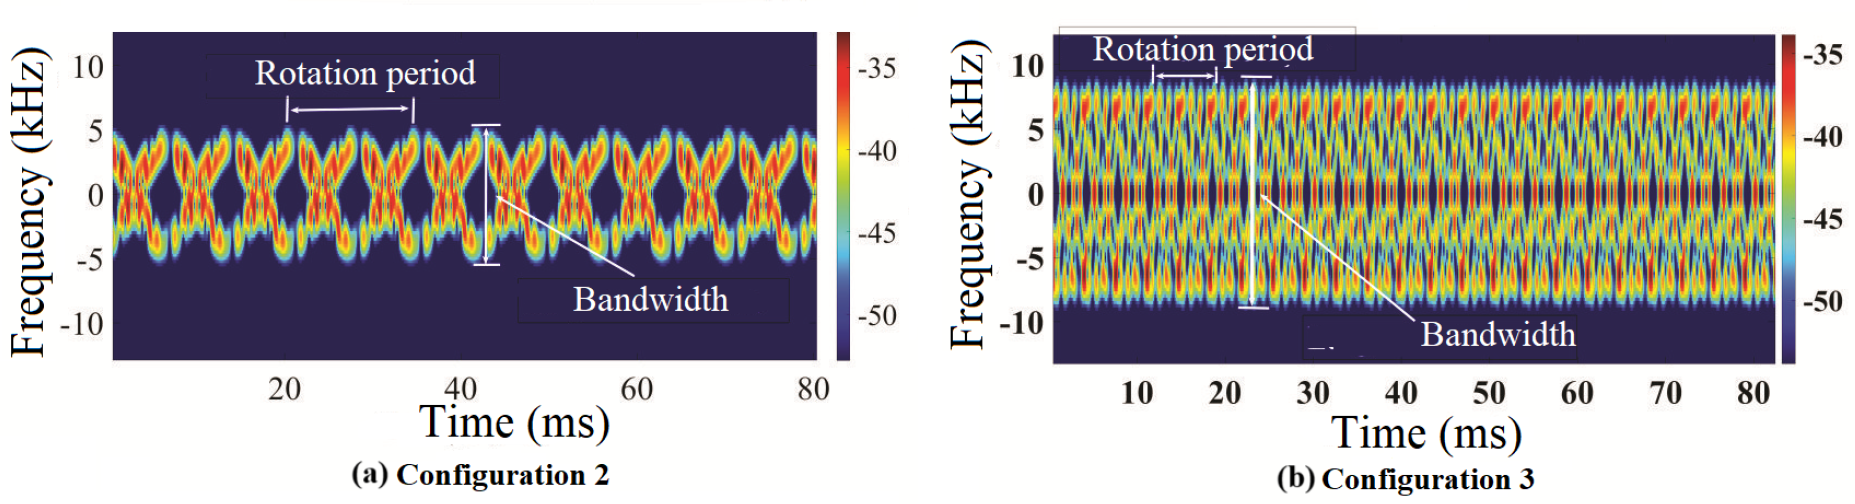
From the analysis of the spectrograms, two key pieces of information can be extracted: the rotation period (Tc) and the BW. Using Tc, the ωp can be calculated as [10]. Furthermore, with BW, β, and ωp, the r can be determined using Eq. (6).
When comparing as per Fig. 9 (a) and Fig. 9 (b), it is possible to notice that the additional Doppler modulation are different due to the fact that the Matrice 300 model has r = 26.6 cm, which is greater than the value of the Fimi X8 SE model, which is r = 10.5 cm. The spectrogram generated by the RPA Matrice 300 has a BW close to 25.25 kHz while the Fimi X8 SE model has a BW of approximately 8 kHz. Therefore, it is possible to notice that the larger RPA models tend to generate spectrograms with a higher BW than the smaller models, since they have larger r.
By analyzing Fig. 10 (a) and Fig. 10 (b), it is evident that, despite using the same RPA model (Hercules 500), the difference in ωp between the configurations leads to significant variations in the spectrogram formats. In configuration 3, ωp is twice the value of configuration 2, resulting in a BW that is slightly more than double that of configuration 2 and a rotation period that decreases to nearly half compared to spectrogram 2. These results demonstrate that an increase in rotor rotation speed significantly impacts the spectrogram’s format.

Comparison of spectrograms for different configurations: (a) Configuration 2 and (b) Configuration 3.
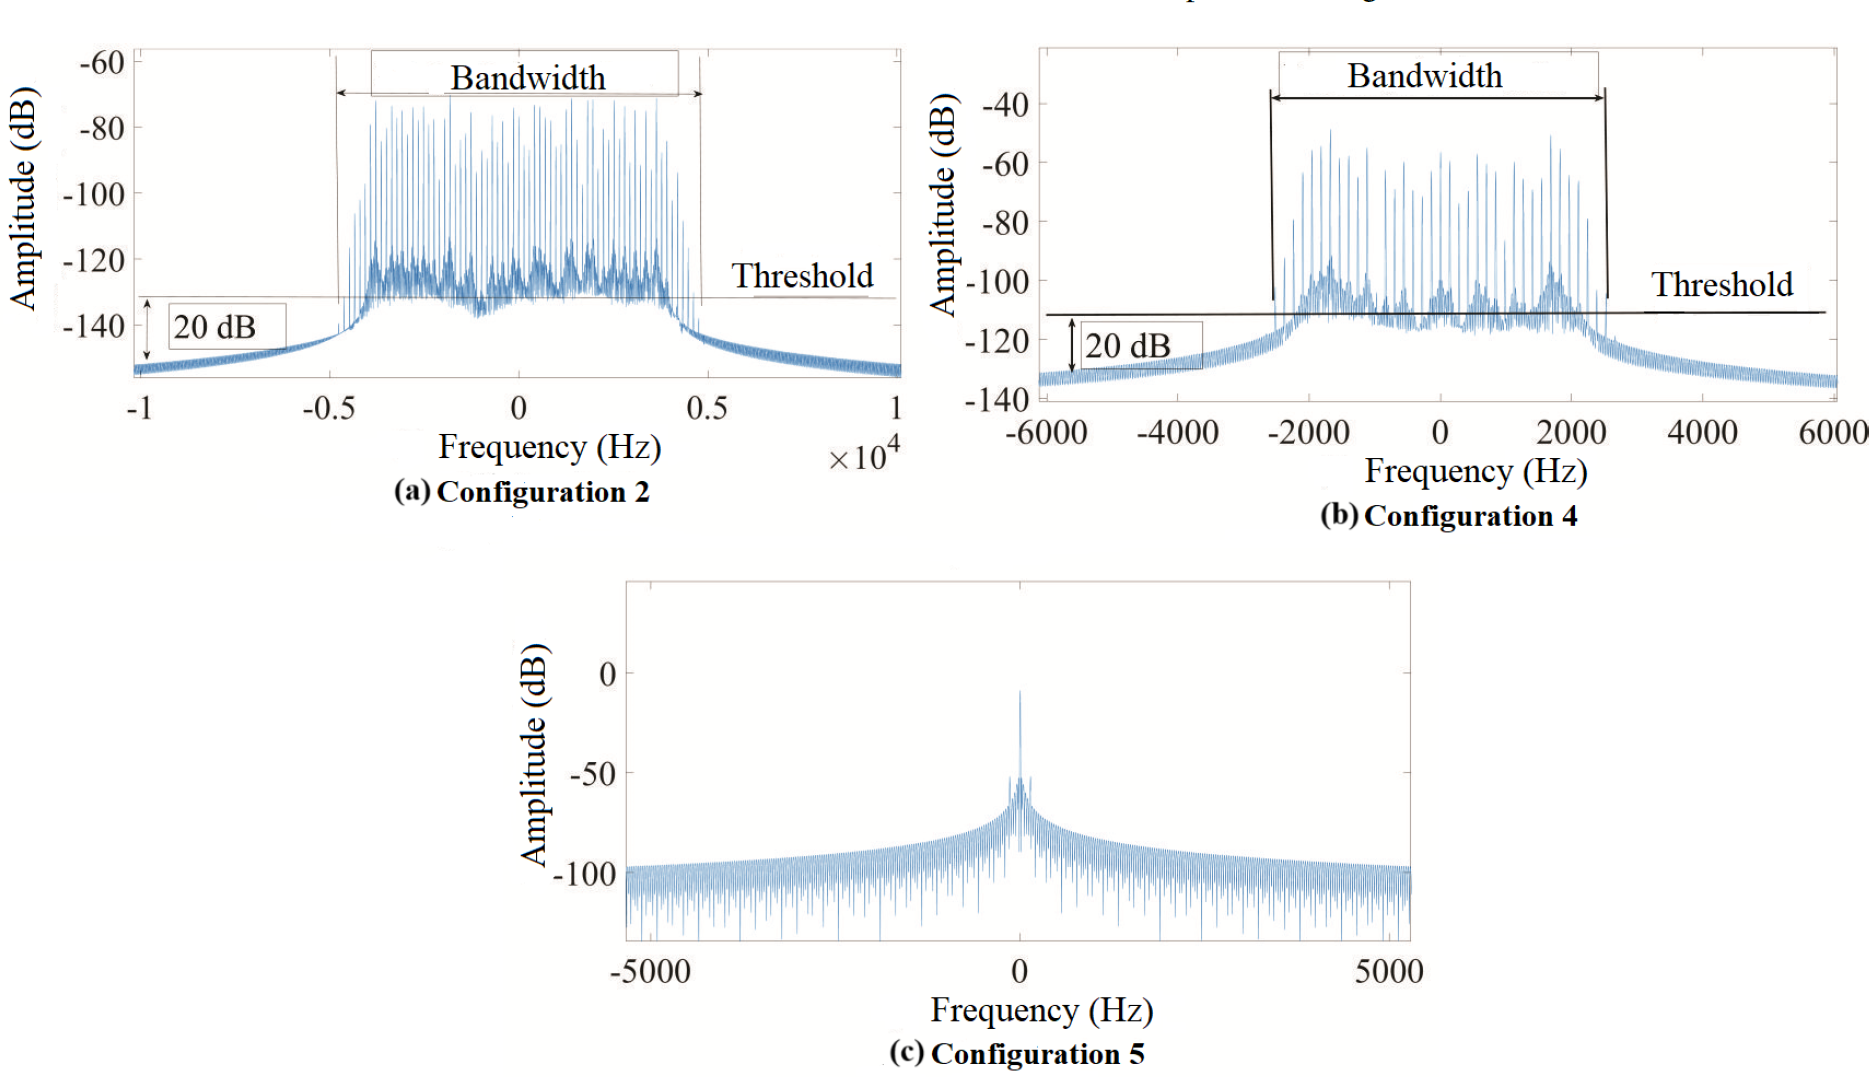
When considering the results obtained for configurations 2, 4, and 5, presented in Fig. 11 (a), (b), and (c), where β was configured at 0◦, 60◦, and 90◦, respectively, it is possible to observe that, although all spectrograms are generated by the rotation of the propellers of the Hercules 500 model with the same ωp = 70 rev/s, the variation in β produces distinct spectrograms.
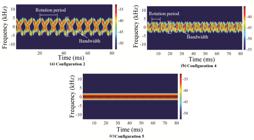
Spectrograms corresponding to: (a) Configuration 2, (b) Configuration 4, and (c) Configuration
The values of BW and Tc differ between configurations 2 and 4, and for configuration 5, it is not possible to measure these parameters. This indicates that the β has a critical impact on the ability to extract meaningful information from the spectrograms. Specifically, as β approaches higher values, such as 90◦, the degradation in the spectrogram makes it challenging or even impossible to determine parameters like BW and Tc. Therefore, accurate measurement of β is essential to ensure the reliability of the data analysis and the correct estimation of the ωp and r.
Thus, it becomes evident that to obtain accurate results, the radar system must measure and incorporate the value of β to extract Tc and ωp. Furthermore, high β values approaching 90◦ can hinder the extraction of information from the spectrogram.
By comparing the spectrograms presented in Fig. 12 (a) and (b), and analyzing the values in Table IV, it is possible to observe a strong similarity between the simulated and measured results. This alignment highlights the accuracy and reliability of the simulation model in replicating real-world conditions, reinforcing its applicability in practical scenarios involving RPA detection and classification. The simulated BW value was 8.1 kHz, while the measured value was 7.09 kHz, representing a variation of 14.19% relative to the measured value. Similarly, the simulated Tc value was 14.3 ms, while the measured value was 14 ms, resulting in a variation of 2.14%.
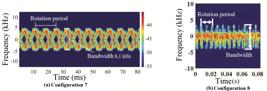
It is important to note that the simulation aimed to replicate the same RPA operating conditions as those used in the measured results, including parameters such as β, ωp, and r. However, small variations in these values can affect the results. Despite these potential discrepancies, the simulated results demonstrated a high level of agreement with the measured ones, further supporting the validity and robustness of the simulation.
Additionally, when comparing the results obtained from configuration 7 with other simulated results for different aircraft models, it is evident that the similarity observed with Configuration 8 enables the differentiation of the Phantom IV model from the Matrice 300 model (Configuration 6), which presented a BW of 25.25 kHz. Furthermore, it also enables differentiation for the Fimi X8 SE model (Configuration 1), which presented a Tc of 12.2 ms and a chopping frequency of 160 Hz. Additionally, it is possible to differentiate from the result presented in Configuration 3, where the Hercules 500 model, despite having the same r value, used a ωp of 140 rev/s, generating a BW of 17.3 kHz and a Tc of 7.1 ms. This analysis demonstrates that the simulated result creates a framework for the measured one, allowing differentiation between various aircraft models.
Finally, despite the similarity between these parameters, the measured spectrogram exhibits a stronger signal close to 0 dB. This occurs because the simulation only considers the return signal from the rotating parts of the RPA and does not include the return from the main body. This approach is taken because, for the extraction of classification parameters for RPAs, only the return of the MD effect is of interest [10].
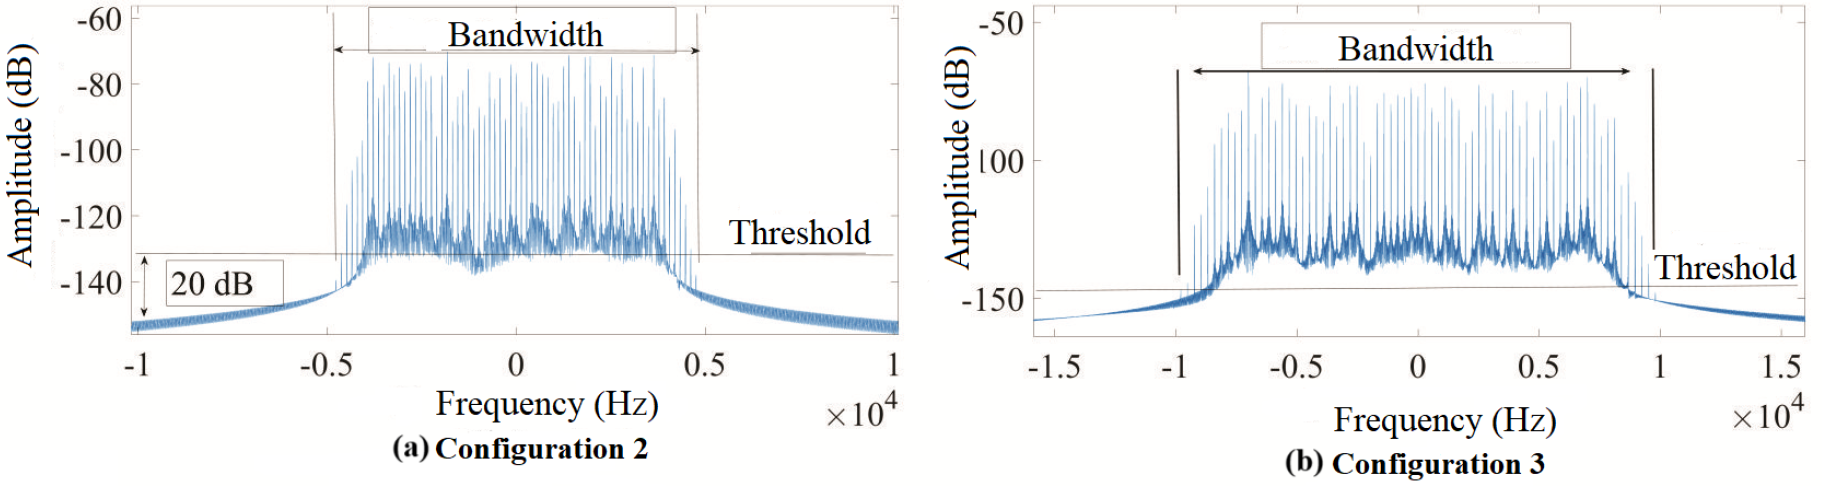
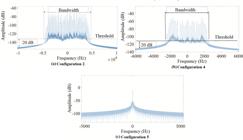
Power spectrum is a mathematical representation of the power distribution at different frequencies in a signal. It is possible to extract the BW and the chopping frequency through the power spectrum. The BW value can be obtained considering the values above the threshold. For the values presented, the threshold was selected from 20 dB above the mean amplitude of the Doppler spectrum. Figs. 13, 14, 15, and 16 show the BW of each RPA model. The value of the chopping frequency can be obtained by considering the difference between the first and the second spectral line of the positive band of the power spectrum [14]. Figs. 17, 18, 19, and 20 present the spectral lines of the positive band and the respective chopping frequency generated by the analyzed configurations, where configuration 8 represents the value measured by [14]. By using Eq. (6) and knowing the value of N, it is possible to arrive at the value of ωp.


Fig. 13 (a) and (b) show the power spectra obtained from Configurations 1 and 6, respectively. Observing the power spectra, it is possible to notice that the BW for the RPA Matrice 300 is greater than that obtained for the RPA Fimi X8 SE. This was mainly due to the fact that the r of the Matrice 300 aircraft was higher than that of the Fimi X8 SE.
By analyzing Fig. 14 (a) and (b), which were obtained from the RPA Hercules 500, it is evident that BW more than doubled in Configuration 3 compared to Configuration 2, where the values ωp were 70 rev / s and 140 rev / s, respectively.
Fig. 15 (a), (b) and (c) show configurations 2, 4, and 5, respectively. Additionally, it is evident that changing β significantly alters the power spectrum, and in configuration 5, the BW value cannot be extracted from the generated spectrum.
Finally, comparing the power spectra of configurations 7, shown in Fig. 16 (a), and configuration 8, shown in Fig. 16 (b), it is evident that both spectra have similar BW. However, in configuration 8, generated by measurement for the RPA Phantom 4, the return from the main body is clearly visible, whereas in configuration 7, this return was not considered.

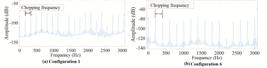
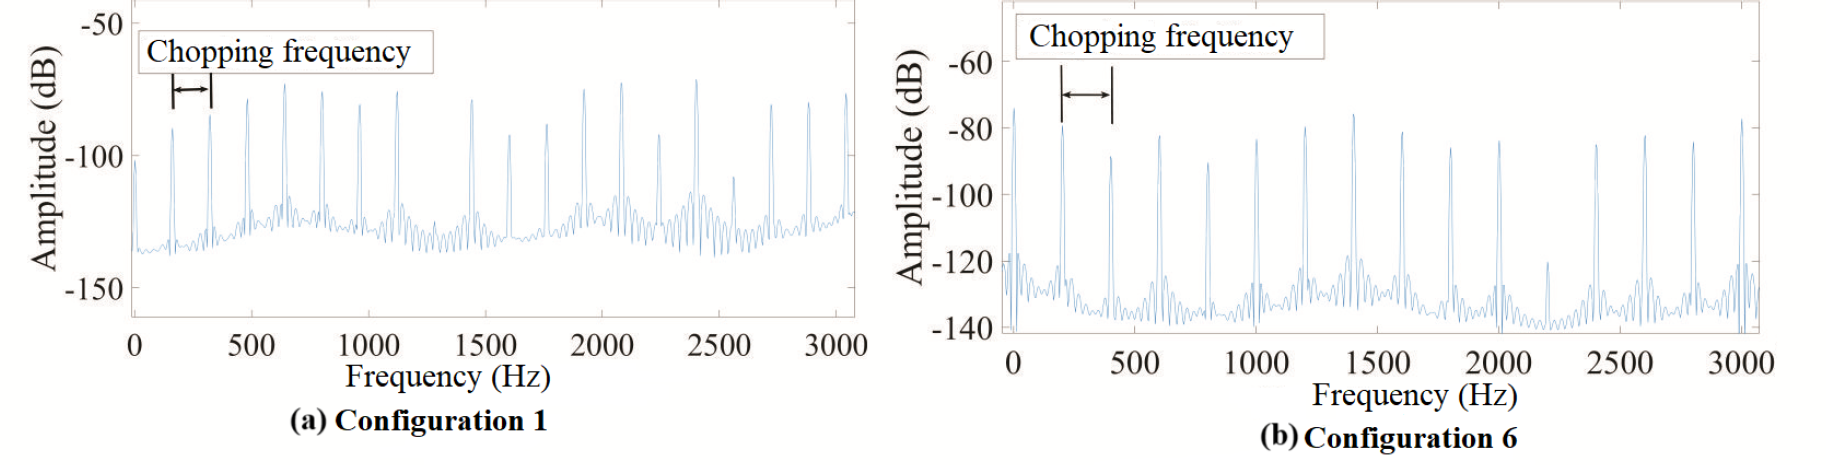
Fig. 17 (a) and (b) present the chopper frequency for configurations 1 and 6, corresponding to the Matrice 300 and Fimi X8 SE models, respectively. These models have different propeller sizes, and it is evident that the spacing between the spectral lines is greater in configuration 6.
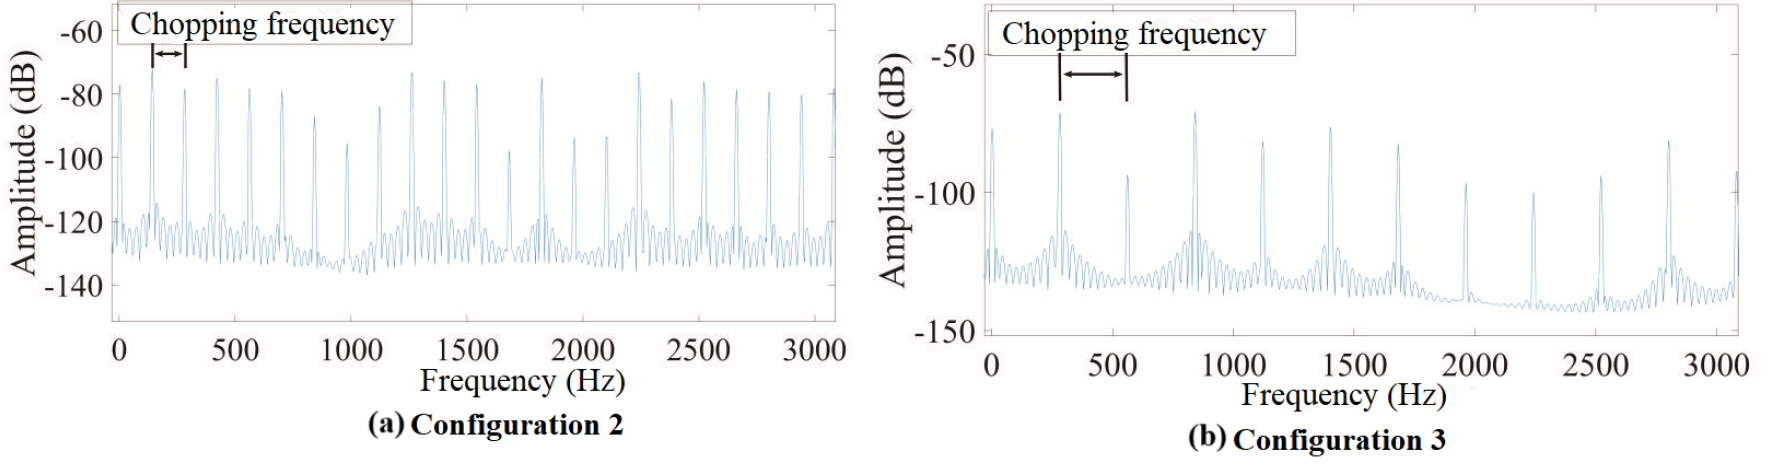
Fig. 18 (a) and (b) show the spacing between the spectral lines for the power spectra generated by configurations 2 and 3. It is possible to observe that the spectral lines are more closely spaced for configuration 3. The greater spacing for configuration 3 occurs because configurations 2 and 3 represent the same RPA model (Hercules 500), but configuration 3 uses twice the ωp of configuration 2.
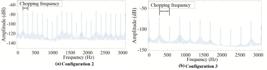
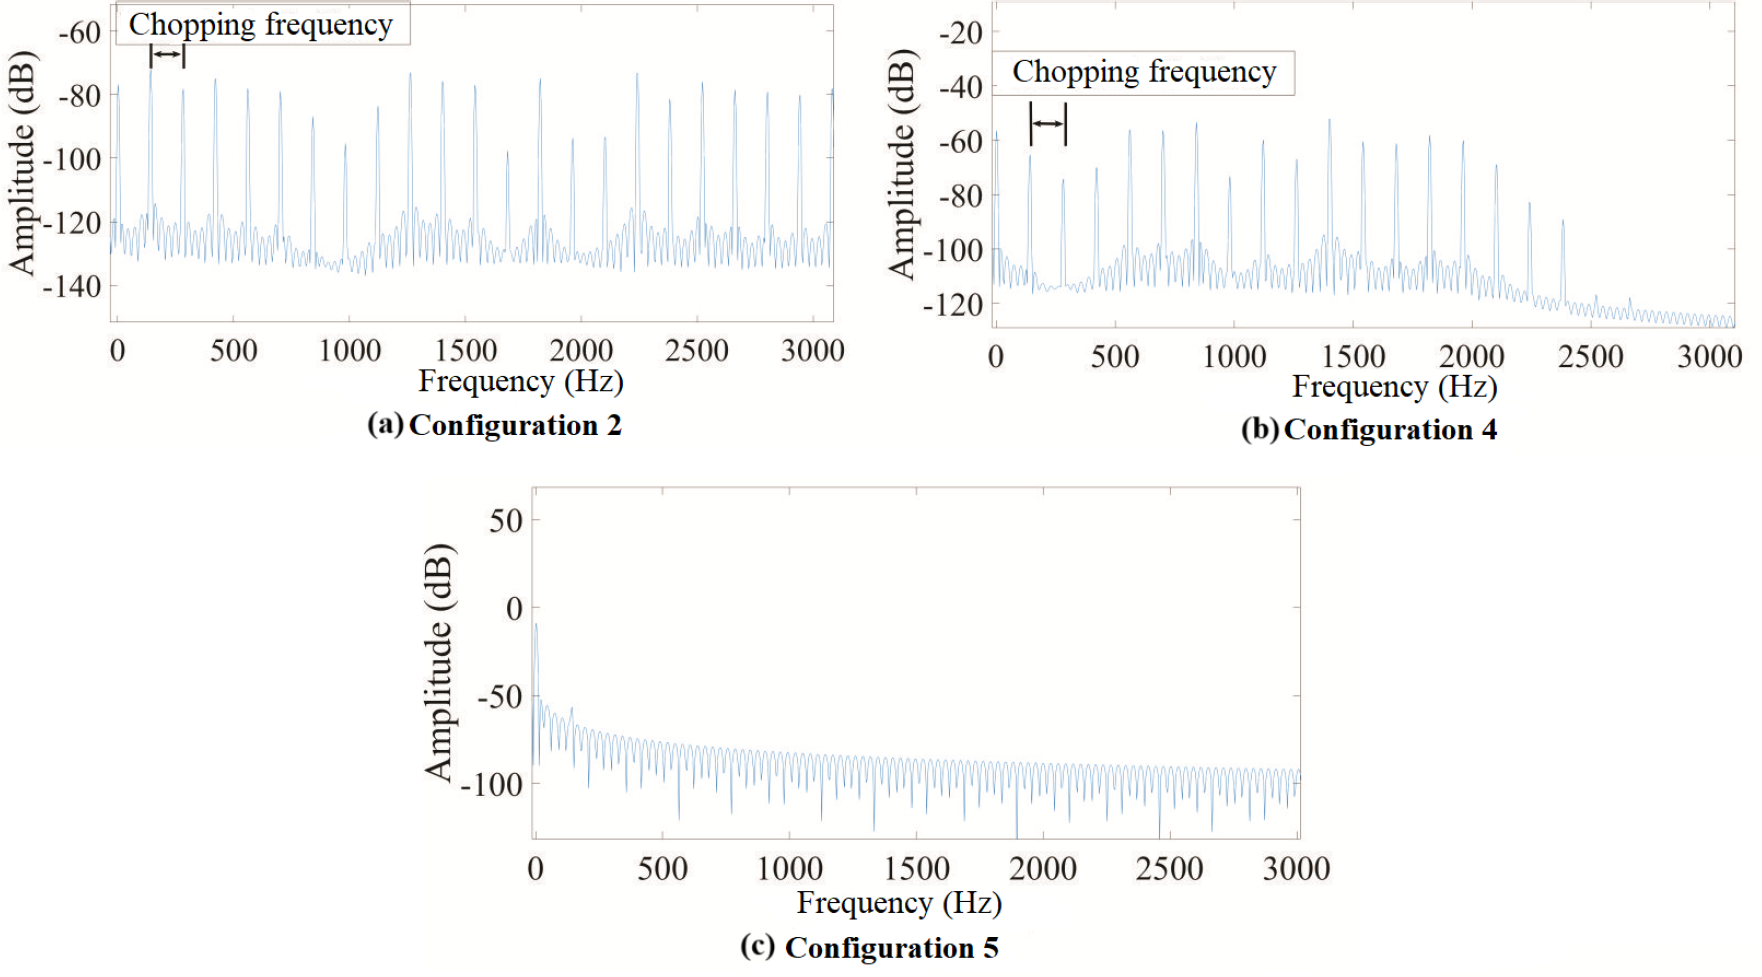
Fig. 19 (a), (b), and (c) display the chopper frequency for configurations 2, 4, and 5, which correspond to the same RPA model (Hercules 500) but with elevation angles of 0◦, 60◦, and 90◦, respectively. By observing the spacing of the spectral lines, it is possible to notice that the chopper frequencies change as β increases.

Fig. 20 presents a comparison regarding the distance between the first and second spectral lines of the power spectrum generated by simulation, shown in Fig. 20 (a), and the one measured for the RPA Phantom 4, shown in Fig. 20 (b). The simulated BW and chopping frequency results extracted from the power spectra for the RPA Phantom IV were close to the measured results. When analyzing the power spectra shown in Fig. 20 and comparing the results in Table IV, it is possible to observe that the simulated BW is 8 kHz, while the measured result is 7.5 kHz, which represents a variation of 6.66%. In addition, the simulated chopping frequency was 140.6 Hz, while the measured value was 140 Hz, representing a difference of 0.4% relative to the measured one.

Additionally, when comparing the results of configuration 7, it is possible to differentiate the data from the RPA Phantom IV with the data from other RPA models such as the Matrice 300, Fimi X8 SE, and Hercules 500 with ωp of 140 rev/s. Considering that the BW for the Matrice 300, Configuration 6, is 25.2 kHz and its chopper frequency is 199.2 Hz, the Fimi X8 SE has a chopper frequency of 160 Hz. The Hercules 500, with twice the rotor speed and the same r size, has a BW of 17.1 kHz and a chopper frequency of 277.3 Hz.
Therefore, it can be concluded that the simulated results are close to the measured results and allow the RPA Phantom IV to be differentiated from other aircraft models or similar models with different rotor speeds. Thus, the simulated results can be used in the power spectrum modeling of RPAs.
Table IV presents the values extracted from the spectrograms and power spectrum. Considering that configuration 5 does not allow extracting information, it was not inserted in this table. With the generated values, Eq. (6) and the relation were used to estimate r and ωp.
B. Micro-doppler Effect of Birds
Figs. 21, 22, 23, and 24 present the spectrograms generated through simulations in which the configurations presented in Table II were implemented using the equations from Section III. The BW and wingbeat period values obtained from the generated spectrograms are shown in Table V.
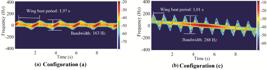
Fig. 21 (a) and (b) show the spectrograms for configurations (a) and (c), respectively, which correspond to different flight speeds and fbeat values. By analyzing the spectrograms, it is evident that increasing the flight speed and fbeat results in an increase in the signal bandwidth and a decrease in the wingbeat period.
To observe the variation in bandwidth and wingbeat period, configuration (d) was used. For this configuration, the upper arm and forearm lengths of the bird’s wing are 0.375 m. Fig. 22 (a) and (b) compare the spectrograms for configuration (c), which assumes an upper arm and forearm length of 0.625 m, with configuration (d), which uses reduced dimensions. Flight speed and fbeat remain the same for both configurations. The analysis reveals that the BW value decreases for the bird with smaller wingspans compared to the one with larger wingspans. Specifically, for configuration (d), BW = 161.6 Hz, while for configuration (c), BW = 288 Hz. No change was observed in the wingbeat period. Thus, reducing wing size directly reduces the BW.
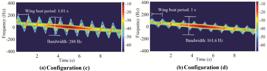
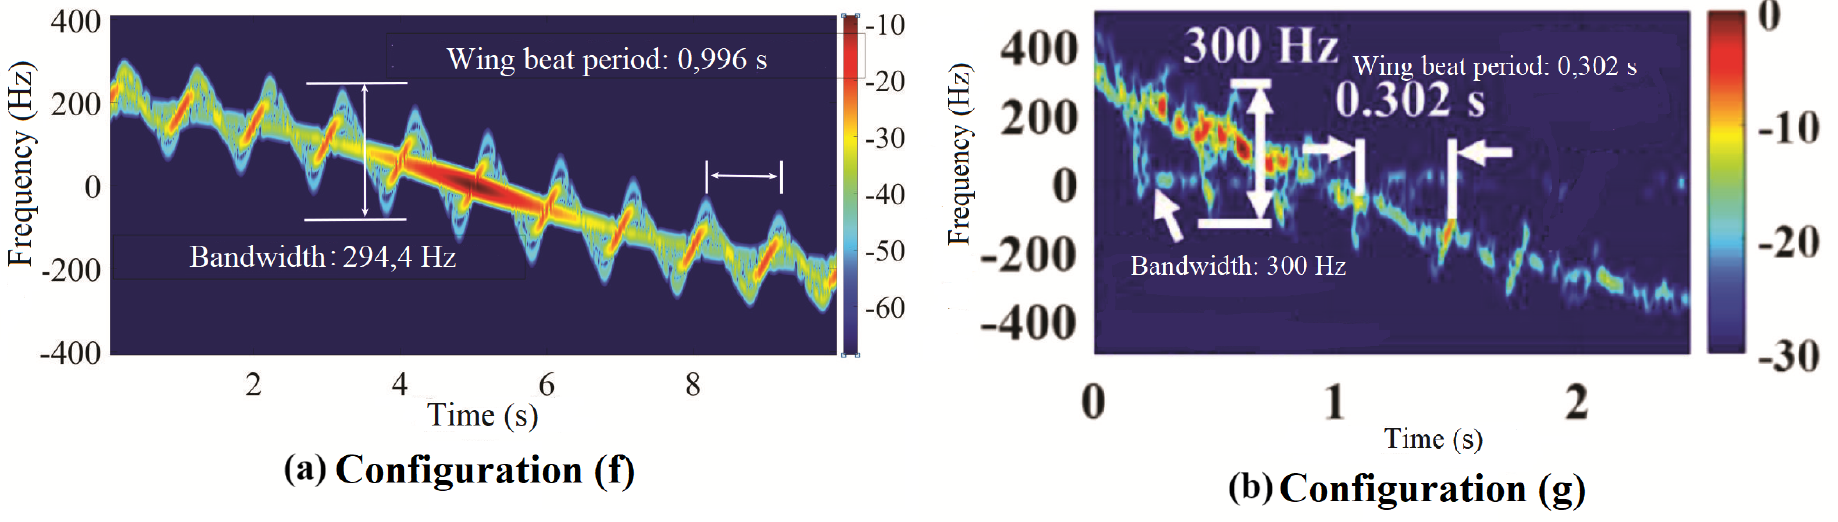
Fig. 23 illustrates the effect of increased flight speed on the spectrogram’s appearance. In configuration (f) shown in Fig. 23 (b), a variation in the central Doppler frequency is observed, starting at 200 Hz and ending at -200 Hz. This variation occurs because the radar is positioned at the midpoint of the bird’s path, and at t = 5 s, the bird is at its closest point to the radar. For t < 5 s, the bird is approaching the radar, while for t > 5 s, it is moving away. Additionally, the BW increases significantly from configuration (b), Fig. 23 (b), to configuration (f).

Finally, when observing Fig. 24 (a) which shows the simulated result and Fig. 24 (a) the measured, it is possible to note that the spectrograms are very similar. Although the author does not provide information about the bird’s wing dimensions, flight speed, or fbeat, it can be inferred that if the bird has dimensions similar to a frigate minor, it was likely flying at a speed greater than 4 m/s and with a wingbeat frequency of approximately 3.3 Hz.

By analyzing the previous figures, the oscillations representing the wingbeat can be observed, allowing the determination of the wingbeat period. For configurations where fbeat = 0.5 Hz, the wingbeat period is approximately 2 seconds, while for fbeat = 1 Hz, the wingbeat period is approximately 1 second. Additionally, configurations with a 1 Hz wingbeat at the same flight speed exhibit a greater BW, as seen when comparing configuration (c) to (b) and configuration (f) to (e). Furthermore, configuration (d), which has shorter upper arm and forearm dimensions, presented a smaller BW compared to configuration (c), despite having the same fbeat and flight speed. This indicates that smaller birds generate smaller BW values.
At t = 5 s, the bird is at its closest radial distance to the radar, as the radar was positioned at the midpoint of the bird’s trajectory along the x-axis. When analyzing the generated spectrograms, it is evident that all of them exhibit greater signal intensity when the bird is closer to the radar. Conversely, at t = 0 s and t = 10 s, the signal intensity is lower. Additionally, it is noticeable that the central frequency is positive for t < 5 s (indicating the bird is approaching) and becomes negative for t > 5 s (indicating the bird is moving away). Finally, by observing spectrograms (e) and (f), it can be seen that at t = 0 s, the frequency is 200 Hz; at t = 10 s, it is -200 Hz; and at t = 5 s, it is zero.
The BW measured from the spectrograms obtained in the RPA simulations ranged from 6.75 kHz to 25.25 kHz, while the variation observed in the spectrograms for birds ranged from 156.8 Hz to 300 Hz. These results demonstrate that RPAs generate a significantly higher BW in spectrograms compared to birds, indicating that RPAs can be effectively differentiated from birds based on the BW they produce.
C. Analysis of Simulated Results: Comparison Between RPAs and Birds
As demonstrated in Subsection A, the simulated and measured results for RPAs are closely aligned, indicating that the simulated results can effectively distinguish RPAs with different rotor sizes and even models with the same r value but different rotor rotation speeds. Similarly, the simulated and measured results for birds, as presented in Subsection B, show a comparable level of accuracy.
Moreover, as shown in Table IV, the BW values for RPAs ranged from 6.75 kHz to 25.25 kHz, while for birds, this range was from 156.8 Hz to 300 Hz. This significant difference in BW values demonstrates that RPAs produce substantially higher BW values compared to birds. Consequently, this variation reinforces the validity of using simulated results to generate data that supports the development of models capable of distinguishing RPAs from birds.
Finally, the simulated results significantly facilitate the collection of data, such as those presented in Tables IV and V, which can be used to build a database for training neural networks to automatically classify RPAs and birds on radar systems, as shown in works such as [11] and [18]. Collecting data from a wide variety of birds and RPAs is costly and labor-intensive. Therefore, the methodology presented in this study offers a practical approach to creating databases that support neural networks for the automatic classification of these targets.
D. Analysis of MD Measures Performed
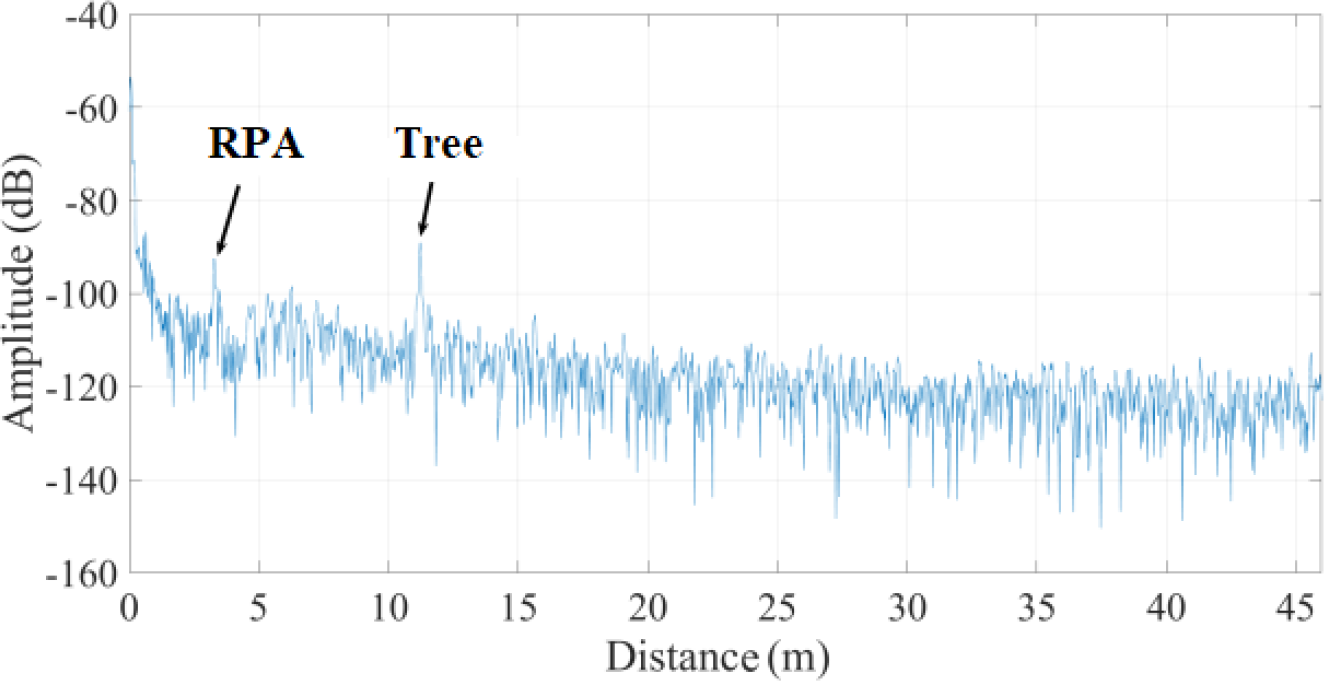
The FMCW Radarlog generated a spreadsheet in HDF5 format, where each row represents a chirp, and each chirp contains 2048 samples corresponding to distance measurements. By applying a FFT to one of the chirps, the distance graph shown in Fig. 25 is obtained. It is possible to observe two distinct points: one at 3.8 m and another at 11 m, which represent, respectively, the RPA and a tree present at the measurement location.

Furthermore, by analyzing the variation of chirps over time, it is possible to extract information about the target’s speed. The columns corresponding to the position where the RPA Fimi X8 SE was located were analyzed, and a FFT was applied to this sequence of points. Fig. 26 shows the spectrogram generated from these data.

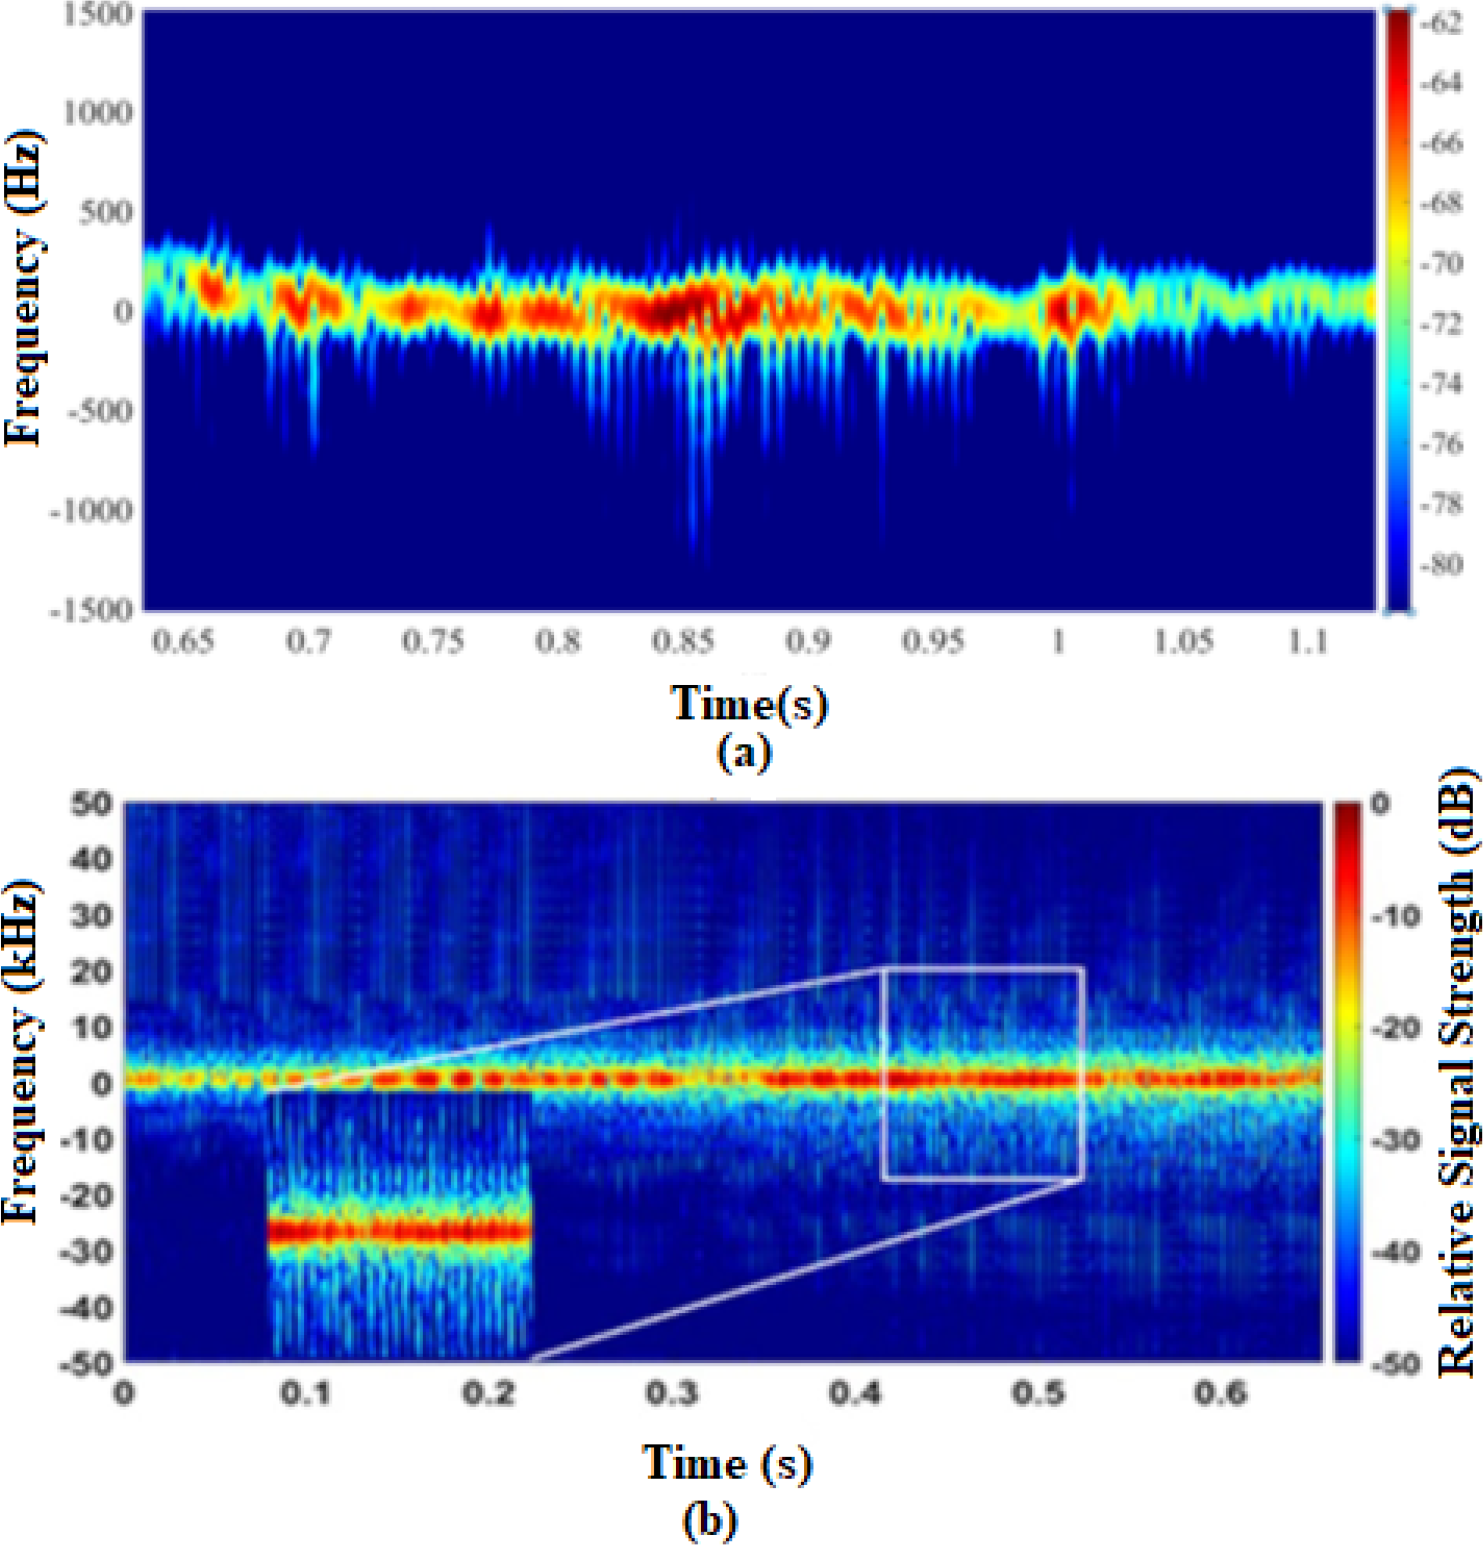
Fig. 26 presents the spectrogram generated by observing the RPA Fimi X8 SE at a distance of 3.8 m. Only data corresponding to this specific distance were considered, with signals from other positions eliminated. By analyzing this spectrogram, information about the MD effect can be obtained. Additionally, considering that the RPA moved during the data recording, it is evident that within the time interval from 0.4 to 0.8 seconds, there is an intensification of the signal. This indicates that the aircraft was positioned precisely at the 3.8 m distance point during that period. However, due to a decrease in the intensity of the Doppler frequency, it can be observed that the RPA did not remain at that position throughout the entire recording period. It was outside this position during the intervals from 0 to 0.4 seconds and from 0.8 to 1.2 seconds.
Considering that the FMCW Radarlog radar operates with different parameters compared to the radar used in the simulation model, whose results are presented in Subsection A, the calculated results extracted from the FMCW Radarlog radar will be compared with the measured results from [11], which used an FMCW radar operating at 94 GHz. In that study, the RPA was positioned 20 m from the radar, and a methodology similar to the one adopted in this work was applied.
Fig. 27 (a) presents the spectrogram measured in the field, whereas Fig. 27 (b) displays the result reported by [11]. Both spectrograms exhibit a similar frequency spread behavior. Near the frequency of 0 Hz, there are more intense signals, accompanied by a scattering of lower-intensity frequencies around 0 Hz. Due to the radar used by [11] operating at a higher frequency of 94 GHz, a Doppler frequency of greater amplitude is observed in its spectrogram compared to the spectrogram produced by the Radarlog, which operates at 76 GHz. Additionally, small streaks with constant periodicity can be observed in the format of both spectrograms.
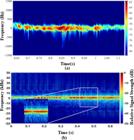
Spectrogram measured in the field shown in (a), and spectrogram obtained by [11] shown in (b).
V. CONCLUSION
This study aimed to analyze the use of the MD effect generated by the rotating parts of quadcopter RPAs to classify these aircraft by estimating the ωp and r. Additionally, it investigated the MD effect produced by the flapping motion of bird wings to identify their characteristics and derive parameters that can differentiate RPAs from birds. Finally, it measured the MD effect generated by the RPA Fimi X8 SE using the FMCW Radarlog radar and analyzed the resulting spectrograms.
The results achieved by applying mathematical modeling of the echo signal of quadcopter RPAs demonstrated that ωp and r produce characteristic MD effects. By analyzing this effect and extracting the signal BW, chopping frequency, and Tc from spectrograms and power spectra, it was possible to estimate ωp and r. The analysis provided the following findings: the RPA Fimi X8 SE with ωp = 80 rev/s produced BW = 8 kHz and Tc = 12.2 ms; the RPA Hercules 500 with ωp = 70 rev/s produced BW = 8.2 kHz and Tc = 14.3 ms; the RPA Matrice 300 with ωp = 100 rev/s produced BW = 25.25 kHz and Tc = 10 ms; and the RPA Phantom 4 with ωp = 70 rev/s produced BW = 8.1 kHz and Tc = 14.3 ms. Using Eq. (6) and the relation ωp = 1/Tc, it was possible to estimate r and ωp for each RPA.
Furthermore, it was observed that β significantly affects the measurements of BW and Tc. To correctly estimate ωp and r, the radar must calculate β during measurement, as it is a component of Eq. (6). For example, the RPA Hercules 500 with β = 60◦ and ωp = 70 rev/s produced BW = 6.75 kHz and Tc = 14.2 ms, values distinct from those obtained at β = 0◦. Additionally, for β = 90◦, it was impossible to extract BW and Tc due to spectrogram degradation.
Using the mathematical model of bird wingbeat motion, it was observed in the spectrograms that wingbeat movements are distinct from the motion of the bird’s main body. For example, the Frigate Minor at a flight speed of 2 m/s and fbeat = 0.5 Hz generated BW = 156.8 Hz and a wingbeat period of 1.97 s. When fbeat was increased to 1 Hz, BW increased to 288 Hz, and the wingbeat period decreased to 1.01 s. Similarly, for the Black-headed Gull, decreasing wing size at a flight speed of 2 m/s and fbeat = 1 Hz resulted in BW = 161.6 Hz, showing that smaller birds generate smaller BW. For the Frigate Minor at a flight speed of 4 m/s and fbeat = 1 Hz, BW increased to 294.4 Hz, indicating that higher flight speeds result in larger BW. Therefore, birds with higher fbeat, larger wings, and greater flight speeds generate broader BW.
By comparing the MD effects of birds and RPAs, it was found that BW can be used to distinguish these targets. Specifically, the BW observed for birds ranged from 156.8 Hz to 300 Hz, while for RPAs, it ranged from 6.75 kHz to 25.25 kHz. This significant difference allows clear differentiation between birds and RPAs based on their MD characteristics.
Finally, the simulated results demonstrated their potential to replace measured results in the creation of databases for differentiating RPAs and birds. Simulated data facilitate the generation of extensive datasets while reducing the cost and effort associated with field measurements. These databases can support the training of machine learning models, such as neural networks, to automatically classify RPAs and birds, contributing to more efficient and automated radar systems.
REFERENCES
- [1] A. S. Soares, W. S. L. Soares, G. R. Colen, A. P. da Silveira, P. V. G. Sampaio, and V. P. R. Magri, “Análise da detecção de drones por radar marítimo de navegação empregando o software advanced refractive effects prediction system (areps),” Revista Pesquisa Naval, vol. 1, no. 33, pp. 59-65, 2021.
-
[2] T. Coffey and J. A. Montgomery, “The emergence of mini uavs for military applications,” Military Technology, vol. 28, pp. 28-37, 2004. DOI:10.1109/ICUS61736.2024.10839780.
» https://doi.org/10.1109/ICUS61736.2024.10839780. -
[3] J. P. Yaacoub, H. Noura, O. Salman, and A. Chehab, “Security analysis of drones systems: Attacks, limitations, and recommendations,” Internet of Things, vol. 11, pp. 1-39, 2020. DOI:10.1016/j.iot.2020.100218.
» https://doi.org/10.1016/j.iot.2020.100218. -
[4] Z. Shi, X. Chang, C. Yang, Z. Wu, and J. Wu, “An acoustic-based surveillance system for amateur drones detection and localization,” IEEE Transactions on Vehicular Technology, vol. 69, no. 3, pp. 2731-2739, 2020. DOI:10.1109/TVT.2020.2964110.
» https://doi.org/10.1109/TVT.2020.2964110. -
[5] U. Seidaliyeva, D. Akhmetov, L. Ilipbayeva, and E. T. Matson, “Real-time and accurate drone detection in a video with a static background,” Sensors, vol. 20, no. 14, 2020. DOI:10.3390/s20143856. [Online]. Available: https://www.mdpi.com/1424-8220/20/14/3856
» https://doi.org/10.3390/s20143856.» https://www.mdpi.com/1424-8220/20/14/3856 -
[6] A. Sedunov, D. Haddad, H. Salloum, A. Sutin, N. Sedunov, and A. Yakubovskiy, “Stevens drone detection acoustic system and experiments in acoustics uav tracking,” in 2019 IEEE International Symposium on Technologies for Homeland Security (HST), pp. 1-7, 2019. DOI:10.1109/HST47167.2019.9032916.
» https://doi.org/10.1109/HST47167.2019.9032916. -
[7] P. Flak, “Drone detection sensor with continuous 2.4 ghz ism band coverage based on cost-effective sdr platform,” IEEE Access, vol. 9, pp. 114574-114586, 2021. DOI:10.1109/ACCESS.2021.3104738.
» https://doi.org/10.1109/ACCESS.2021.3104738. -
[8] V. Semkin, J. Haarla, T. Pairon, C. Slezak, S. Rangan, V. Viikari, and C. Oestges, “Analyzing radar cross section signatures of diverse drone models at mmwave frequencies,” IEEE Access, vol. 8, pp. 48958-48969, 2020. DOI:10.1109/ACCESS.2020.2979339.
» https://doi.org/10.1109/ACCESS.2020.2979339. -
[9] A. Coluccia, G. Parisi, and A. Fascista, “Detection and classification of multirotor drones in radar sensor networks: A review,” Sensors, vol. 20, no. 15, 2020. DOI:10.3390/s20154172.
» https://doi.org/10.3390/s20154172. - [10] V. C. Chen, The Micro-Doppler Effect in Radar, 1st ed. Artech House, 2019.
-
[11] X. Chen, H. Zhang, J. G. J. Song, J. Li, and Z. He, “Micro-motion classification of flying bird and rotor drones via data augmentation and modified multi-scale cnn,” Remote Sensing, vol. 14, no. 5, p. 1107, 2022. DOI:10.3390/rs14051107.
» https://doi.org/10.3390/rs14051107. -
[12] H. Hou, Z. Yang, and C. Pang, “Rotor uav’s micro-doppler signal detection and parameter estimation based on frft-fsst,” Sensors, vol. 21, no. 21, p. 7314, 2021. DOI:10.3390/s21217314.
» https://doi.org/10.3390/s21217314. -
[13] M. Leonardi, G. Ligresti, and E. Piracci, “Drones classification by the use of a multifunctional radar and micro-doppler analysis,” Drones, vol. 6, no. 5, p. 124, 2022. DOI:10.3390/drones6050124.
» https://doi.org/10.3390/drones6050124. -
[14] K.-B. Kang, J.-H. Choi, B.-L. Cho, J.-S. Lee, and K.-T. Kim, “Analysis of micro-doppler signatures of small uavs based on doppler spectrum,” IEEE Transactions on Aerospace and Electronic Systems, vol. 57, no. 5, pp. 3252-3267, 2021. DOI:10.1109/TAES.2021.3074208.
» https://doi.org/10.1109/TAES.2021.3074208. - [15] P. Tait, Introduction to Radar Target Recognition, 1st ed. Institution of Engineering and Technology, 2005, vol. 18.
- [16] M. A. T. B. d. M. Brito, “Study of ectoparasites of frigatebirds (fregata magnificens mathews, 1914) from animal rehabilitation centers on the coast of rio de janeiro and são paulo - brazil,” Master’s thesis, Universidade Federal Fluminense, Niterói, Rio de Janeiro, Brazil, 2018.
- [17] L. A. Ebert, “Analysis of reproductive biology, vulnerability to chemical contaminants and pathogenic bacteria of larus dominicanus lichtenstein, 1823 (birds, laridae) on the coast of santa catarina, brazil,” Ph.D. dissertation, Universidade Federal de São Carlos, São Carlos, São Paulo, Brazil, 2015.
-
[18] A. Hanif, M. Muaz, A. Hasan, and M. Adeel, “Micro-doppler based target recognition with radars: A review,” IEEE Sensors Journal, vol. 22, no. 4, pp. 2948-2961, 2022. DOI:10.1109/JSEN.2022.3141213.
» https://doi.org/10.1109/JSEN.2022.3141213.