Propose of a Plasmonic Sensor Using a Photonic Quasi-Crystal Fiber and Temperature-Responsive Liquid Crystals
Abstract
A miniaturized and highly sensitive plasmonic sensor based on surface plasmon resonance (SPR) in a photonic quasi-crystal fiber (PQCF) is proposed in this study. The sensor structure consists of a replicated and defect-modified quasi-periodic unit cell that forms a central core and two symmetrically arranged enlarged vertical cores. These cores are coated with a thin layer of gold to induce the plasmonic effect, allowing the detection of analytes inserted inside them. The combination of SPR and PQCF technologies provides accurate detection of the fields in the region with the analytes. In addition, the proposed sensor incorporates a temperature-sensitive liquid crystal strategically distributed in the microstructure, making the device also capable of detecting thermal variations in the analyzed material, expanding its functionality.
Keywords
Liquid crystal; plasmonic effect; PQCF; SPR sensor
I. INTRODUCTION
In recent years, numerous research around the world has highlighted the promising applications of photonic quasi-crystalline fibers (PQCF). These fibers, structurally similar to photonic crystal fibers (PCF), are formed from the organization of air holes in a dielectric substrate, usually made of pure silica [1], [2]. PQCFs are designed with an arrangement of air holes that follows a quasi-periodic sequence or with the periodic repetition of a quasi-periodic unit cell [3].
The PQCF under study is distinguished by an arrangement of air holes, distributed in a quasi-periodic manner in the cross-section of the structure, forming an ordered but non-periodic structure. Within this structural configuration, at least two distinct symmetrical patterns can emerge, resulting in the formation of photonic bandgaps (PBG), without regular repetitions. Geometrical restrictions limit the possible symmetries, allowing only those with 6, 8, 12 and 24 repetitions [4]. In the model under analysis, the structure is repeated six times, with defects introduced by the removal of certain air holes, forcing the confinement of light in these regions.
At the same time, the use of photonic devices with optical fibers has grown in the development of new technologies. Plasmonic sensors, in particular, have attracted interest due to the phenomenon of surface FEM (SPR). Sensors that exploit SPR are widely researched due to their simplicity of construction, high sensitivity compared to other technologies, real-time response and adaptability [5]. The SPR effect occurs when light interacts with an interface formed by a dielectric material and a conductor, generating dense electron waves, known as plasmons. When this energy accumulated in the metallic interface interacts with a dielectric material, it forms particles called polaritons, generating waves known as surface plasmon polaritons (SPP) at high temperatures [6], [7].
SPR sensors present variable performance depending on the architecture employed. Prismatic sensors, such as the Kretschmann type, for example, offer high sensitivity, on the order of 30,000 nm/RIU, but generally have a very narrow detection range [8]. LSPR-based sensors, which use nanoparticles, have limited surface detection compared to conventional SPR sensors, but present high linearity (~99.6%) and excellent reproducibility [9, 10]. Phase-sensitive sensors exhibit high wavelength sensitivity and allow the detection of small variations in refractive index, on the order of ~10-5 RIU, although with a narrow detection range [11, 12]. Nowadays, architecture based on two-dimensional materials, such as graphene, have been explored for sensor applications. SPR sensors using these materials can achieve average angular sensitivities of around 500°/RIU, as well as slightly wider detection ranges compared to other techniques [13]. The structure proposed in this work is based on an optical fiber sensor, which stands out for its portability and accuracy. The introduction of the PQCF-based model with extended cores filled with liquid crystals can expand the detection range, ensuring high spectral sensitivity, low confinement losses, and robust performance even under temperature variations.
As previously mentioned, different sensor models have been employed for refractive index detection to develop multifunctional devices, including liquid crystal (LC) models, which enable the tuning of critical parameters and broaden the potential applications of these structures [14].
Consequently, PQCF with air holes filled with LC can be applied in the development of several optical devices, such as polarizers, modulators, optical switches, interferometers and sensors [15]. Therefore, this study aims to explore the structural properties of a PQCF with a unit cell repeated six times and some air holes strategically filled with LC, to analyze its behavior at different temperatures. In addition, the model proposed in this work can be used in the development of plasmonic sensors, incorporating the temperature sensitivity of LC into the device, enabling better detection adjustment.
II. PQCF PLASMONIC SENSOR DESIGN AND SIMULATION
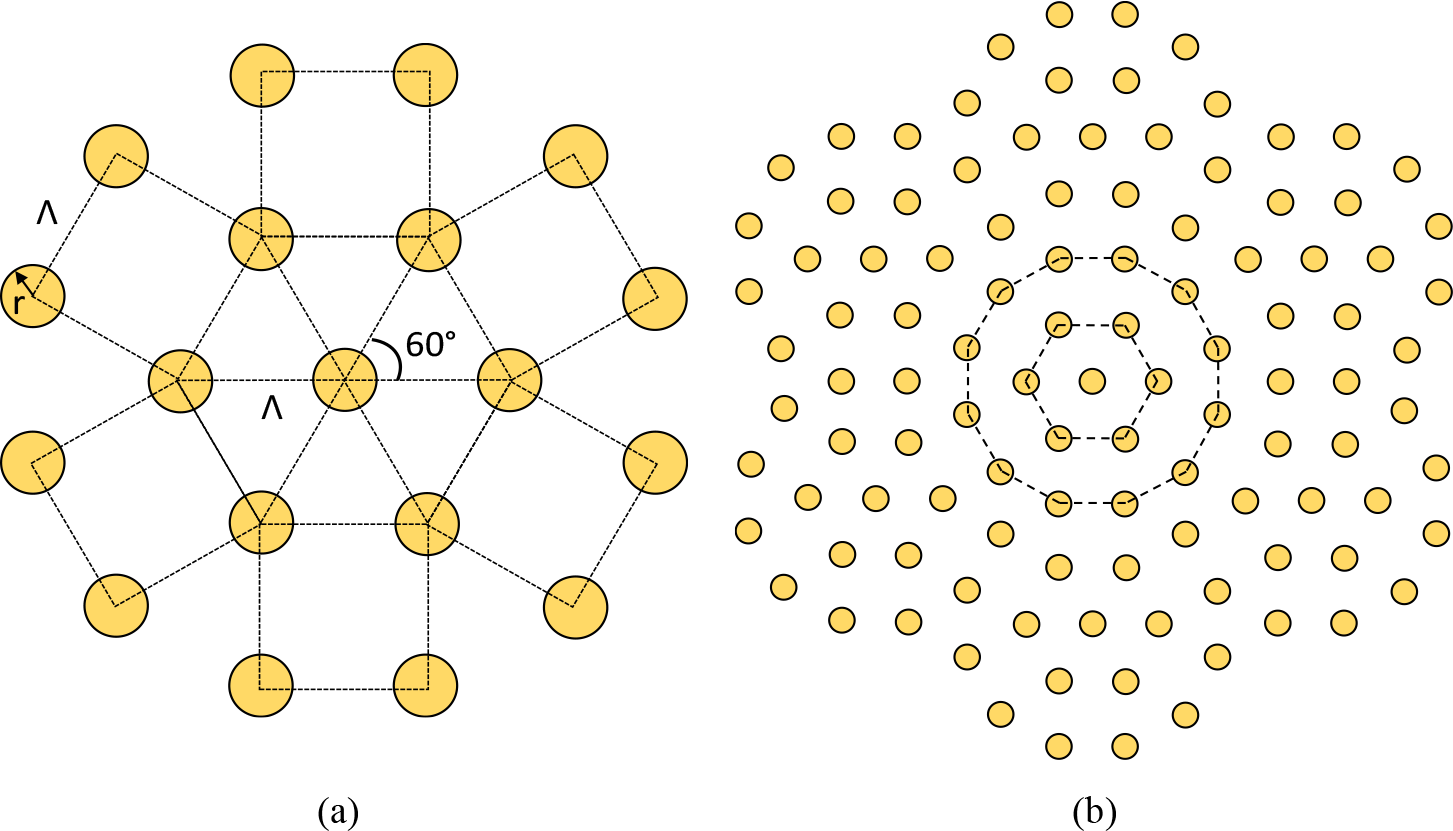
A quasi-periodic distribution is generally considered to be one that can be essentially defined as a combination of two or more periodic sequences [16, 17]. In this context, the sensor design presented here used as the basic unit cell a quasi-periodic structure composed of a hexagonal (or triangular) sequence combined with a quadratic sequence, as shown in Fig. 1(a). To build the complete structure, this unit cell was replicated six times around the central unit, as illustrated in Fig. 1(b). The resulting distribution of holes formed by this assembly was then immersed in a silica substrate to form the cross section of the PQCF, which constitutes the proposed plasmonic sensor.

In Fig. 1(a), A = 2.8 μm represents the distance between the centers of adjacent air holes, called pitch, while r = 0.35 μm shows the radius of the air hole. Fig. 2 illustrates the device proposed in this paper, showing the defects caused and the materials used.

To provide signal confinement, a defect was introduced in the center of the structure, forming the PQCF core. In addition, defects were created in regions above and below this core, resulting in extended cores with mirror symmetry. In these regions, elliptical microchannels with a smaller radius of 1.0 μm and a larger radius of 2.0 μm were incorporated, intended for the deposition of the analysis material.
To limit the computational domain and reduce the effects of the structure boundaries, circular perfectly matched absorption layers (PML) were introduced to simulate free space and absorb the incident waves in this region. The thickness of the PML used is tPML = 1.62 μm. In the gold layer, used to generate the surface plasmons, the thickness of the laminate considered is tAu = 35 nm.
Numerical analyses were conducted using a mathematical formulation [18] based on the finite element method (FEM), in which the equations for the implementation of circular PMLs were directly applied. To obtain the general formulation, Maxwell's equations were combined with relevant vector identities. After applying a non-paraxial approximation, the global matrix equation was derived, as shown in Equation (1).
Where [A] (the robustness matrix) and [B] (the coupling matrix) are sparse and complex-valued matrices, neff represents the effective refractive index, and Φ denotes the vector of modal solution coefficients corresponding to the H-field. Equation (1) is solved using an iterative subspace method, which allows for efficient computation of the modal solutions in large-scale systems. In this approach, the dielectric properties of the constituent materials are directly incorporated into the calculations, ensuring that the resulting modal fields accurately reflect the material dispersion and anisotropy. As a result, the effective refractive index, neff, is obtained self-consistently, providing a precise description of light propagation within the waveguide structure.
Using the Finite Element Method with the Garlekin Method, the structure was discretized with 31.000 triangular linear elements, whose sizes were adapted in relation to the discretization regions. For this purpose, the homogeneous wave equation, derived from Maxwell's Equations, is used, which allows materials with transverse anisotropy to be introduced. To reduce the computational work, the size of the elements was previously defined, so that the elements with the smallest edge were approximately 0.0715 μm, while the largest elements were approximately 3.57 μm in size.
Regarding the materials used, the signal guidance region is composed of silica (SiO2), whose refractive index, n, can be determined by the Sellmeier dispersion equation [19], as shown in Equation (2), where θ represents the wavelength in μm.
Due to the approach adopted in this study, it is essential to know the dielectric properties of all materials involved. To characterize gold, which plays a key role in the Surface Plasmon Resonance (SPR) effect, the Drude-Lorentz mathematical model [20] was applied, with the obtained parameters [21]. This process requires detailed knowledge of the complex permittivity values of gold over a wide range of wavelengths.
One way to enhance the SPR effect is to concentrate the confined energy in the guiding region close to the plasmonic element. This can be done physically or through doping, increasing the refractive index of the materials surrounding the plasmonic element [5, 6]. In this context, this paper proposes the use of a type of LC as a dopant to improve the coupling between the fundamental mode and the plasmonic mode. In addition, different temperature levels were applied to evaluate the impact of thermal variations on the device. As expected, the refractive index of silica was stable at the temperatures used, while the liquid crystal showed a strong dependence on these thermal variations.
This influence is related to the thermo-optic effect in the metallic layer, fiber core and detection layer, which improves the performance of the SPR sensor [7]. Thus, the final sensor structure can be used at different temperature levels. To determine the dielectric characteristics of the liquid crystal, the dispersion equation specific to this material [15] was applied at different temperatures, as shown in (3), (4) and (5).
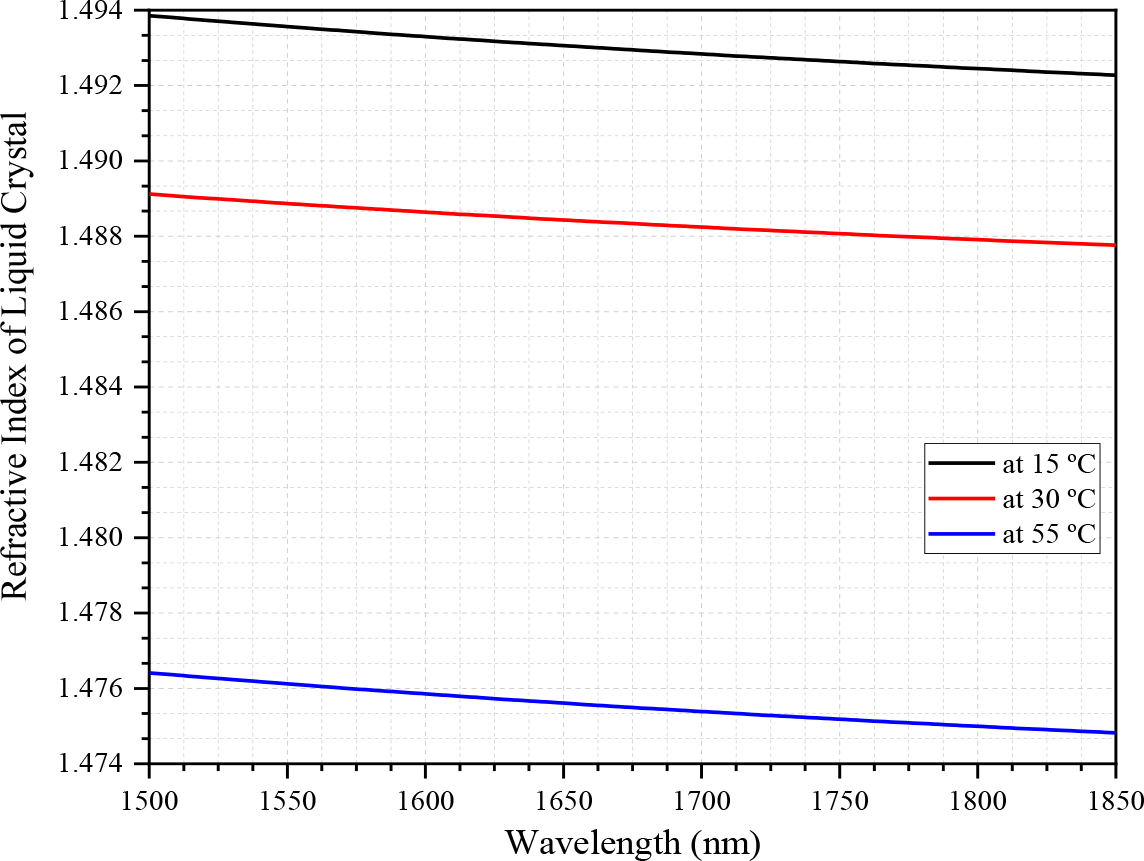
Where ⟨n⟩ is the average refractive index, dependent on the extraordinary refractive index ne and on the ordinary refractive index ni. The coefficients Ae, Be, Ce, Ai, Bi and Ci are the LC coefficients. To estimate the refractive index coefficients of the liquid crystal as a function of temperature, experiments were performed considering different temperature values. From these results, linear regressions were used to determine the Cauchy coefficients, presented in Table I [22].
Based on these data, Fig. 3 presents the effective refractive index curves for the liquid crystal at these three temperatures.

The analyte refractive index, na, is determined as a function of all materials used in the device, as well as the excitation wavelength and the distribution of air holes. Therefore, to determine the operating range of the sensor, i.e., the allowed values of na that can be detected, parametric analyses were performed, through the evaluation of the confinement loss curves that were obtained via modal analysis [5].
To estimate the operating range of the sensor, a broader refractive index range for the analyte was initially considered. Based on the results obtained from the modal analysis, considering the operating wavelength, the detection range of the sensor was determined from the surface plasmon responses. It was observed that, for low values of na, the sensor response to surface plasmons was null, while for high values of na, the modal analysis indicated that the fundamental mode was no longer confined to the guiding region of the structure. Therefore, the estimated analyte’s refractive index, na, was performed between 1.41 and 1.49. For the structure without liquid crystal, the range of values obtained was 1.41 to 1.48, and for the structure with liquid crystal, the range found was 1.41 to 1.49. In this context, an increase in confinement losses was expected, through an increase in na [5].
To verify the detection capability of the sensor, a complete modal analysis will be performed on the structure, in which the electric field curves (E-Field), confinement losses (CL), effective refractive index and spectral sensitivity will be verified, for cases where liquid crystal is not applied and for application of liquid crystal at temperatures of 15 ℃, 30 ℃ and 55 ℃.
The electric field in PQCF has a crucial role in controlling the propagation of the light signal. Its precise control allows the manipulation of light at nanometric scales, which enables the development of highly sensitive devices such as SPR-based sensors. Therefore, it is of great importance to verify the behavior of the fields within the proposed structure.
Confinement losses, in turn, are a type of losses that are related to the PQCF microstructures, therefore, they depend on the materials, position and size of the air holes. These losses arise when part of the optical energy is scattered or absorbed by the materials adjacent to the fiber microstructure [23]. It is generally desired that the losses in a device be as low as possible, however, variations in losses can be a way of determining the analyte, since confinement losses are also sensitive to the wavelength and the effective refractive index of the structure, as shown in Equation (6).
The effective refractive index is a parameter that describes the efficiency with which an optical fiber guides light, representing a combination of the refractive indices of the materials that make up the fiber, considering their quantities and distribution in the structure. Its analysis is fundamental, as it reflects the general behavior of the structure and is applied in most equations. In this work, this parameter was obtained as indicated in (1).
Furthermore, spectral sensitivity [24], or wavelength sensitivity, describes the device’s ability to detect variations in the wavelength of incident light. In sensors, this characteristic is crucial to provide accurate and reliable measurements of physical parameters, such as temperature, pressure, and concentration of chemical substances, via variation in the refractive index, which is the parameter addressed in this article. High sensitivities are often desirable, as they allow the detection of small changes in the light spectrum, enabling a detailed analysis of variations in the optical signal. This capability is essential for several applications, such as industrial control and medical diagnostics. SPR sensors are known for their high spectral sensitivity, making it essential to verify this parameter, which was obtained in this study using Equation (7).
III. RESULTS AND DISCUSSIONS
For the simulations, as mentioned in Section II, a formulation [18] was adopted, that allows obtaining eigenvalues representing the effective modal indices. In this approach, the mesh discretization data and the properties of the materials involved are provided as input to a computational code, which generates this information. The code is implemented in FORTRAN language, and the results are exported to a computational platform for generating graphs.
According to the quasi-periodic distribution of the air holes in the silica substrate, the liquid crystal region was obtained by introducing a structural defect, produced by the removal of two adjacent air holes. These holes were replaced by an extended elliptical core filled with liquid crystal. It is important to emphasize that this configuration does not introduce degenerate modes into the structure, since it represents only a geometric modification.
Thus, the first study performed is the modal analysis, an essential step to identify the fundamental mode of fiber propagation and the plasmonic modes resulting from the SPR effect. Fig. 4 illustrates the fundamental mode in the proposed device and the occurrence of SPR through the two-dimensional electric field.

Fig. 4(a) shows the distribution of the electric field in the structure in the absence of liquid crystal, with excitation wavelength o θ = 1.55 μm and analyte refractive index fixed at na = 1.46. In this condition, it is observed that the energy is concentrated with greater intensity in the center of the structure, forming a hexagonal core due to the quasi-periodic distribution applied. It is also noted that the electric field inside the analyte presents high intensity, indicating that, without the use of liquid crystal, the detection limit of na is close to its upper value.
In Fig. 4(b), the simulation conditions are the same as in Fig. 4(a), but the liquid crystal was exposed to a temperature of 30 ℃. The result shows that the introduction of the liquid crystal into the predetermined holes changed the electric field distribution, shaping the central core into a rectangular shape. Since the refractive index of the liquid crystal at this temperature is higher than that of silica, part of the signal was attracted to this region, reducing the intensity of the plasmonic mode within the analyte. As a consequence, the detection range of the SPR-based sensor increased from 0.7 RIU to 0.8 RIU. Although this increase seems small, it represents a significant gain for SPR sensors, which are known for their high selectivity and extremely accurate detection ranges [4].
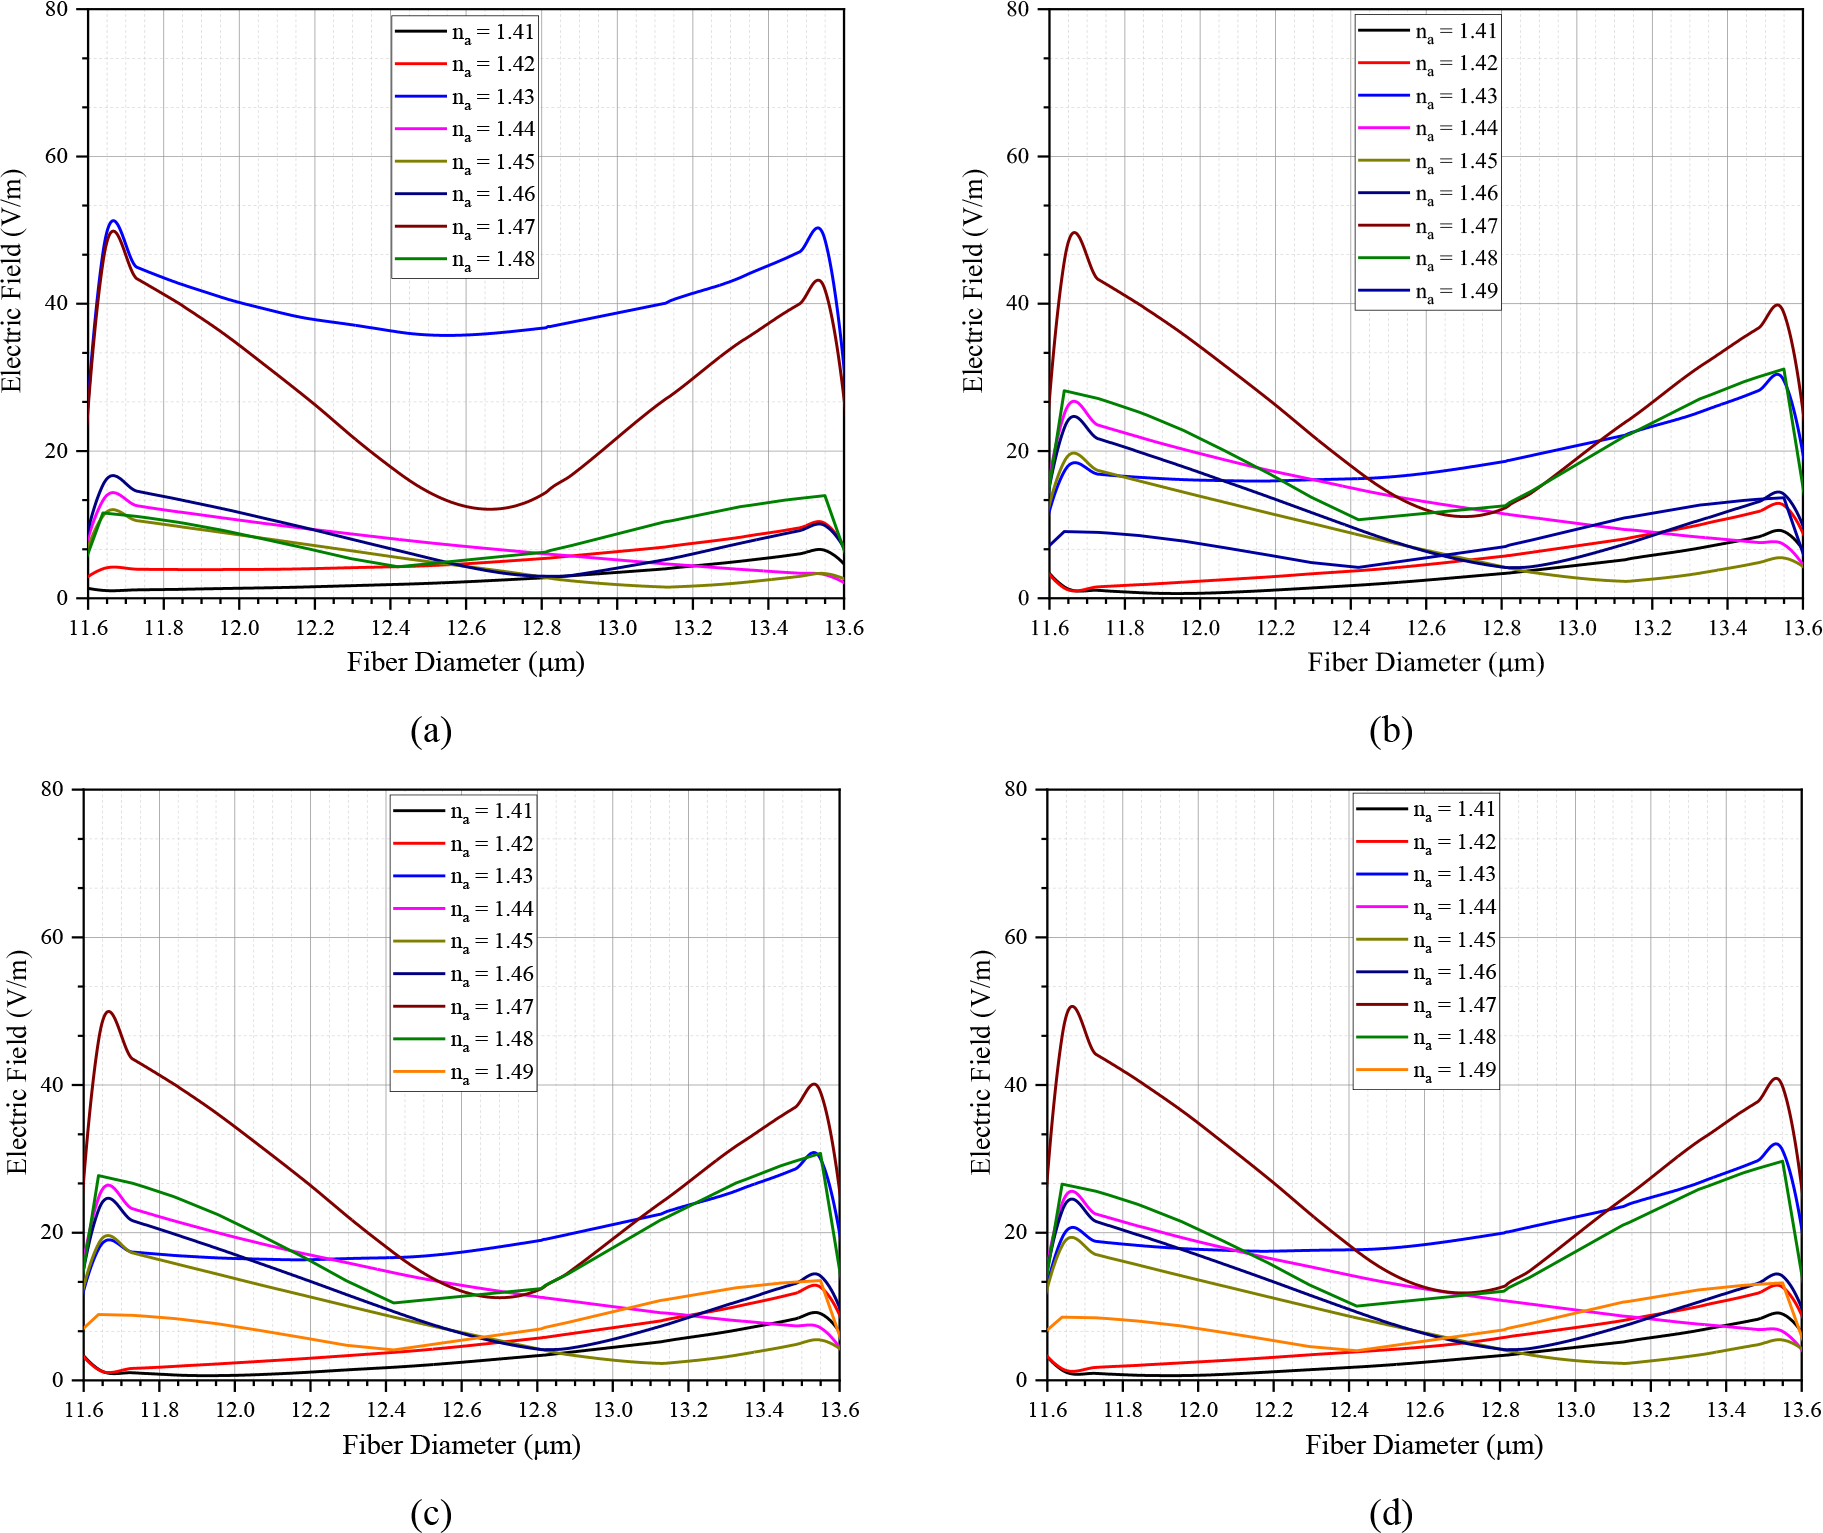
Fig. 4 is effective in illustrating the behavior and interaction between the fundamental mode and the plasmonic mode. However, one-dimensional curves are more suitable for analysis and interpretation of the obtained data. Thus, Fig. 5 presents the one-dimensional curves of the electric field as a function of the PQCF diameter.
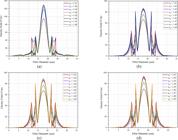
Eletric field distribution (1D) along fiber diameter. (a) Without LC. (b) With LC at 15 ℃. (c) With LC at 30 ℃. (d) With LC at 55 ℃.
Fig. 5(a) shows the electric field curves for the structure without the application of liquid crystal. When comparing Fig. 5(a) with the others, it is observed that the introduction of the liquid crystal in the sensor causes a considerable increase in the electric field concentrated at the interface between the gold and the silica. This implies a higher peak of the plasmonic mode in these structures, although it also increases the losses due to the greater contact of the electric field with the gold. In all cases, it is noted that the decrease in the fundamental mode (central lobe) results in an increase in the plasmonic mode, which is expected, since an energy transfer occurs to these regions. Fig. 5(b), (c) and (d) present the one-dimensional curves of the electric field for the structure with liquid crystal at temperatures of 15 ℃, 30 ℃ and 55 ℃, respectively. It can be observed that the behavior pattern in these three cases is similar, varying only in the intensity of the fields, which increases from 87.38 V/m at 15 ℃ to 93.80 V/m at 55 ℃.
For more accurate visualization of the plasmonic effect, Fig. 6 shows the variations in the plasmonic field as a function of temperature for the structure with and without LC. Fig. 6(a) shows the plasmonic field of the structure without LC, while Fig. 6(b), (c) and (d) show the plasmonic field of the structure with LC at 15 ºC, 30 ºC and 55 ºC, respectively. This makes it possible to perform a more precise analysis of the interaction of the electric field with the analysis material.
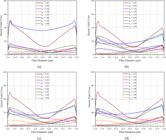
Plasmonic field. (a) Without LC. (b) With LC at 15 ℃. (c) With LC at 30 ℃. (d) With LC at 55 ℃.
In general, from the responses presented in Fig. 6, it is observed that the losses in the proposed structures are relatively small compared to SPR sensors already known in the literature. When analyzing the results, it is evident that the introduction of the LC causes confinement losses in the system, however, the sensor as a whole maintains a performance with low losses. While some SPR sensors can present losses of the order of 3000 dB/cm [24], the structures presented here show values in the range of 20 to 200 dB/cm.
When the sensor is used with a conventional excitation of θ = 1.55 μm, the confinement loss values, in dB/cm, are calculated and can be seen in Table II.
Based on the data in Table II, it is possible to plot confinement loss curves as a function of the analyte's refractive index, as shown in Fig. 7. In this way, it is possible to analyze in more detail the behavior of losses when the test material is inserted into the excited device with θ = 1.55 μm.
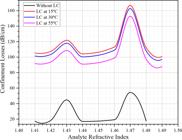
Fig. 7 illustrates that the lowest losses are observed in the device operating without the presence of liquid crystal (black curve), while the confinement losses of the devices with liquid crystal decrease as the temperature increases. Despite this reduction, the pattern of formation of the curves remains consistent in all cases, which indicates that the fundamental characteristics of the optical signal are being preserved, even with the variation in the intensity of the losses.
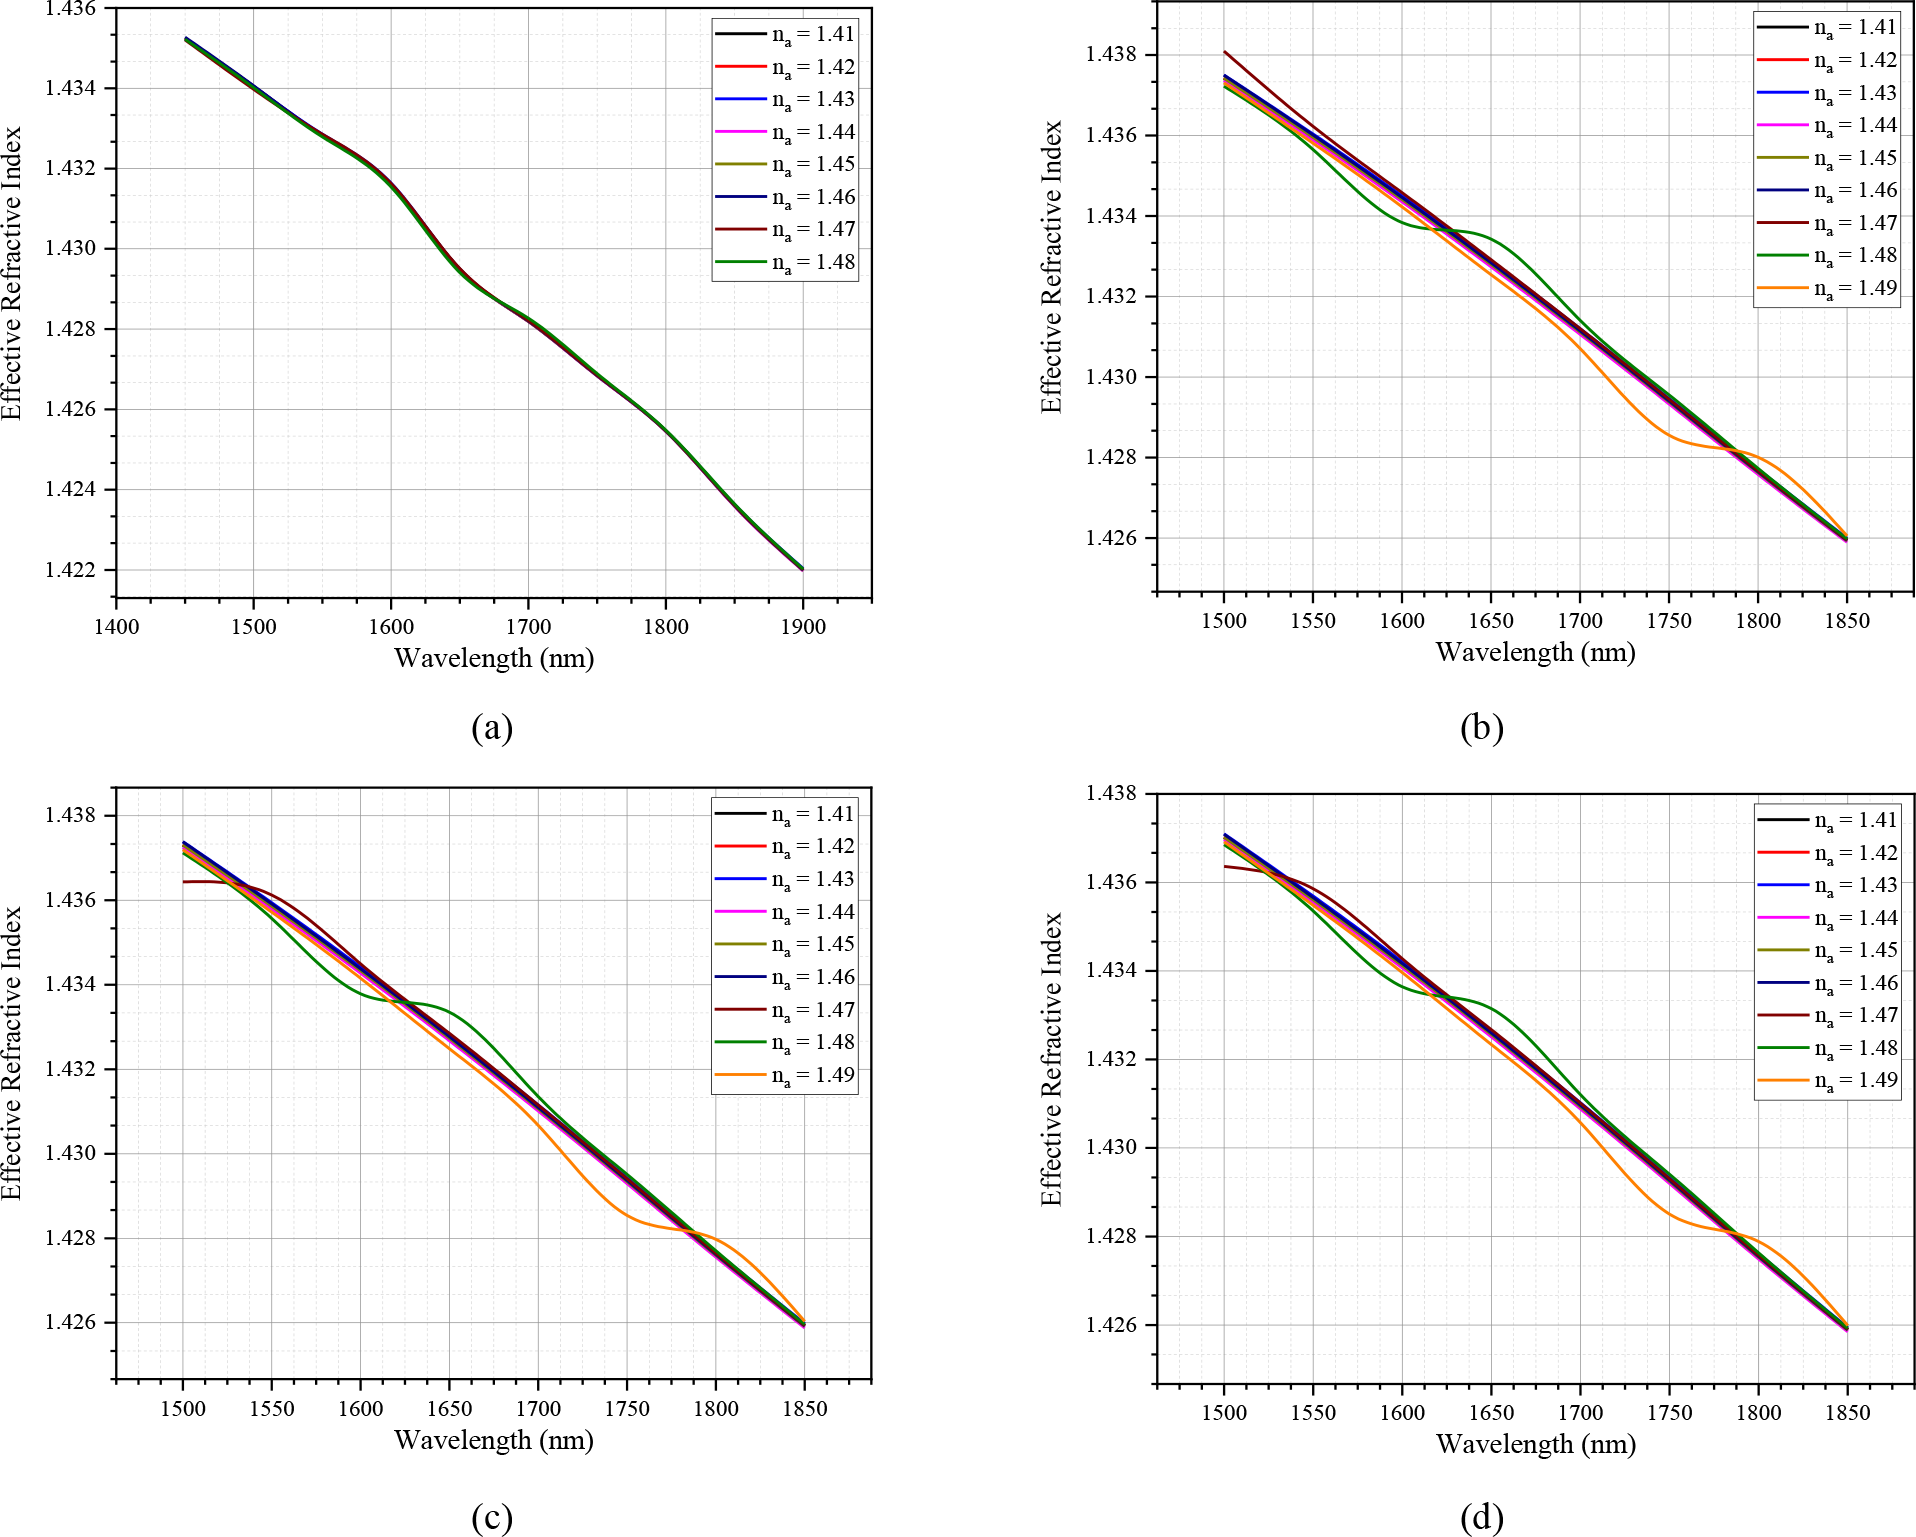
Next, the results related to the spectral sensitivity of the proposed sensor will be presented. However, before that, Fig. 8 presents the effective refractive index curves for the studied cases.

Sensor effective refractive index. (a) Without LC. (b) With LC at 15 ℃. (c) With LC at 30 ℃. (d) With LC at 55 ℃.
When analyzing Fig. 8(a), it is observed that the effective refractive index presents minimal variations as the analyte refractive index is changed. Furthermore, the variation of the refractive index throughout the wavelength range is negligible. These two factors suggest that the spectral sensitivity of the structure without liquid crystal should be superior to the spectral sensitivity of the structures with liquid crystal, as shown in Fig. 8(b), (c) and (d), according to the relation defined in (7). This is due to the fact that in the structures with liquid crystal, small variations in the values of neff are observed along the wavelength.
The spectral sensitivity of an optical sensor is a fundamental measurement that describes the device's ability to detect changes in the effective refractive index of the structure in response to incident electromagnetic radiation. This sensitivity is often expressed as the ratio of the derivatives of the wavelength to the effective refractive index, reflecting the point sensitivity of the sensor at a specific wavelength. Total spectral sensitivity refers to the overall ability of the sensor to capture radiation across the entire electromagnetic spectrum of interest by integrating its sensitivity characteristics across all relevant spectral bands. On the other hand, average spectral sensitivity is calculated as a weighted average of the spectral sensitivities across multiple wavelength bands. These measurements are essential for characterizing and optimizing the performance of optical sensors across a wide range of applications.
Table III presents the values of total and average spectral sensitivity for each structure configuration used, with their respective detection ranges, considering the wavelength θ = 1.55 μm.
To generate a curve from discrete points, it is essential to apply a polynomial interpolation method. For this purpose, Newton's [25] and Lagrange's [26] interpolation methods have been implemented on the data. However, both resulted in significant ripples in the interpolated data. These ripples may arise due to the nature of the interpolating polynomials, especially in regions where the original data presents high variance or when there is a limited number of points.
To overcome this problem, a computational code was developed that uses the cubic spline method, which has proven effective in reducing ripples and generating smoother curves. A cubic spline is a piecewise function composed of cubic polynomials in adjacent intervals [27]. In other words, between each pair of consecutive data points, a cubic polynomial is obtained to define the curve. For interpolation to occur between the points (xi, yi), where i = 0,1, … , n, three conditions must be met:
-
1. Interpolation Condition: For all i, the curve must pass exactly through the point, that is, S(xi) = yi;
-
2. Continuity Condition: The curve must be continuous up to the second derivative at all interpolation points;
-
3. Smoothness Condition: The second derivative must be continuous throughout the curve.
Because this method divides the domain into adjacent points, there is no rule that presents a resulting polynomial for the complete curve, however, each segment between the points (ii, yi) and (ii+1, yi+1) is expressed according to Equation 8.
where ai is the coefficient responsible for making the curve pass exactly through the points (ii, yi), bi determines the slope of the curve at point ii, di is responsible for controlling the curvature of the curve in the vicinity of point ii and di enables an additional curvature that has the function of allowing a smooth adjustment between points ii and ii+1.
In this context, Fig. 9 presents the spectral sensitivity points as a function of θ, together with the curve adjustment performed. In this way, it is possible to obtain a visual, fast and reliable response on the behavior of the proposed sensor for any value of θ.

Total spectral sensitivity. (a) Without LC. (b) With LC at 15 ℃. (c) With LC at 30 ℃. (d) With LC at 55 ℃.
Based on the data obtained, it is observed that the structure that presents the highest spectral sensitivity is the device without liquid crystal, Fig. 9(a), which was expected due to the behavior of the effective refractive index of this model, discussed previously. The maximum total sensitivity recorded for the sensor without liquid crystal was WStit = 34,120.81 nm/RIU for an analyte with na = 1.4741. However, it is important to emphasize that the sensitivities obtained in the configurations in which the liquid crystal is applied continue to be relatively high compared to other sensors of the same technology described in the literature. Furthermore, in Fig. 9(b), it is highlighted that the analyte with value na = 1.47 at the temperature of 15 ℃ presents a lower sensitivity, of WStital = 28,827.10 nm/RIU, compared to the values obtained at the temperatures of 30 ℃, Fig. 9(c), and 55 ℃, Fig. 9(d), which are WStotal = 33,342.53 nm/RIU and WStot = 33,466.06 nm/RIU, respectively.
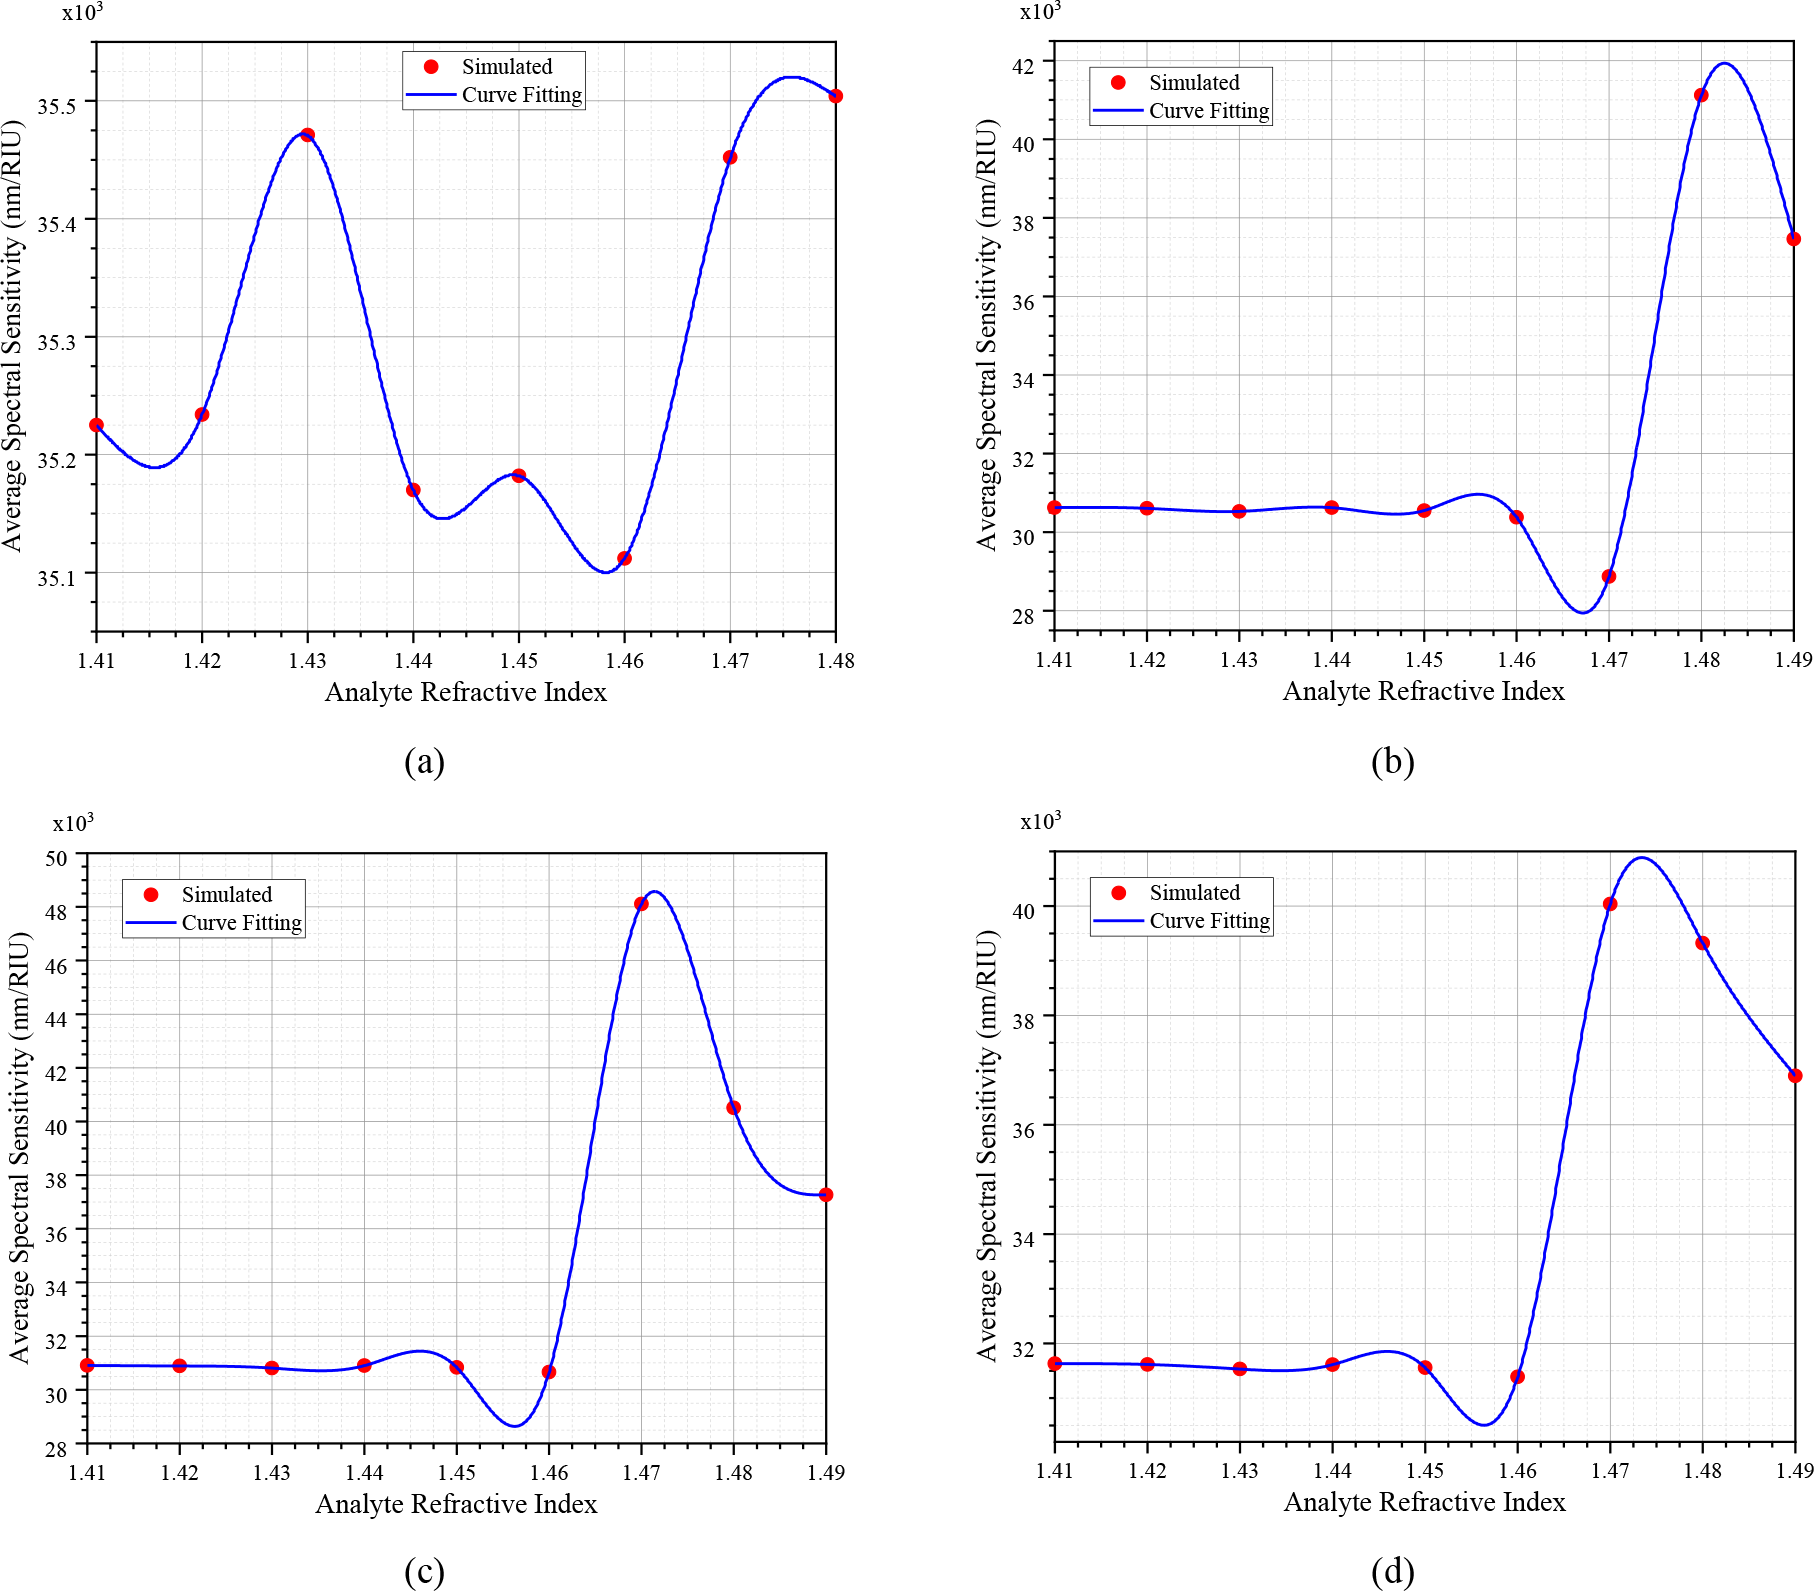
Finally, Fig. 10 presents the points relating to the average spectral sensitivity, as well as the curve adjustment performed. According to Fig. 10, it can be seen that the highest average spectral sensitivity values were obtained in the sensors that use liquid crystal, although the total sensitivity is higher in the sensor without this material.

Average spectral sensitivity. (a) Without LC. (b) With LC at 15 ℃. (c) With LC at 30 ℃. (d) With LC at 55 ℃.
This phenomenon is perfectly normal and occurs because the structure with liquid crystal presents greater variation of values while the sensor without liquid crystal is more stable. The maximum average sensitivity was obtained in the structure with liquid crystal at a temperature of 30 ℃, Fig. 10(c), with a value of WSavg = 48,661.19 nm/RIU at na = 1.4714, on the other hand, the lowest average spectral sensitivity obtained was WSavg = 27,890.06 nm/RIU for na = 1.4672, as present in Fig. 10(b).
IV. CONCLUSION
The quasi-periodic structure with six-times repetition contributed significantly to enhance the SPR effect, observed in the enlarged cores coated with a thin layer of gold. According to the results obtained, it was observed that the introduction of the liquid crystal in the sensor caused a considerable increase in the electric field, concentrated at the interface between the gold and the silica, causing an increase in the energy concentration of the plasmonic mode. It was also verified that variations in the temperature of the liquid crystal influenced the intensity of the fields, which increased from 87.38 V/m at 15 ℃ to 93.80 V/m at 55 ℃. The proposed SPR structure presents low losses, even considering the introduction of the liquid crystal that generates an increase in the confinement losses in the system. The overall losses in the proposed structure presented value in the range of 50 to 400 dB/dm. In addition, the sensor proposed in this work presented high values of spectral sensitivity, demonstrating its ability to differentiate small variations in the refractive indices of the analytes employed. According to the characteristics presented, the proposed sensor becomes a viable and simple alternative for applications in the analysis of chemical and biological materials.
ACKNOWLEDGMENT
The authors would like to thank PPGEEC/UFRN for support and encouragement in the production of this work. This article was financed in part by the Coordenação de Aperfeiçoamento de Pessoal de Nível Superior - Brasil (CAPES) - Código de Financiamento 001.
DATA AVAILABILITY STATEMENT
The authors would like to inform that the data that supports the findings of this study can be asked upon request.
REFERENCES
- [1] J. P. da Silva, D. S. Bezerra, V. F. Rodriguez-Esquerre, I. E. Fonseca, H. E. Hernández-Figueroa, “Ge-doped defect-core microstructured fiber design by genetic algorithm for residual dispersion compensation”, IEEE Photonics Technology Letters, vol. 22, pp. 1337-1339, 2010.
- [2] C. S. Jr. Arismar, “Recent progress and novel applications of photonic crystal fibers”, Report on Progress in Physics, vol. 73, pp. 1-21, 2010.
- [3] L. Jianjun, F. Zhigang, “Comparison of photonic bandgaps of two-dimensional periodic and quasi-periodic photonic crystals with different relative permittivity dielectric”, Optik, vol. 125, pp. 6566-6569, 2014.
- [4] M. Zoorob, M. Charlton, G. Parker, J. Baumberg, M. Netti, “Complete photonic bandgaps in 12-fold symmetric quasicrystals”, Nature, vol. 404, pp. 740-743, 2000.
- [5] N. H. O. Cunha, “Análise de biosensores ópticos baseados no efeito SPR utilizando novos modelos de dispositivos quase critalinos”, Ph.D. dissertation, Federal University of Rio Grande do Norte, Natal, Brazil, 2024.
- [6] N. H. O. Cunha, J. P. da Silva, “High sensitivity surface plasmon resonance sensor based on a Ge-doped defect and d-shaped microstructured optical fiber”, Sensors, vol. 22, pp. 3220-3236, 2022.
- [7] A. K. Sharma, R. Jha, B. D. Gupta, “Fiber-optic sensors based on surface plasmon resonance: a comprehensive review”, Sensors Journal, vol. 7, pp. 1118-1129, 2007.
- [8] T. Rutirawut et al., “Optical fiber-coupled Kretschmann SPR sensor with re-attachable gold nano-thin film sensing chip”, Optics Express, vol. 32, pp.39924-39937, 2024.
- [9] J. Feng et al., “LSPR optical fiber sensor based on 3D gold nanoparticles with monolayer graphene as a spacer”, Optics Express, vol. 30, pp. 10187-10198, 2022
- [10] D. M. Kim, J. S. Park, S. W. Jung, J. Y. and S. M. Yoo, “Biosensing Applications Using Nanostructure-Based Localized Surface Plasmon Resonance Sensors”, Sensors, vol.21, pp. 3191-3218, 2021.
- [11] S. Patskovsky, M. Meunier and A. V. Kabashin, “Phase-sensitive silicon-based total internal reflection sensor”, Optical Society of America, vol. 15, pp. 12523-12528, 2007.
- [12] S. G. Huang, K. P. Chen and S. C. Jeng, “Phase sensitive sensor on Tamm plasmon devices”, Optical Materials Express, vol. 7, pp. 1267-1273, 2017
- [13] M. Hu et al., “Sensitivity Enhancement of 2D Material-Based Surface Plasmon Resonance Sensor with an Al-Ni Bimetallic Structure”, Sensors, vol. 23, pp. 1714-1725, 2023.
- [14] L. Scolari, “Liquid crystals in photonic crystal fibers: fabrication, characterization and devices”, Ph.D. dissertation, Technical University of Denmark, Lyngby, Denmark, 2009.
- [15] R. Zhang et al., “Advanced liquid crystal-based switchable optical devices for light protection applications: principles and strategies”, Light: Science & Applications, vol. 12, pp. 1-30, 2023.
- [16] X. Chen et al., “Near-infrared long-range surface plasmon resonance in a d-shaped honeycomb microstructured optical fiber coated with Au film”, Optics Express, vol. 29, pp. 16455-16468, 2021.
- [17] N. J.Halas, D. Krökel, D. Grischkowsky, “Ultrafast light-controlled optical-fiber modulator”, Applied Physics Letters, vol. 50, pp. 886-888, 1987.
- [18] J. P. da Silva, “Simulação por elementos finitos de propagação de feixes ópticos em estruturas fotônicas”, Ph.D. dissertation, Campinas State University, Campinas, Brazil, 2013.
- [19] W. Sellmeier, “Zur erklärung der abnormen farbenfolge im spektrum einiger substanzen”, Annalen der Physik, vol. 143, pp. 272-282, 1871.
- [20] P. Drude, “Zur elektronentheorie der metalle”, Annalen der Physiks, vol. 306, pp. 566-613, 1900.
- [21] A. D. Rakić, A. B. Djurišić, J. M. Elazar, M. L. Majewski, “Optical proprieties of metallic films for vertical-cavity optoelectronic devices”, Applied Optics, vol. 37, pp. 5271-5283, 1998.
- [22] [22 REF NOVA] H. Liu et al, “Polarization-dependent transverse-stress sensing characters of the gold-coated and liquid crystal filled photonic crystal fiber based on Surface Plasmon Resonance”, Optical Fiber Technology, vol. 41, pp. 27-33, 2018.
- [23] B. Gauvreau, A. Hassani, M. F. Fehri, A. Kabashin, M. Skorobogatiy, “Photonic bandgap fiber-based surface plasmon resonance sensors”, Optics Express, vol. 15, pp. 11413-11426, 2007.
- [24] Y. E. Monfared, M. Hajati, C. Liang, M. Qasymeh, “Quasi-d-shaped fiber optic plasmonic biosensor for high-index analyte detection”, IEEE Sensors Journal, vol. 21, pp. 17-23, 2021.
- [25] F. Haslinger, “On Newton's interpolation polynomials”, Journal of Approximation Theory, vol. 22, pp. 352-355, 1978.
- [26] R. Al-Jarrah, “On the Lagrange interpolation polynomials of entire functions”, Journal of Approximation Theory, vol. 41, pp. 170-178, 1984.
- [27] M. Marsden, “Cubic spline interpolation of continuous functions”, Journal of Approximation Theory, vol. 10, pp. 103-111, 1974.
-
Editor:
Carlos E. Capovilla
-
Associate Editor:
Joao Weyl