Wavelength Modulation Spectroscopy to Measure Fruit Respiration in Real Time from CO2 Concentration
Abstract
Climacteric fruit respiration generates carbon dioxide (CO2), making its real-time monitoring crucial for optimizing storage and transport conditions, minimizing economic losses and waste. This work demonstrates the application of Wavelength Modulation Spectroscopy (WMS) for the development of a sensor capable of measuring CO2 concentration in real time with high precision and reproducibility. For the technique, a Distributed-Feedback diode laser was used, tuned to the 1572.3 nm CO2 absorption line. The temporal evolution of CO2 concentration released by tomato and banana at different ripening stages was measured. The sensor exhibited a detection limit for CO2 variations ranging from 122 to 488 parts per million (ppm). The results demonstrate the applicability of WMS for monitoring fruit respiration. The normalization technique second harmonic/first harmonic (2f/1f) proved essential for mitigating thermal effects, as the 1f signal corrects for laser power and non-absorption losses, thus enhancing data reliability. Analysis of CO2 evolution curves suggests the potential to study gas diffusion phenomena within fruits, evidenced by the sigmoidal profile. This sensor has potential for future applications in modified atmosphere packaging (MAP) and quality control.
Index Terms
Absorption Line; Carbon Dioxide; Fruit Respiration; Wavelength Modulation Spectroscopy.
I. INTRODUCTION
The consumption of fruits and vegetables is essential for a healthy diet, making them one of the most consumed food categories globally [1]-[3]. However, as they are highly perishable, they have a short shelf life, a factor directly linked to the respiration process [4]-[5] that continues after harvest. The CO2, a product of respiration [6], acts as an essential bio-indicator of post-harvest quality [2] and also as a ripening regulator [7]. Therefore, precise monitoring of CO2 concentration is crucial for optimizing storage, transport, and packaging conditions, thereby minimizing economic losses and waste.
Traditionally, fruit respiration has been evaluated by methods that, although effective, have significant limitations. Direct techniques, such as the use of closed chambers [8] or continuous flow systems [9], require bulky specific equipment for measuring CO2 or oxygen (O2). Indirect methods, which use mathematical modeling [10]-[11], imaging and machine learning [12], or volatile organic compound sensors [13], often require complex models or are less specific. Methods like gas chromatography (GC) and infrared gas analyzers (IRGA) offer high precision but tend to be expensive and have slower processing times [9]. There is therefore a need for a sensor that is simultaneously precise, fast, non-destructive, and economically viable for real-time respiration monitoring [12], [14].
In this context, Wavelength Modulation Spectroscopy (WMS), an advanced tunable diode laser absorption spectroscopy (TDLAS) technique, emerges as a promising alternative. WMS stands out for its high sensitivity and resolution, enabling real-time detection of gas concentrations [15]-[17]. Although it has been applied to study respiration in seeds [18]-[19], for CO2 detection in agricultural fields [20], and for monitoring in food transport environments [21], the application of WMS to measure the respiration of fruits like tomato and banana at different ripening stages using a DFB laser centered at 1572.3 nm is still an underexplored area.
In this work, we demonstrate the development of an instrumentation system based on the WMS technique for the real-time detection and monitoring of CO2 evolution resulting from the respiration of tomatoes and bananas. Our approach uses a Distributed-Feedback (DFB) diode laser centered at 1572.3 nm and a multi-pass spectral cell with an effective optical path of 78.1 cm for gas sample collection, differing from methods based on the direct interaction of the laser with the fruit [14]. Furthermore, normalizing the second harmonic (2f) by the first harmonic (1f) ensures high measurement precision and noise suppression [19]. The results obtained contribute to the advancement of respiration monitoring methods that can assist in studies of artificial ripening and quality control of fruits.
II. MATERIALS AND METHODS
A. Experimental Setup
The experimental setup, illustrated in Fig. 1, was designed to measure CO2 concentration using the WMS technique. The system is comprised of a DFB diode laser (QPHOTONICS, LLC) with a wavelength of 1571.94 nm and a power of 20 mW at 25 ºC. It operates with a linewidth smaller than 0.01 nm. The laser's temperature, maintained fixed by adjusting the thermistor to 7 kΩ, and its wavelength, tuned via injected current, are controlled by a laser driver (ITC 510, Thorlabs). Additionally, the wavelength was modulated by a sinusoidal signal with frequency ω, indicated as OSC in Fig. 1, generated by a dual-channel lock-in amplifier (model 7265, Ametek).

The laser beam was directed to a multi-pass spectral cell (model FCS - 80 - ¼ - FCAPC, Wavelength References) with a volume of 35 cm3 and an effective optical path of 78.1 cm. The transmitted signal was detected by an InGaAs photodetector, which responds in the spectral range of 900-1700 nm, and then sent to the lock-in amplifier. The amplifier, through phase and quadrature detection, collected the first and second harmonic signals, as well as the DC signal. Data control and acquisition were performed by a computer using software developed in LabView, which allowed for real-time graphical visualization of the measurements and communicated with the lock-in and the laser driver via USB/GPIB converters.
The spectral cell was connected by a flexible tube (83 cm long and 0.635 cm in diameter) to a 1700 cm3 glass chamber, where the fruit samples were placed. The chamber was also connected to a gas system that allowed for purging with nitrogen (N2) and filling with reference or ambient gases as needed. The optical system, illustrated in Fig. 1, consisted of a multiplexer and an optical isolator, implemented in the setup to prevent laser feedback effects.
B. Materials and Samples
Samples of tomato and banana at different ripening stages were used in the experiments. The physical data of the banana samples, including their initial mass and volume, are detailed in Table I. For the tomato samples, mass and volume parameters were not collected during this experimental round, as the primary focus was on validating the sensor’s capacity to monitor the temporal evolution and relative variations of CO2 concentration.
C. WMS Theoretical Foundations
In WMS, it is possible to perform sensitive CO2 measurements [22]-[23] with phase-sensitive detection using a lock-in amplifier, see Fig. 1. The laser current is modulated with a frequency ω, which results in a wavelength modulation given by [24]:
where and Δλ are, respectively, the DC and AC components of the wavelength. The laser intensity is a linear function of the current and is also modulated according to [24], given by:
where and Δs are, respectively, the DC and AC components of the intensity. Once the laser beam crosses a region with a concentration of ƞ molecules per volume with a maximum absorption line centered at wavelength λ0 with a half-width at half-maximum (HWHM) profile of Λ and a maximum absorption cross-section of σ0, we will have a transmitted intensity given by [17], [24]:
in which L represents the length of the laser's interaction with the gas sample.
Experimentally, the transmitted optical intensity s(t) described in (3) is captured by the InGaAs photodetector, which exhibits a specific responsivity R around the operating wavelength range (typically 0.95 A/W, with a minimum of 0.90 A/W at 1550 nm), converting the incident optical power into a photocurrent. This current is then transformed into an electrical voltage signal (in Volts) by the acquisition system. Because the detected voltage is directly proportional to the optical power reaching the sensor's active area, all subsequent harmonic experimental data and curves in this work are presented in terms of this voltage signal, thereby directly reflecting variations in transmitted intensity.
The laser beam that interacts with the gas sample has its wavelength adjusted through current control by the DC and AC operating components of the laser and its temperature [25]-[28]. By monitoring the laser's output power and taking a reference measurement, the concentration of the gaseous molecule in the sample can be determined using the Lambert-Beer Law [29]-[31], whose power can be written as:
where
where α(λ) is the attenuation constant or absorption rate function, which contains the concentration of target molecules, σ(λ) is the absorption cross-section of the molecule and N is the number of molecules per volume. This way, it is possible to determine the evolution of CO2 over time. Transmittance can also be found, which is given by:
in which s0 is the measured signal with the gas system (spectral cell, hoses, and chamber) filled with CO2 and si is the measurement with the system filled with N2.
D. Measurement Procedure
Tomato and banana samples at different ripening stages were used in the experiments. Before each measurement, the system with the samples was purged with N2 to remove CO2 and oxygen (O2) from its interior. However, the vacuum pump used did not remove 100% of the air, resulting in approximately 35% of the ambient gas (containing O2) remaining in the chamber. This allowed the fruits to still be in contact with O2 and respire. To mitigate laser power fluctuations at the output of the spectral cell, the room was kept at a stable 24°C for at least 8 hours before the measurements began. This constant refrigeration was maintained throughout the entire experiment to prevent variations in the laboratory's ambient temperature.
The CO2 concentration resulting from the fruits' respiration was monitored in real time with scans of the second harmonic intensity around the 1572.3 nm wavelength. Measurements were performed at 15-minute intervals, allowing observation of the temporal evolution of the CO2 concentration. Data from the first harmonic (1f) and second harmonic (2f), in addition to the DC signal, were stored for subsequent analysis.
E. Data Analysis
The evolution of CO2 concentration was determined from the ratio (2f/1f) [19]. This normalization technique is crucial because the signal (1f) is strongly correlated with the laser's power and non-absorption optical losses (such as fluctuations due to thermal effects, mirror misalignment, and laser intensity variations). Since the second harmonic signal is directly proportional to both the gas concentration and the laser power, taking the ratio (2f/1f) effectively cancels out the intensity dependence, thereby isolating the pure absorption signal. This method, suggested by [18] and [32], significantly improves the reproducibility and precision of the measurements [17]. Although the HITRAN database [33] presents other wavelength options with higher absorption for CO2, the 1572.3 nm line was selected for two main reasons: its distance from the absorption line of the water molecule and the commercial availability of more accessible lasers in this spectral range, due to their application in telecommunications. The HITRAN data for this absorption line, shown in Fig. 2, provides an absorption cross-section of 7.412×10⁻²³ cm2 and a line half-width of 0.02 nm at 1572.335 nm. In direct tests with CO2 using the aforementioned spectral cell, the system demonstrated an absorption of approximately 10%, confirming the sensor's functionality and precision.

F. Harmonic detection sensor, sensitivity, and detection limits for CO2
The sensor's performance characterization was conducted using known gas concentrations. The calibration curve, illustrated in Fig. 3, was established by applying successive dilutions of CO2 with N2, followed by the measurement of the respective second harmonic peaks. Following a linear fit to the initial five dilution points, the resulting equation enabled the estimation of the sensor's detection limit. In an analogous context, the methodology resembles that used in [17] for dissolved gas analysis, where a detection limit of 90 ppm was estimated for carbon monoxide (CO).

CO2 sensor calibration curve with linear fit using harmonic detection. Relationship between the CO2 concentration (ppm) and the second harmonic peak intensity (V). The trend line was plotted from a linear regression applied to the dilution data for the determination of the detection limit.
In the fruit experiments, the second harmonic signal proved clearly distinguishable and measurable, displaying well-defined peaks in the 10-4 V variation range. Specifically, the registered signals fluctuated between 1.3 × 10⁻⁴ V and 1.5 × 10⁻⁴V. Utilizing the established calibration curve, this voltage range could be directly associated with CO2 concentration variations in the range of approximately 122 to 488 ppm. Consequently, the sensor's primary objective: the precise monitoring of the evolution of CO2 concentration resulting from fruit respiration, is effectively fulfilled within this measurable range. Although the determination of the final absolute concentration within the chamber depends on factors such as fruit maturity level and temperature [4], gas tightness, and chamber volume, the sensor's capability to observe the evolution of CO2 concentration fully validates its main objective.
III. RESULTS AND DISCUSSION
A. Measurement System Validation
Validation experiments were conducted to demonstrate the system's sensitivity to the presence of CO2 and the effectiveness of the measurement technique. Fig. 4 shows the result of the laser wavelength scan without sinusoidal modulation. When the spectral cell was filled with N2, a gas inert to the CO2 absorption line at 1572.3 nm, the transmission of the laser beam remained constant. In contrast, the presence of CO2 in the cell caused a drop in intensity at the 1572.3 nm wavelength, evidencing the gas absorption and, consequently, the system’s specificity for CO2 detection, as shown in Fig. 4.

Optical absorption plot with N2 (black) and with CO2 (red). A dashed vertical line at λ0 = 1572.32 nm indicates the point of maximum optical absorption for CO2.
Fig. 5 presents the transmittance curve T(λ), obtained from the ratio of the direct absorption signals of CO2 and N2, and the 2f curve obtained from WMS. The direct absorption method, although capable of detecting high concentrations, proves insufficient for small concentrations of CO2. The WMS technique, however, by detecting the second harmonic signal, proved to be much more sensitive, making it a suitable tool for the precise monitoring of fruit respiration.

The CO2 transmittance curve is shown in blue (the ratio between measurements with CO2 and N2); the second harmonic magnitude in the CO2 absorption region is shown in gray.
To ensure that the measured CO2 originated exclusively from the samples, a counterproof experiment was performed, and the result is shown in Fig. 6. The counterproof curve, obtained with the system filled only with N2, showed a stable baseline, confirming the isolation of the experimental setup. The respiration curve for the tomato, in turn, showed a consistent increase in CO2 concentration over time, indicating that the system can measure fruit respiration without interference from the external environment.

The evolution of CO2 resulting from tomato respiration is shown in black. The measurement from the counterproof experiment is shown in red, confirming the samples' isolation from external CO2.
B. Result and Analysis of Banana Respiration
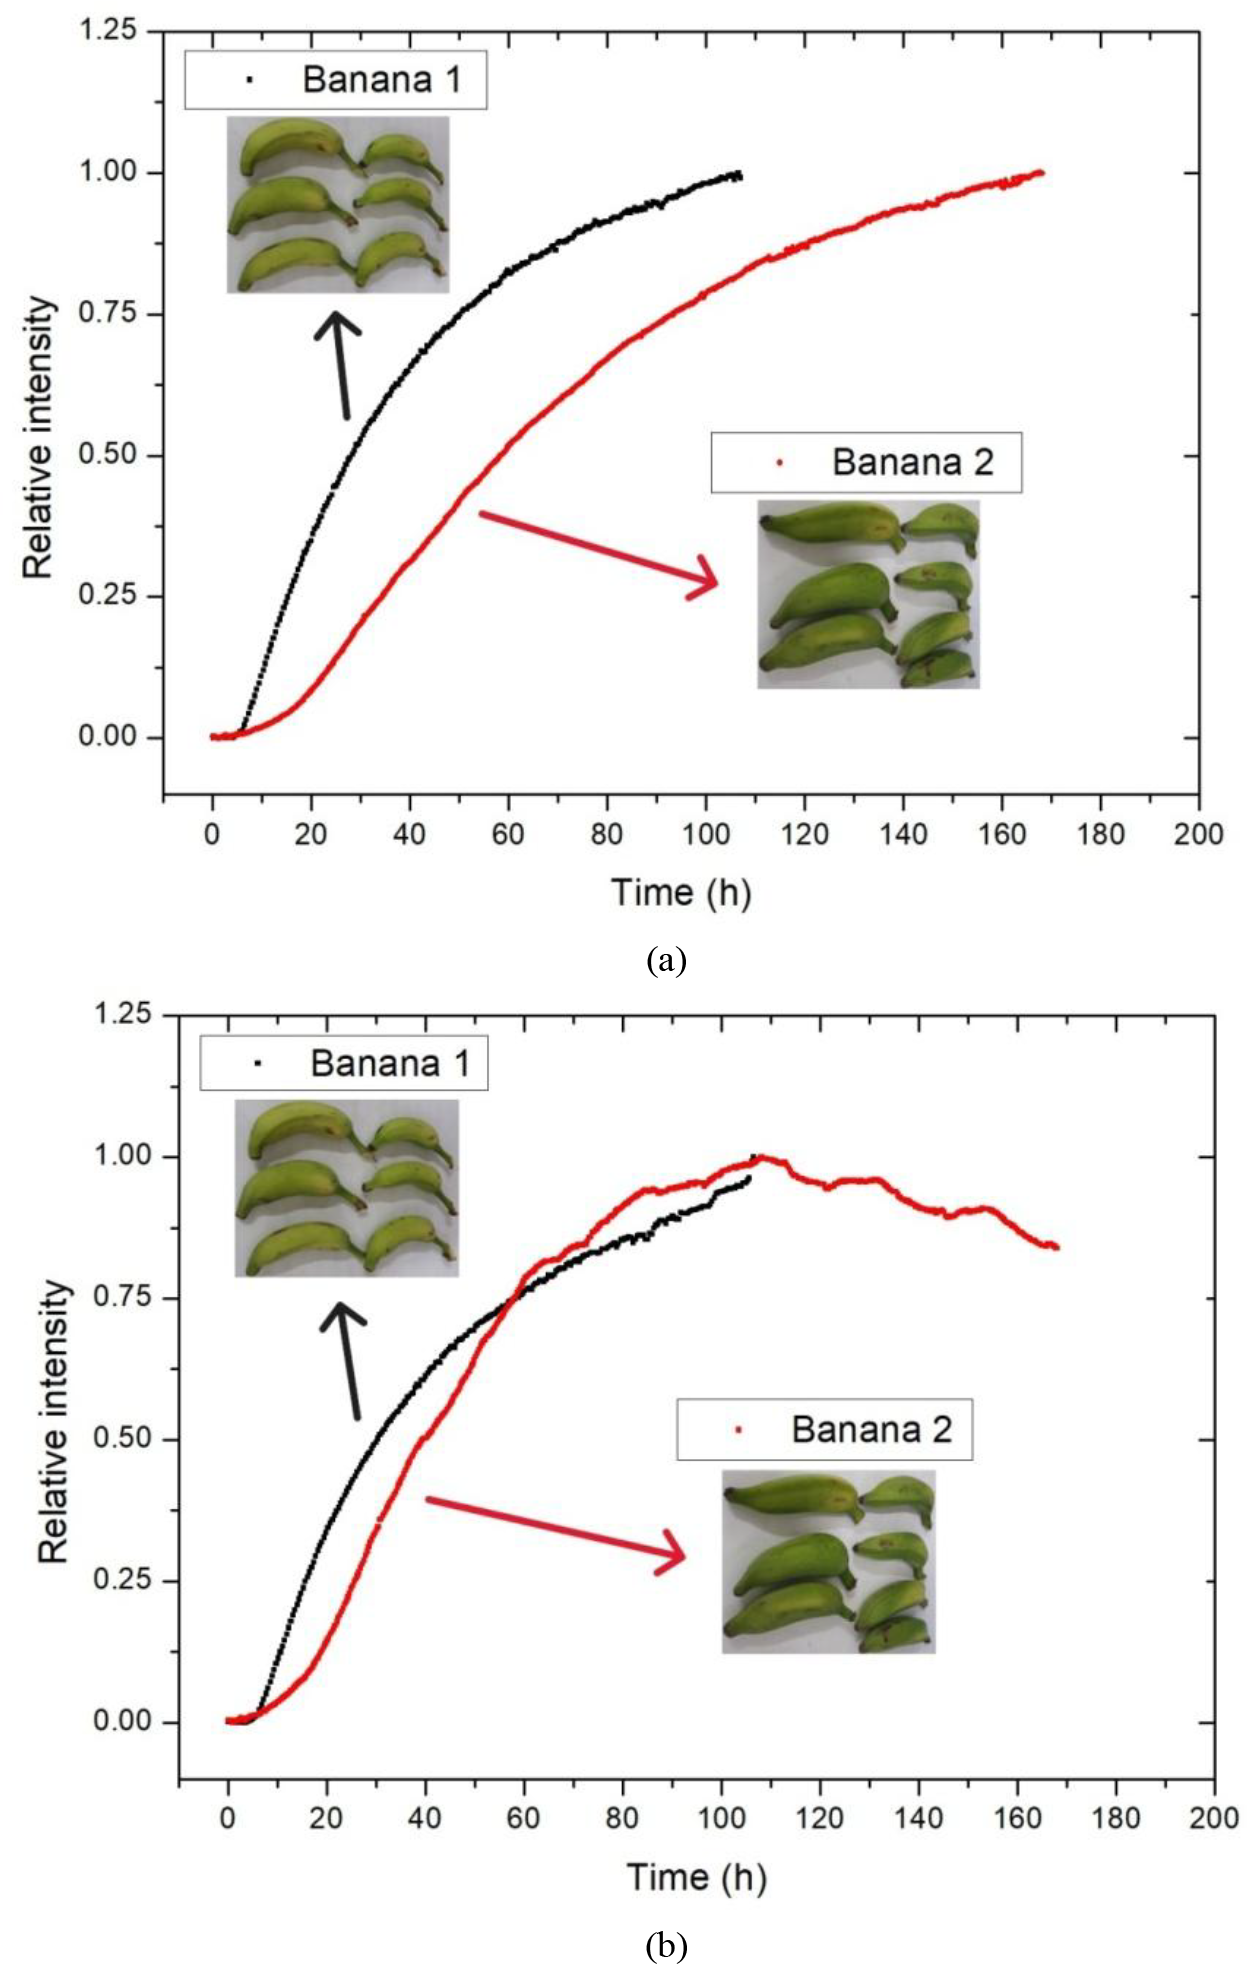
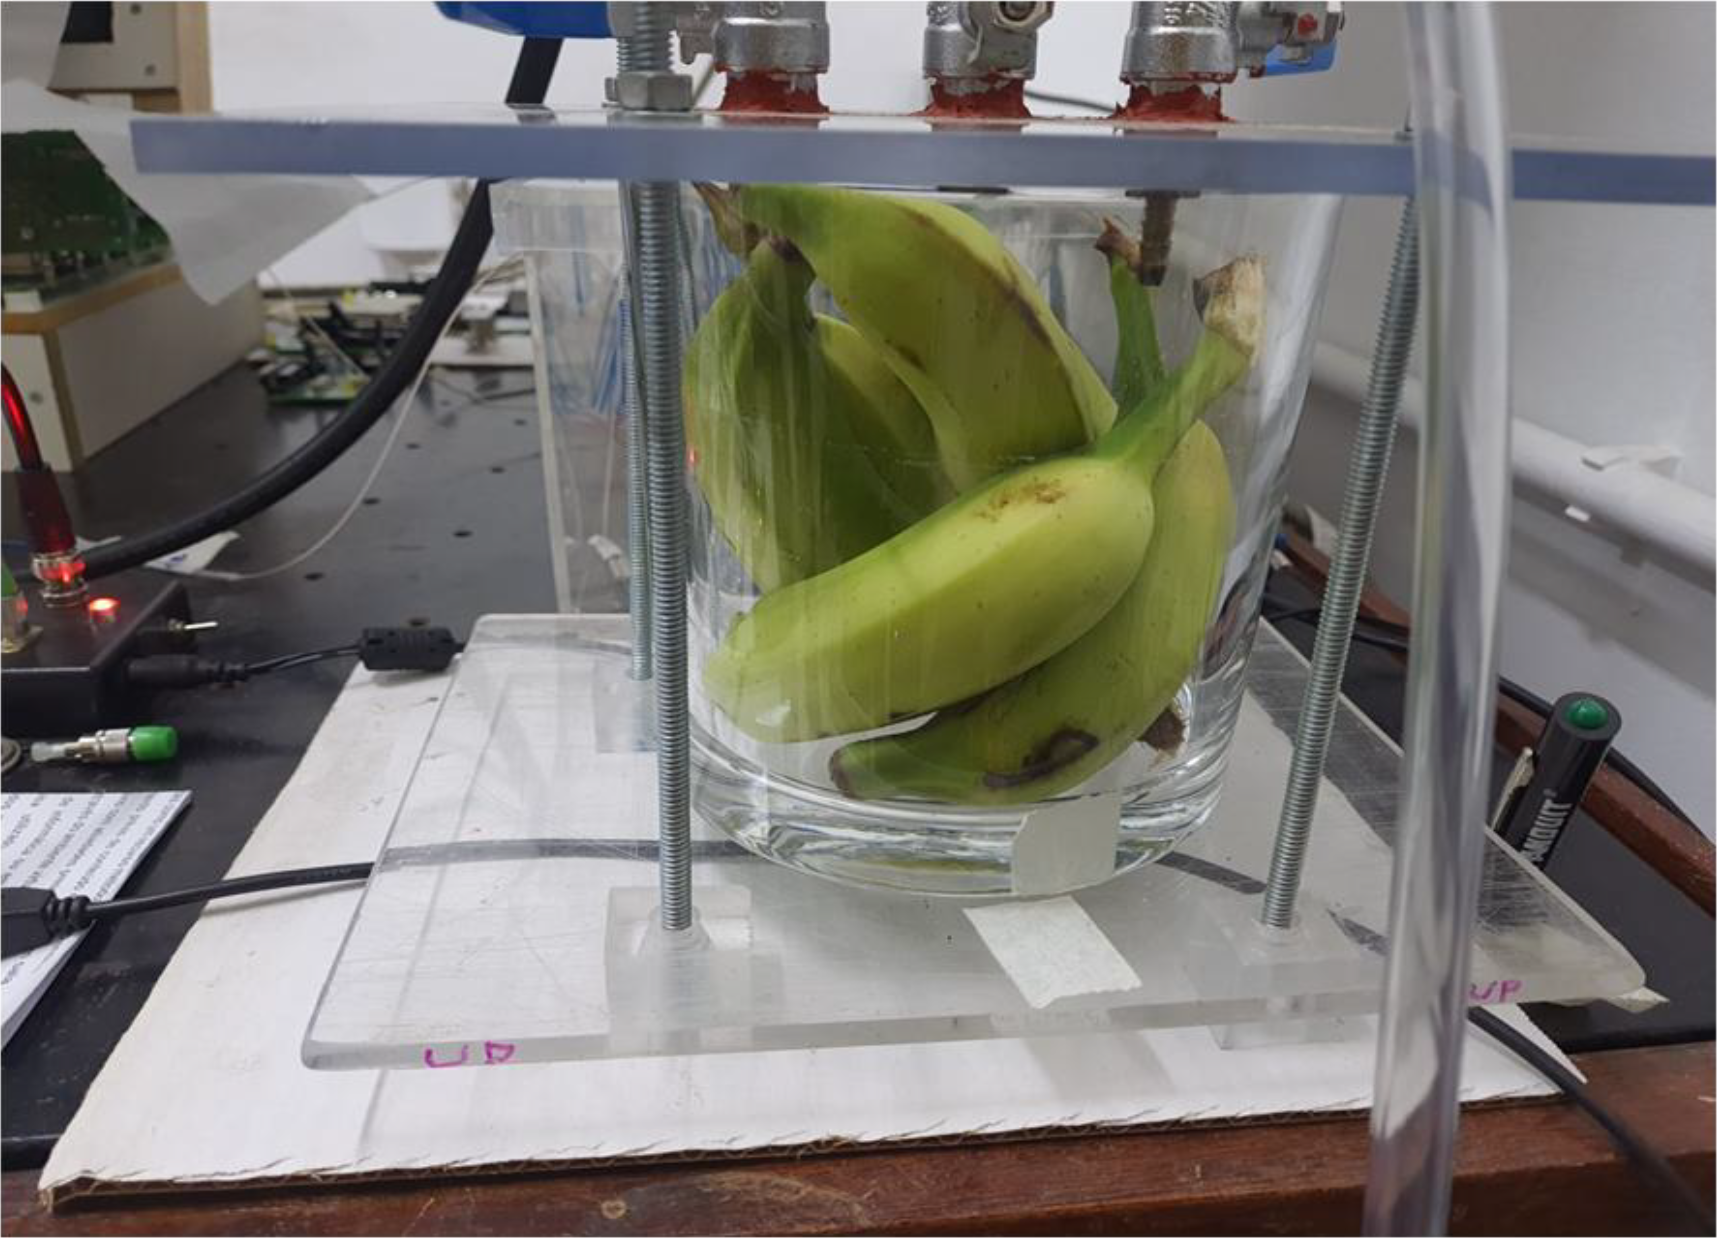
To confirm the efficacy of the CO2 sensor based on harmonic detection, the temporal evolution of CO2 concentration was measured as an indicator of the respiration process in banana samples at different ripening stages. Table I summarizes the data for samples banana 1 and banana 2. Fig. 7 presents photographs of the fruits at the start of the experiments, showing their visual characteristics, while the banana 1 samples inside the chamber on the first day of measurement are shown in Fig. 8. Although the banana 2 samples exhibited visual characteristics similar to those of banana 1 initially Fig. 7, the evolution of the CO2 concentration detected by the sensor clearly evidenced the difference in their ripening stages. It is important to note, however, that a lag time of approximately 3 to 5 hours occurred before the CO2 concentration reached the sensor's detection limit. This delay is expected and depends on both the fruit's initial ripening level and the initial N2 purge, which reduces the O2 concentration within the chamber. Furthermore, Fig. 7(a) highlights the complex interplay between CO2 generation from cellular respiration and its subsequent accumulation dynamics within the closed system [34]. This behavior exhibits a strong, clear tendency toward a sigmoidal profile in both banana experiments, which can be physically and physiologically contextualized into three distinct stages. Initially, the curves display a slow growth rate, characterized as a lag phase. This phase is governed by the transient accumulation of gas within the fruit’s internal porous tissues before a net gas transport balances out into the chamber. Subsequently, as the fruit enters its peak of climacteric ripening, a rapid, exponential-like acceleration phase takes place. This sharp increase reflects the intense metabolic activity and up-regulated respiration rate typical of banana samples when exposed to ripening stimuli. Finally, as the experiment progresses, the curve exhibits a visible inflection leading toward a stabilization plateau (saturation tendency). This deceleration in CO2 accumulation does not imply a cessation of respiration, but rather indicates that the system is approaching a dynamic equilibrium, where the gas concentration gradient between the fruit’s internal atmosphere and the sample chamber begins to level off, reducing the net gas exchange rate. As expected, this near-complete sigmoidal trend is remarkably more pronounced in the banana samples than in the tomatoes. Such a discrepancy directly stems from the faster ripening kinetics, higher enzymatic activity, and significantly higher baseline respiration rate of bananas, which rapidly drive the environmental gas concentrations upward, allowing the sensor to capture the full developmental profile of the respiration curve within the monitored timeframe.

(a) Experimental results from the banana 1 and banana 2 experiments showing the evolution of CO2 from fruit respiration at two ripening stages. The measurements here have been normalized by the first harmonic. (b) The same experimental measurements as in Fig. 7(a), but without the normalization treatment by the first harmonic.

Photograph of the bananas at the start of the experiment inside the respiration chamber, used in the banana 1 experiment.
Fig. 7(a) presents the evolution curves of the normalized CO2 concentration, demonstrating a difference in the respiration rate between the samples. The curve for the banana 1 experiment (black curve), which used visually more yellow bananas at a more advanced ripening stage, exhibited a significantly higher respiration rate compared to the curve for the banana 2 experiment (red curve), which used less ripe fruits. These results are consistent with the literature [9], [11], [35], which indicates that the respiration rate increases as climacteric fruits ripen.
Fig. 7(b) illustrates the effect of normalization, showing the raw data from both experiments. The presence of power fluctuations, associated with temperature variations in the laboratory environment, compromised the measurements, especially in the banana 2 experiment. The (2f/1f) normalization [19] proved effective in attenuating these fluctuations, correcting unwanted variations and allowing for the acquisition of reliable data [18], [32].
C. Result and analysis of Tomato Respiration
The measurement of tomato respiration was conducted in two distinct experiments to demonstrate both the importance of normalization and the sensor's ability to distinguish different maturation rates. The first experiment, using tomatoes at a more advanced ripening stage, generated a respiration curve with considerable noise incorporated into the measurements. This noise is shown in Fig. 9 with circles on the CO2 concentration evolution curve. The noise occurred due to technical issues in the 1f signal acquisition, which prevented normalization and, consequently, limited the analysis of the respiration rate.

Evolution of tomato respiration over approximately 160 hours. An inset photo of the fruits, taken on the first day of measurements, is also shown. The CO2 evolution curve shows that the absence of normalization with the 1f measurements compromises the accurate representation of the fruits' respiration, generating noise (spikes and dips) highlighted by circles along the graph.
In contrast, the second experiment, using less ripe tomatoes, allowed for the successful collection and normalization of the data. The resulting curve, shown in Fig. 10, exhibited a smooth and consistent increase in CO2 concentration, which reinforced the sensor's ability to monitor the evolution of respiration in fruits with different levels of maturity. Although a gap in the data occurred due to a power outage, the experiment was resumed, and the normalized data continued to follow a clear trend, reinforcing the robustness and reliability of the proposed method. Similar to the banana experiments, there was a lag time before the CO2 concentration reached the sensor's detection limit, which was slightly longer, ranging from 4 to 5 hours. This prolonged delay is attributed to the factors previously cited, in addition to evidencing a slower respiration process in the tomato compared to the banana. Consequently, due to these slower ripening kinetics, the long-term saturation plateau of the sigmoidal curve is not fully depicted within the timeframe of Fig. 10. Nevertheless, the curve clearly displays the initial stages of the sigmoidal trend, specifically the lag phase and the subsequent exponential-like increase driven by the fruit’s metabolic activity and internal gas diffusion [34].

CO2 evolution curve normalized by 1f. An accompanying photo shows the tomatoes used at the start of the experiment. The gap in the data is due to a power outage that occurred during its execution.
IV. CONCLUSIONS
This work demonstrated the development and validation of a CO2 sensor based on the WMS technique for the real-time monitoring of fruit respiration. The system proved capable of detecting variations in CO2 concentration in bananas and tomatoes with high sensitivity and reproducibility, correlating them with their different ripening stages. The robustness of the experimental setup was confirmed in long-term experiments, and the use of the second-to-first harmonic normalization (2f/1f) proved essential for mitigating the effects of power and temperature fluctuations, ensuring the precision of the measurements.
Leveraging this established precision, the harmonic detection sensor achieved a significant result, presenting a detection limit that allows for the measurement of CO2 variations ranging between 122 and 488 ppm. While the absolute final concentration within the chamber was not the focus of this work, the primary objective: monitoring the evolution of CO2 concentration, was successfully met, providing a critical indicator of the fruit's ripening process. Furthermore, the sensor holds significant potential for future studies on Modified Atmosphere Packaging (MAP) and for investigating CO2 diffusion phenomena occurring during ripening, an effect clearly evidenced by the sigmoidal curves observed in both banana and tomato experiments.
These detailed insights into post-harvest physiological dynamics underscore the study's broader contributions. Specifically, a key contribution of this work is the successful validation of WMS utilizing the wavelength of 1572.3 nm for this specific type of post-harvest analysis, establishing the suitability of instrumentation capable of providing crucial data for the optimization of storage processes, quality control, and loss reduction in the food supply chain. The sensor's versatility allows for its use in future research to investigate ripening speed, fermentation, and the impact of external agents, such as ethylene (C2H4) or acetylene (C2H2), on the post-harvest physiology of fruits. Although the initial detection limit may be a consideration in some scenarios, the WMS sensor is established as a promising tool for the study of respiration in climacteric fruits.
ACKNOWLEDGMENTS
The authors thank the Fundação de Amparo à Ciência e Tecnologia de Pernambuco (FACEPE), the Conselho Nacional de Desenvolvimento Científico e Tecnologico (CNPq), the Coordenação de Aperfeiçoamento de Pessoal de Nível Superior (CAPES) and the Universidade Federal de Pernambuco (UFPE) for financial support.
DATA AVAILABILITY
All files generated or used in the development of this experiment are made available upon request.
REFERENCES
-
[1] U. Nasir, A. Ismail, M. Riaz, K. Razzaq, S. Ali, A. Hussain, M. Ameen, A. Saif, F. Aslam, C. A. F. Oliveira, “Exploring fruit ripening methods: conventional, artificial, and novel approaches for quality and health,” Food Control, vol. 165, pp. 110626:1-110626:15, 2024.DOI:10.1016/j.foodcont.2024.110626.
» https://doi.org/10.1016/j.foodcont.2024.110626. -
[2] P. Liplap, C. Vigneault, T. J. Rennie, J. Boutin, G. S. V. Raghavan, “Method for determining the respiration rate of horticultural produce under hyperbaric treatment,” Food and Bioprocess Technology, vol. 7, pp. 2461-2471, 2014. DOI: 10.1007/s11947-013-1183-8.
» https://doi.org/10.1007/s11947-013-1183-8 -
[3] S. Sonwal, V. K. Gupta, S. Shukla, R. Umapathi, S. M. Ghoreishian, S. Han, V. K. Bajpai, Y. Cho, Y. S. Huh, “Panoramic view of artificial fruit ripening agents sensing technologies and the exigency of developing smart, rapid, and portable detection devices: a review,” Advances in Colloid and Interface Science, vol. 331, pp. 103199:1-103199:32, 2024. DOI: https://doi.org/10.1016/j.cis.2024.10319910.1016/j.cis.2024.103199
» https://doi.org/10.1016/j.cis.2024.10319910.1016/j.cis.2024.103199 -
[4] J. H. Bower, J. J. Jobling, B. D. Patterson, D. J. Ryan, “A method for measuring the respiration rate and respiratory quotient of detached plant tissues,” Postharvest Biology and Technology, vol. 13, pp. 263-270, 1998. DOI:Error! Hyperlink reference not valid.10.1016/S0925-5214(98)00014-3.
» https://doi.org/10.1016/S0925-5214(98)00014-3 -
[5] C. J. Brady, and R. J. Romani, “Respiration and protein synthesis in nongrowing cultured pear fruit cells in response to ethylene and modified atmospheres: a model system for fruits postharvest,” Plant Physiology, vol. 87, pp. 571-576, 1988. https://doi.org/10.1104/PP.87.3.571 DOI: 10.1104/PP.87.3.571.
» https://doi.org/10.1104/PP.87.3.571.» https://doi.org/10.1104/PP.87.3.571 -
[6] F. Forcier, G. S. V. Raghavan, Y. Gariépy, “Electronic sensor for the determination of fruit and vegetable respiration,” International Journal of Refrigeration-revue Internationale Du Froid, vol. 10, pp. 353-356, 1987. DOI: 10.1016/0140-7007(87)90122-8.
» https://doi.org/10.1016/0140-7007(87)90122-8. -
[7] V. Paul and R. Pandey, “Role of internal atmosphere on fruit ripening and storability-a review,” Journal of Food Science and Technology, vol. 51, pp. 1223-1250, 2014. https://doi.org/10.1007/s13197-011-0583-x DOI: 10.1007/s13197-011-0583-x.
» https://doi.org/10.1007/s13197-011-0583-x.» https://doi.org/10.1007/s13197-011-0583-x -
[8] F. Morales, A. Cabodevilla, I. Pascual, A. Urdiain, “New instrumentation in grapevine research: a dual respiration prototype for grape berries and whole bunch. the grape co2/o2 respiratory quotient revisited,” Computers and Electronic in Agriculture, vol. 217, pp.108659:1-108659:10, 2024. DOI: 10.1016/j.compag.2024.108659.
» https://doi.org/10.1016/j.compag.2024.108659. -
[9] F. G. Calegario, R. G. Cosso, F. V. Almeida, A. E. Vercesi, W. F. Jardim, “Determination of the respiration rate of tomato fruit using flow analysis,” Postharvest Biology and Technology, vol. 22, pp. 249-256, 2001. https://doi.org/10.1016/S0925-5214(01)00096-5 DOI: 10.1016/S0925-5214(01)00096-5.
» https://doi.org/10.1016/S0925-5214(01)00096-5.» https://doi.org/10.1016/S0925-5214(01)00096-5 -
[10] A. Strouwen, B. M. Nicolaï, P. Goos, “Robust dynamic experiments for the precise estimation of respiration and fermentation parameters of fruit and vegetables,” Public Library of Sciense Computational Biology, vol. 18(1), pp. e1009610:1- e1009610:23, 2022. https://doi.org/10.1371/journal.pcbi.1009610 DOI: 10.1371/journal.pcbi.1009610.
» https://doi.org/10.1371/journal.pcbi.1009610.» https://doi.org/10.1371/journal.pcbi.1009610 -
[11] S. D. Bhande, M. R. Ravindra, T. K. Goswami, “Respiration rate of banana fruit under aerobic conditions at different storage temperatures,” Journal of Food Engineering, vol. 87, pp. 116-123, 2008. DOI:Error! Hyperlink reference not valid.10.1016/J.JFOODENG.2007.11.019.
» https://doi.org/10.1016/J.JFOODENG.2007.11.019 -
[12] P. M. Pieczywek, A. Nosalewicz, A. Zdunek, “Contactless estimation of apple fruit respiration rate using machine learning models based on laser speckle imaging,” Postharvest Biology and Technology, vol. 207, pp. 112626:1-112626:11, 2024. DOI: https://doi.org/10.1016/j.postharvbio.2023.11262610.1016/j.postharvbio.2023.112626
» https://doi.org/10.1016/j.postharvbio.2023.11262610.1016/j.postharvbio.2023.112626 -
[13] K. Liu, and C. Zhang, “Volatile organic compounds gas sensor based on quartz crystal microbalance for fruit freshness detection: a review,” Food Chemistry, vol. 334, pp. 127615:1-127615:12, 2021. DOI: 10.1016/j.foodchem.2020.127615.
» https://doi.org/10.1016/j.foodchem.2020.127615. -
[14] L. Persson, H. Gao, M. Sjöholm,S. Svanberg, “Diode laser absorption spectroscopy for studies of gas exchange in fruits,” Optics and Lasers in Engineering, vol. 44, pp. 687-698, 2006. https://doi.org/10.1016/J.OPTLASENG.2005.03.014 DOI: 10.1016/J.OPTLASENG.2005.03.014.
» https://doi.org/10.1016/J.OPTLASENG.2005.03.014.» https://doi.org/10.1016/J.OPTLASENG.2005.03.014 - [15] E. Fontana, and V. H. Soares, “Transport of acetylene through a liquid-gas interface measured by wavelength modulation spectroscopy,” Journal of Microwaves, Optoelectronics and Electromagnetic Applications, vol. 14. si-1, pp. 1-14, 2015.
-
[16] D. D. Arslanov, M. Spunei, A. K. Y. Ngai, S. M. Cristescu, I. D. Lindsay, S. D. Persijn, K. J. Boller, F. J. M. Harren,. “Rapid and sensitive trace gas detection with continuous wave optical parametric oscillator-based wavelength modulation spectroscopy,” Applied Physics B, vol. 103, pp. 223-228, 2011. DOI: https://doi.org/10.1007/S00340-010-4242-010.1007/S00340-010-4242-0
» https://doi.org/10.1007/S00340-010-4242-010.1007/S00340-010-4242-0 -
[17] R. A. Lima, V. H. Soares, J. F. Martins-Filho, E. Fontana, “Tailoring a spectral line detection system for applications in dissolved gas analysis,” Sensors and Actuators A: Physical, vol. 293, pp. 178-188, 2019, https://doi.org/10.1016/J.SNA.2019.04.020 DOI: 10.1016/J.SNA.2019.04.020.
» https://doi.org/10.1016/J.SNA.2019.04.020.» https://doi.org/10.1016/J.SNA.2019.04.020 -
[18] L. Gao, Y. Zang, G. Zhao, H. Qi, Q. Tang, Q. Liu, L. Jia, “Research on the seed respiration co2 detection system based on tdlas technology,” International Journal of Optics, vol. 2023, ID 8017726, pp. 1-13, 2023. DOIhttps://doi.org/10.1155/2023/8017726:10.1155/2023/8017726
» https://doi.org/10.1155/2023/8017726:10.1155/2023/8017726 -
[19] J. Yuan, L. Jia, L. Gao, H. Qi, X. Huang, “Application of svd emd sg combination algorithm in tdlas rice seed respiration detection,” 2021 International Conference on Information Technology and Biomedical Engineering, pp. 272-276, 2021. DOI: 10.1109/ICITBE54178.2021.00065.
» https://doi.org/10.1109/ICITBE54178.2021.00065. -
[20] G. Xingxing, Z. Wei, F. Xiancai, X. Jin, “Co2 gas detection device design based on tdlas technology for agricultural environment,” 2017 IEEE 3rd Information Technology and Mechatronics Engineering Conference , pp. 781-785, 2017. DOI: 10.1109/ITOEC.2017.8122458.
» https://doi.org/10.1109/ITOEC.2017.8122458. -
[21] R. Zhang, M. N. Guo, Y. Z. Wang, H. X. Yang, B. Hu, H. F. Guo, Y. Wang, “Research on co2 detection system in refrigerated compartment of agricultural products based on tdlas technology,” Procedia International Academy for Production Engineering, vol. 83 pp. 429-433, 2019. DOI: 10.1016/J.PROCIR.2019.04.140.
» https://doi.org/10.1016/J.PROCIR.2019.04.140. -
[22] T. Cai, G. Wang, W. Zhang, X. Gao, “Simultaneous measurement of co and co2 at elevated temperatures by diode laser wavelength modulated spectroscopy,” Measurement, vol. 45, pp. 2089-2095, 2012. https://doi.org/10.1016/J.MEASUREMENT.2012.05.006 DOI: 10.1016/J.MEASUREMENT.2012.05.006.
» https://doi.org/10.1016/J.MEASUREMENT.2012.05.006.» https://doi.org/10.1016/J.MEASUREMENT.2012.05.006 -
[23] R. Engelbrecht, “A compact nir fiber-optic diode laser spectrometer for co and co2: analysis of observed 2f wavelength modulation spectroscopy line shapes,” Spectrochimica Acta. Part A, vol. 60, pp. 3291-3298, 2004. DOI: https://doi.org/10.1016/J.SAA.2003.11.03310.1016/J.SAA.2003.11.033
» https://doi.org/10.1016/J.SAA.2003.11.03310.1016/J.SAA.2003.11.033 -
[24] E. Fontana, V. H. Soares, L. Urtiga, J. F. Martins-Filho, “Modeling partition dynamics through multiple interfaces and characterization by wavelength modulation spectroscopy,” Sensors and Actuators A-physical, vol. 316, pp. 112339:1-112339:11, 2020. https://doi.org/10.1016/J.SNA.2020.112339 DOI: 10.1016/J.SNA.2020.112339.
» https://doi.org/10.1016/J.SNA.2020.112339.» https://doi.org/10.1016/J.SNA.2020.112339 -
[25] M. A. Bolshov, Yu. A. Kuritsyn, Yu. V. Romanovskii, “Tunable diode laser spectroscopy as a technique for combustion diagnostics,” Spectrochimica Acta Part B: Atomic Spectroscopy, vol. 106, pp. 45-66, 2015. DOI: 10.1016/J.SAB.2015.01.010.
» https://doi.org/10.1016/J.SAB.2015.01.010. -
[26] J. Jiang, G-M. Ma, H-T. Song, C. R. Li, Y-T. Luo, H-B. Wang, “Highly sensitive detection of methane based on tunable diode laser absorption spectrum,” 2016 IEEE International Instrumentation and Measurement Technology Conference, pp. 1-5, 2016. https://doi.org/10.1109/I2MTC.2016.7520342 DOI: 10.1109/I2MTC.2016.7520342.
» https://doi.org/10.1109/I2MTC.2016.7520342.» https://doi.org/10.1109/I2MTC.2016.7520342 -
[27] J. Jiang, M. Zhao, G-M. Ma, H-T. Song, C-R Li, X. Han, C. Zhang, “Tdlas-based detection of dissolved methane in power transformer oil and field application,” IEEE Sensors Journal, vol. 18, pp. 2318-2325, 2018. https://doi.org/10.1109/JSEN.2017.2788871 DOI: 10.1109/JSEN.2017.2788871.
» https://doi.org/10.1109/JSEN.2017.2788871.» https://doi.org/10.1109/JSEN.2017.2788871 -
[28] A. Hartmann, R. Strzoda, R. Schrobenhauser, R. Weigel, “Ultra-compact tdlas humidity measurement cell with advanced signal processing,” Applied Physics B, vol. 115, pp. 263-268, 2014. https://doi.org/10.1007/S00340-013-5599-7 DOI: 10.1007/S00340-013-5599-7.
» https://doi.org/10.1007/S00340-013-5599-7.» https://doi.org/10.1007/S00340-013-5599-7 - [29] A. E. Siegman, Lasers. 1ª Ed. University Science Books, 1986.
- [30] E. Hecht, Óptica. 2ª Ed. Fundation Calouste Gulbenkian, 2002.
-
[31] V. H. Soares, “Caracterização de transporte e difusão molecular por espectroscopia de modulação de comprimento de onda e aplicações,” Tese (Doutorado em Engenharia Elétrica), Universidade Federal de Pernambuco, 2020, https://repositorio.ufpe.br/handle/123456789/41426
» https://repositorio.ufpe.br/handle/123456789/41426 -
[32] G. B. Rieker, J. B. Jeffries, R. K. Hanson, “Calibration-free wavelength-modulation spectroscopy for measurements of gas temperature and concentration in harsh environments,” Applied Optics, vol. 48 issue 29, pp. 5546-5560, 2009. DOI: 10.1364/AO.48.005546.
» https://doi.org/10.1364/AO.48.005546. -
[33] HITRAN., 2025. Database Online https://hitran.org/
» https://hitran.org/ -
[34] G. M. Badillo, and L. A. Segura-Ponce, “Classic and reaction-diffusion models used in modified atmosphere packaging (map) of fruit and vegetables,” Food Engineering Reviews, vol. 12, pp. 209-228, 2020. DOI: 10.1007/s12393-020-09214-3.
» https://doi.org/10.1007/s12393-020-09214-3. -
[35] N. Keshri, I. Truppel, W. B. Herppich, W. Geyer, C. Weltzien, P. V. Mahajan, “Development of sensor system for real-time measurement of respiration rate of fresh produce,” Computers and Electronics in Agriculture, vol. 157, pp. 322-328, 2019.https://doi.org/10.1016/j.compag.2019.01.006 DOI: 10.1016/j.compag.2019.01.006.
» https://doi.org/10.1016/j.compag.2019.01.006.» https://doi.org/10.1016/j.compag.2019.01.006
-
Editor:
Carlos E. Capovilla Associate Editor: Guilherme S. da Rosa