Evaluation of the Generation of Acid Contaminants in Small-Scale Ozonators
Abstract
The formation of undesirable nitrogenous contaminants has been reported in ozone production by dielectric barrier discharge process using air as the feed gas. This study aims to evaluate operational and environmental variables in the production of ozone and the formation of nitrogenous contaminants while using small-scale ozonators. The highest production of ozone occurred intermittently at higher flows, while relative humidity and increased temperature decreased production. The presence of nitrite and nitrate ions and a decrease in pH were verified in the aqueous phase, suggesting the formation of nitric acid and nitrous acid. In the intermittent mode, there was a lower generation of total nitrogen and nitrite and a higher production of ozone. Increasing the flow significantly decreases the formation of contaminants, and nitrite is not formed. Ambient air can be a more practical and lower-cost alternative for ozone production if the operating conditions are controlled.
Keywords:
ozone; production; nitric acid; nitrogen compounds; contaminants
Introduction
Ozone (O3) is used in several applications, such as water, soil, and effluent treatment, disinfection in agriculture, food industry, and medical areas.1-3 Due to the instability of ozone, its generation must be carried out in situ, generally using pressurized ambient air or oxygen as feed gas.4 Different forms of O3 production technologies have been used, such as electrochemical processes, ultraviolet radiation, corona discharge, and dielectric barrier discharge (DBD). The DBD is the most widely used process because it is easy to build, has a low cost, and is scalable to different production capacities.4-8 The efficiency of DBD depends on several factors, such as the feed gas type, pressure and flow rate, reactor structure, electrode and dielectric materials, and humidity.5-9
The formation and destruction mechanisms of O3 in the DBD system are complex.10 The most important reactions are summarized below:
The reaction mechanism starts with oxygen molecules (O2) getting excited and dissociating into individual oxygen atoms (O) by electrons with enough energy (reaction 1). These oxygen atoms then react with other O2 molecules and a third body (M) to form ozone (reaction 2). The ozone formed can be destroyed by a series of reactions (3-5), but the O3 production balance is positive under favorable conditions.
The electrical discharge of the DBD can have enough energy to break the bonds of the N2 molecules (reaction 6). The generated nitrogen atoms can subsequently react with O3/O2 generating nitrogen oxides (total reactive nitrogen: NOy = NOx, N2O5 (dinitrogen pentoxide), N2O (nitrous oxide), among others; (NOx = NO, NO2),4-8 as presented in reactions 7 to 10.
These nitrogen oxides, called reactive nitrogen species (RNS), undergo reactions in water vapor, producing a series of reactive oxygen species (ROS: hydrogen peroxide (H2O2), hydroxyl radical (OH•), hydroperoxy radical (HO2•),…).9 Under these conditions, the formation of nitric acid (HNO3) and nitrous acid (HNO2) can occur, and their conjugate bases, nitrate (NO3-) and nitrite (NO2-) ions, respectively, can be formed in the aqueous phase (reactions 12 and 13) as follows:
The DBD can exhibit different modes depending on the main gas products formed: O3 and NOx modes.6,8-11 Xi et al.11 reported a transition mode where O3 and NOx can be detected simultaneously. The three modes are suitable for different applications due to their chemical properties. O3 is a strong oxidizing agent used in industry and waste treatment, while in NOx mode, the conversion of N2 into NOx fixes nitrogen, which is very important for agricultural production.3,12
Reactive oxygen species and reactive nitrogen species are collectively referred to as RONS.13,14 They include hydroxyl radicals, peroxynitrite and ozone, and play a dual role as both deleterious and beneficial species in various biological processes and disease pathogenesis.15 In the DBD transition mode, RONS are formed being more efficient for plasma-activated water (PAW) an eco-friendly alternative to chemical disinfection.13,14 Recent studies16,17 have focused on the synergy of NOx mode and O3 mode air discharges for efficient and pollution-free disinfection.
Nitric acid (HNO3) and nitrous acid (HNO2), in addition to being toxic, also cause corrosion in materials.18 Nitric acid can quickly corrode the ozonator and reacts with contaminants in the gas supply to produce by-products, which can have adverse effects on the environment and humans.19,20 Nitrous acid, despite being a weak acid, can contribute to the corrosion of materials.21,22 In addition, the chemistry of volatile organic compounds (VOC) and oxides of nitrogen (NOx) lead to ozone formation in troposphere.23 Tropospheric ozone is an important air pollutant due to its diverse effects on air quality, ecosystems, health, and climate.24
The analysis of RONS in the gas phase is complex due to the low concentrations, high reactivity, and instability of several of these compounds.13 An alternative way of verifying the presence of some of these compounds is their retention in an aqueous solution and subsequent determination of the soluble species present in the gas (e.g., NO2, N2O5, HNO3) as well as those resulting from the reaction with water (NO3- and NO2-).25
The objective of this study is to evaluate the influence of environmental (relative humidity and temperature) and operational parameters (type of feed gas, flow rate, and generation modes) on the production of O3 in small-scale ozonators. The formation of undesirable nitrogenous compounds and the influence of those parameters on the amount and speciation of the formed contaminants will also be evaluated.
Experimental
Equipment
The ozonators were commercial equipment (Air Life, OZ Engenharia, Brazil). These ozonators are of the DBD type, built with coaxial quartz cells (Table 1). The ozonators OZ01 and OZ02 are similar, have encapsulated glass cells, and use clean air or oxygen as feed gas. The OZ02 ozonator is an earlier version of the OZ01 equipment. The OZ03 equipment has an open cell and uses only ambient air as the feed gas supplied by a fan with a fixed gas flow rate (90 L min-1). According to the manufacturer, these three ozonators have a nominal production of 15 mgO3 h-1 (at a flow rate of 2 L min-1 of ambient air). The electric power of the ozonators was measured using an oscilloscope (model 54622A, Agilent), a current probe (model A622, Tektronix), and a voltage probe (Tektronix 100:1). The measured electric power values are presented in Table 1.
Oxygen (Air Products, 99.995%) and ambient air were used to feed the gas flow of the DBD system. In some tests, air obtained by a purifier (model IQ 111, Thermo Scientific) that removes air contaminants such as O3, NOx, and CO (carbon monoxide) from ambient air, called clean air, was also used. A multicalibrator (model IQ 146, Thermo Scientific) was used to control the feed gas flow. The relative humidity (RH) and temperature (T) of the feed gas were analyzed continuously during the tests at the inlet of the ozonator with a sensor (LogBox, Novus, Brazil). This sensor cannot be used to monitor T and RH at the outlet of the ozonator, as its components are reactive to O3. In some tests, the temperature of the outer surface of the DBD was monitored using an infrared temperature meter (MultTemp, Incoterm, Brazil).
Calculation of the O3 production
The ozonators were evaluated for ozone production and stability as a function of environmental parameters (T and RH of the feed gas) and operational parameters (type of feed gas and flow rate). For the estimation of ozone production (PO3), the average concentration of O3, calculated by the theorem of the mean value, gas flow rate, and ozone density (at 273.15 K and 1 atm) were used according to the equation 14:
where: PO3 is the ozone production (mg h-1), Q is the flow rate (L min-1), CO3 is the ozone concentration (ppm), ρ is the specific density of O3 (2.14 kg m-3, at 273.15 K and 1 atm).
To calculate ozone production, the electric power of the equipment is used, as can be seen in equation 15:
where: YO3 is the yield of ozone (g kW h-1), PO3 is the ozone production (mg h-1) and EP is the electric power (W).
Measurement of ozone concentration
The concentration of O3 produced by the ozonators was measured in two analyzers depending on the concentrations range. A benchtop analyzer (model IQ 49, Thermo Scientific) was used for lower concentrations, calibrated with standard O3 mixtures generated by a multicalibrator (model IQ 146). The analyzer is equipped with a photometer to control the concentration of the O3 produced. A spectrophotometer (UV-330G, Gehaka) was used for high O3 concentration using flow cuvettes with 1 and 10 cm optical paths. The ozone concentration was calculated using the Lambert-Beer equation using the absorbance at 254 nm and molar absorptivity of 3,002 ± 27 L mol-1 cm-1.26
The responses of both analyzers were tested simultaneously for intermediate concentrations of O3. The concentrations measured by the two analyzers were compared using the iodometric method, obtaining non-significant differences (p = 0.05) in the concentration range of 4 to 2,400 ppm.27 It should be noted that the iodometric method is influenced by the presence of nitrogenous contaminants with oxidizing characteristics (NOx, NxOy, HNO3, among others), which can be generated when using ambient air as a feed gas. As a result, comparison tests between spectrophotometric analyses and the iodometric method were performed using pressurized O2.
To evaluate the effect of RH on O3 production, the clean air flow passed through a dehumidification system (liquid nitrogen trap) or humidification system (ultrapure water traps), as shown in Figure S1 (presented in Supplementary Information (SI) section). Clean air flow was obtained with different relative humidity (2, 25, 50, 70, and 90%) and analyzed continuously using T and RH sensor (LogBox, Novus, Brazil).
Contaminants formation
In tests to verify the formation of contaminants during ozone production, the gas flow output of the ozonator was passed through three traps connected in series (Figure S1). Ultrapure deionized water (150 mL, Millipore, MilliQ) was used as the retention solution in the traps where water-soluble compounds such as O3, nitrogen oxides, and acids were collected. The nitric acid and nitrous acid, formed in the gas or liquid phases, are ionizable in water, generating their conjugate bases, nitrate and nitrite ions. These ions were analyzed in three trap retention solutions.
Clean air, ambient air, or oxygen were used as feed gas at rates of 2 to 90 L min-1 for up to 1 h. Flow rates higher than 20 L min-1 were not used in OZ01 and OZ02 due to leakage and pressure problems. Clean air was used to avoid the influence of possible contaminants present in the ambient air, such as NOx, so that only the contaminants generated by the ozonator could be measured.
According to the procedure described in sub section “Measurement of ozone concentration”, different RH (2 to 90%) were tested in the feed gas (clean air) to evaluate their effect on the formation of contaminants.
Nitrite concentrations were analyzed using a colorimetric method based on the reaction of sulfanilamide in an acid medium.28 The total inorganic nitrogen concentration was analyzed by an elemental analyzer (model TOC-L/TNM-L, Shimadzu) following the procedures of the manufacturer.29 Some samples were also analyzed by ion chromatography (IC, Dionex DX 500), with determination of nitrite and nitrate contents. All the results were expressed as nitrogen basis (mgN L-1, mgN-NO2 L-1) to allow comparison between the different techniques used.
Results and Discussion
Evaluation of ozone production
Figure 1 shows the time profile of the O3 concentration produced in continuous mode in the OZ01 ozonator using clean air at a flow rate of 2 L min-1. It is possible to observe the generation of an intense peak (140 ppm) in the first 5 min of the test, followed by a rapid drop in concentration (30 ppm). Extending the monitoring time to 120 min, a slower and continuous decrease is observed, reaching a stabilization in concentration (plateau) with low values (ca. 7 ppm) after 2 h of testing (Figure 1). The decrease in O3 concentration over time is related to several factors, including the increase in temperature in the DBD cell,30,31 as well as the mode in which this cell operates (ozone, transition or NOx modes). To check the behavior of the system, the ozonator was turned off for 15 min, maintaining the feed gas flow, and turned back on for a 2nd cycle of O3 production. A second peak in the O3 concentration was observed (Figure 1) with an intensity (137 ppm) and amplitude (ca. 5 min) similar to the first peak, followed by a more significant drop (16 ppm) than that observed at the first O3 production cycle.

Ozone concentration profile generated by the OZ01 ozonator in two long cycles of production, using 2 L min-1 of clean air with RH 25 ± 5% at 20 ± 2 °C.
The lower concentrations in the 2nd production cycle suggest that the shutdown time was insufficient to reduce the temperature of the DBD cell. Continued use of the ozonator significantly impacts the ozone levels generated, probably due to increased ozone degradation at higher temperatures. It should be noted that similar behavior was reported by Pekárek et al.32 in O3 production on surface of DBD, with intense O3 peaks immediately after the discharge ignition.
The O3 concentration profile shows significant variation depending on the flow rate of the feed gas (Figure S2, SI section). Figure S2 shows the O3 concentration for five different feed gas flow rates (2 to 6 L min-1). The higher the flow rate, the less intense the decrease in ozone produced between the peak and stabilization region, varying by only 30 ppm (from 132 to 101 ppm) for the highest flow rate (6 L min-1) and 70 ppm for the lowest flow rate studied (2 L min 1). This behavior is not linear and is more significant at medium flow rates where the amount of O2 entering the ozonator is greater but not enough to dilute, producing more O3. In addition, high flow rates probably provide more efficient cell cooling, avoiding ozone degradation at longer test times. Under low flow conditions, the available energy per molecule in the gas flow is high, being able to break not only O2 bonds but also N2 bonds, as previously described (see Introduction section). In those conditions, ozone production decreases and can reach zero concentration, and the ozonator enters NOx mode in a so called “less ozone” region.
Even higher gas flows result in greater O3 production, but the concentration decreases due to the dilution effect.13 This behavior can be observed in Figure S3 (SI section), where the temporal profiles of the O3 concentrations produced for 2, 20, and 90 L min-1 gas flows are shown. For the flow rates of 2 and 20 L min-1, the O3 profiles are similar to that reported in Figure S2, with the increase in flow rate generating a more intense peak (135 ppm) followed by a less intense decrease (ca. 55 ppm) in the concentration of O3. However, with a further increase in the flow rate (to 90 L min-1), O3 concentrations are low and stable (15.5 to 16.5 ppm) throughout the period evaluated (60 min). In this case, despite the large amount of O2 in the feed air and the more significant potential to produce O3, the effect of dilution is more critical than in the other flow rates tested, reducing the efficiency of the process.
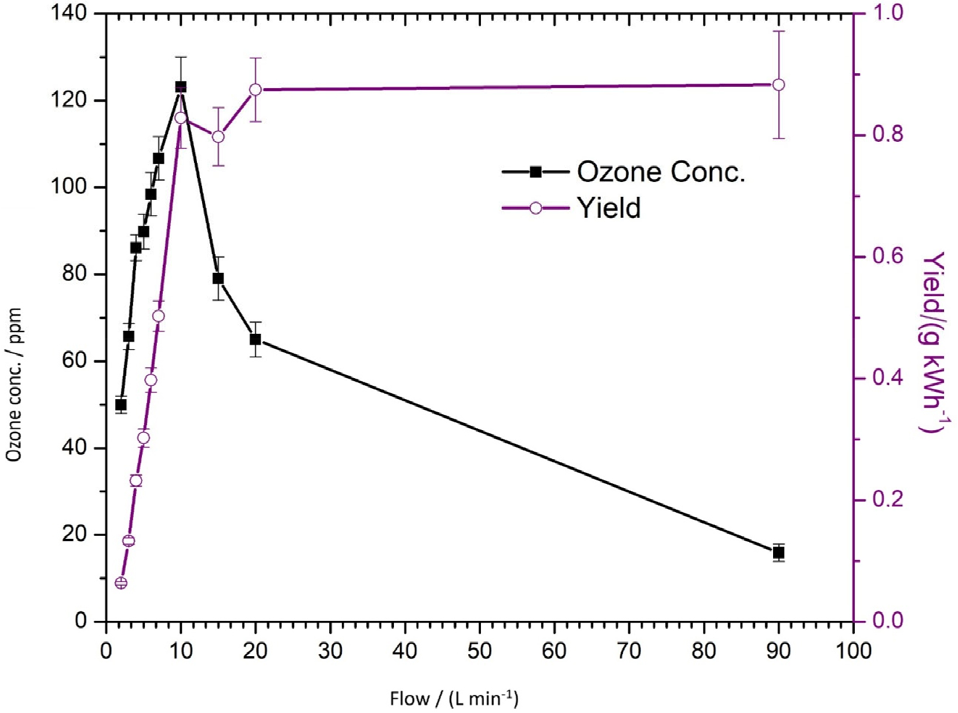
Figure 2 shows the O3 concentration (ppm) and O3 yield (g kW h-1) values as a function of the feed gas flow. A non-linear behavior is observed between the increase in flow and the concentration and production of O3. For lower flows (0-10 L min-1), both the yield (0.828 g kW h-1) and the O3 concentration (max 123 ppm) increase significantly. For intermediate flows (10-20 L min-1), the concentration decreases (65 ppm) while continuous production increases (0.875 g kW h-1). With the additional increase in flow (90 L min-1), the concentration continues to decrease while there is stead in yield (0.883 g kW h-1).

Ozone concentration and production yield obtained in the OZ01 ozonator for different clean air flow rates (RH 25 ± 5% at 20 ± 2 °C).
In the literature,33 a decrease in concentration and an increase in production (ozone output [g h-1]) or yield (ozone yield [g kW h-1]) with an increase in gas flow are reported. On the other hand, Homola et al.34 observed a similar behavior to this study, evaluating the efficiency of ozone production in coplanar DBD.
The initial increase in ozone concentration occurs due to the higher volume of feed gas necessary until saturation is reached. Subsequently, a decrease in ozone concentration with the increasing flow is caused by the progressive dilution of ozone. Eliasson and Kogelschatz10 reported that from a certain specific energy (lower volume of feed gas), the ozone formation ceases, and the NO concentration reaches a level at which the oxygen atoms react faster with NO and NO2 than they can react with O2 to form O3. The previously formed ozone is removed in a catalytic ozone destruction process involving NO and NO2 (see reactions 8 and 9).4-8
Continuous and intermittent ozone production modes
The production of O3 in continuous mode can lead, under certain flow conditions, to a reduction in the level of ozone generated. It should be noted that some commercial equipment is not used continuously but in on/off cycles. Figure 3 shows the ozone concentration profiles produced in the OZ01 in intermittent production mode. Figure 3a shows the results for the operational mode suggested by the manufacturer (called long cycle) with an initial time of 15 min in with the ozonator on followed by cycles of 5 min on and 5 min off. In Figure 3b, faster cycles were applied with periods of 2 min on followed by 2 min off.

Ozone concentration profiles in intermittent modes: (a) long cycles: 15 min on / 5 min off / 5 min on, and (b) short cycles: 2 min on / 2 min off. OZ01 using 2 L min-1 of clean air with RH 25 ± 5% at 20 ± 2 °C.
In the intermittent long-cycle mode, similar behavior to that reported in Figure 1 can be seen, with a peak (116 ppm) followed by a drop and plateau (52 ppm) in ozone concentration (Figure 3a). After the off period (5 min), the O3 concentration increases rapidly with peaks of similar amplitude and intensity to the initial one. For the intermittent mode with a short cycle (2 min), there are only more variable peaks with greater intensity (130 to 175 ppm) than in the long cycle (Figure 3b).
Aiming to compare the ozone generation efficiency in continuous mode (Figure 1) and intermittent cycles (Figure 3), the average O3 concentration was calculated for the same production period (30 min). The short intermittent mode generated the highest average concentration of O3 (63 ppm), followed by the continuous mode (50 ppm) and long intermittent mode (33 ppm). Ozone production follows the same trend with 9, 13, and 16 mg h-1 for the long cycle, continuous mode, and short cycle, respectively. These results suggest that the short intermittent cycle is the most suitable for ozone production.
Effect of humidity
Humidity is an important parameter in ozone production since it interferes not only with the O3 generation but also with contaminants.11 Figure S4 (SI section) shows a significant increase in O3 concentration (134 ppm) for dry gas (RH 2%) when compared to intermediate humidity (20%, 50 ppm O3). Subsequent increases in humidity (70-90%) do not cause significant variation in ozone concentration (37-57 ppm). The lowest O3 production (10 mg h-1) is observed for the highest relative humidity (90%), while the maximum production (37 mg h-1) occurred for the dry feed gas (2%). Xi et al.11 also reported decreased O3 generation in different production modes with increasing humidity.
Effect of temperature
Ozone is a thermally unstable compound, showing significant degradation at temperatures above 35 °C.30 To evaluate the influence of this parameter on the O3 concentration, measurements of the temperature on the external surface of the DBD cell were carried out. Figure 4a shows some results for different gas flows in continuous and intermittent modes (OZ01). For all tests, there is a relatively rapid increase in T from room temperature (23.6 ± 1.2 °C) in the first 15 min, reaching values of 39.6 ± 2.1 °C, which is maintained for a more extended period measured (30 min). Although the measurement was not made directly in the gas flow, the values obtained indicate real temperatures in a lower range due to the slow heat transfer in the encapsulating glass. It is assumed that the temperature in the DBD cell exceeds 35 °C, which can lead to thermal degradation of part of the ozone produced, corroborating the reported results.

(a) Temperature variation in the DBD cell for different feed gas conditions and (b) temperature and ozone concentration profiles in the gas outlet as a function of the time in continuous operation of 2 L min-1.
High flow rates and the use of intermittent mode tended to generate less heat build-up. This behavior is exemplified in Figure 4b, which presents the temporal profiles of the concentration of ozone produced and the temperature measured on the surface of the DBD cell. A drop in O3 concentration is observed after 3 min, which coincides with an increase in temperature (+10 °C) on the cell surface.
Evaluation of different ozonators
Table 2 shows the average ozone concentrations in the first 30 min and production results for the three ozonators evaluated, using ambient air or clean air or oxygen as feed gas. For the OZ01, increasing the clean air flow rate from 2 to 20 L min-1 only slightly increases the O3 concentration (50 to 65 ppm), but with a significant increase in yield (13 times). This result suggests that O3 production is more efficient at higher flow rates. As expected, using oxygen as a feed gas increases the concentration (211 ppm) and the ozone production (544 mg h-1). The O3 yield is 3.2 times higher than the test using clean air as the feed gas under the same condition. This result is in line with the literature data.4
Average concentration and yield of ozone produced in different ozonators according to the type and flow rate of the feed gas used
The OZ02 performed slightly better in terms of average concentration (62 ppm, +23%) and ozone yield (0.076 g kW h-1, +12%) when compared to the OZ01. Both ozonators have the same type of DBD cell, with the OZ01 being a more recent model. The variation in the performance of the two ozonators (23%) is above the variation in measurements (< 5%). This reinforces the need to evaluate the O3 production of each device before commercial use.
The results obtained for the OZ03, which operates with ambient air at a higher flow rate (90 L min-1), indicated a deficient O3 concentration (16 ppm) due to the dilution effect. The O3 yield (0.570 g kW h-1) is half compared to the OZ01 (0.901 g kW h-1) operating at the maximum flow rate tested for this ozonator (20 L min-1). These results indicated that OZ03 had the worst performance of all the ozonators tested. In addition, using ambient air as the feed gas in DBD cells also influences the unwanted formation of contaminants.
Formation of contaminants
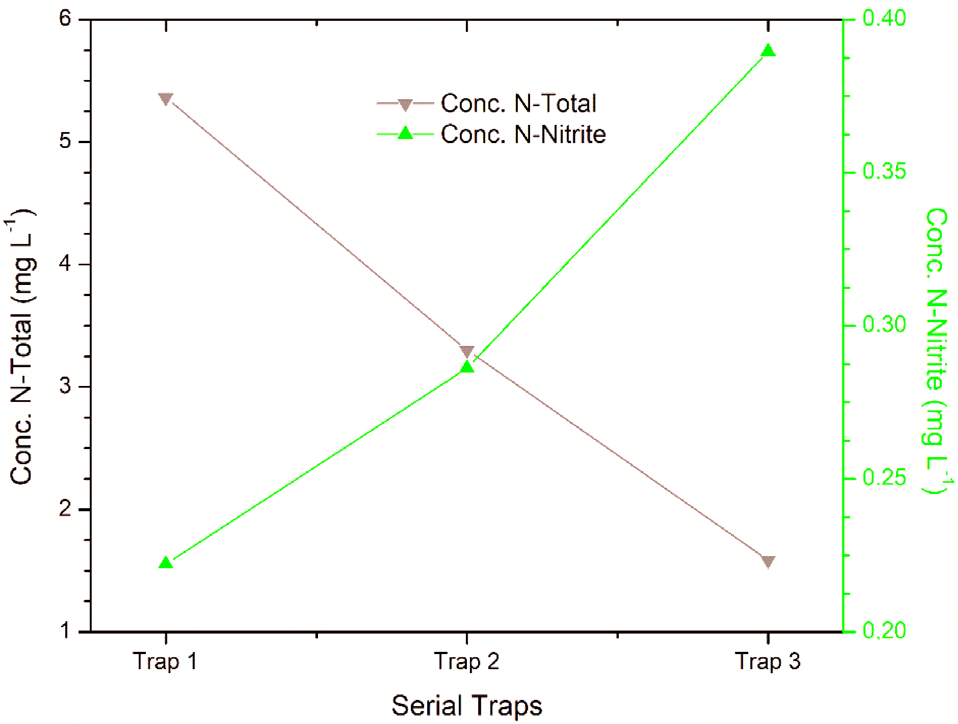
The formation of nitrogenous contaminants in the tested ozonators was evaluated under different conditions by analyzing pH and the concentrations of nitrite and total nitrogen (N-total) in the trap solutions. Figure 5 shows the concentrations of nitrite (expressed in mgN-NO2 L-1) and N-total (mgN L-1) in the solutions of each trap placed in series.
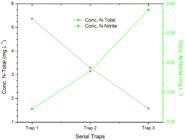
Concentration of nitrite (expressed as mgN-NO2 L-1) and N-total (mgN L-1) in the solutions of the traps arranged in series (2 L min-1, RH 25 ± 5% at 20 ± 2 °C).
As expected, N-total concentrations decrease from the first to the third trap, indicating that the main soluble nitrogen species are efficiently retained in the first and second traps (> 84%). On the other hand, nitrite shows an inverse behavior with increased concentrations from the first to the third trap, suggesting a possible loss of this compound with lower retention efficiency than total nitrogen. To evaluate this behavior, a fourth trap was added to the system, and the results obtained (not shown) indicated similar nitrite concentration in this trap compared to the preceding one (third trap, 70% efficiency). As for the N-total, the same downward trend was observed in the concentration, obtaining retention > 94% in the first three traps, which is adequate for retaining the species of interest.
As expected, the pH (Figure S5, SI section) of the solutions of the first trap decreased (pH 3.39 ± 0.01) compared to the ultrapure water used (6.08 ± 0.16). These results suggest the formation and/or dissolution of nitric and nitrous acids in the trap solutions. The pH of the solutions decreased with less intensity in subsequent traps, reaching pH 4.39 in the fourth trap.
The unexpected behavior of the nitrite ion may be related to the greater reactivity of the solution in the first trap. The more significant decrease in the pH of the solution in the first trap corroborates this hypothesis. The decrease in nitrite concentration may be due to its reaction with O3, forming nitrate. This aligns with the high total nitrogen concentration (5.5 mgN L-1) in the first trap.
Another aspect to consider is that unlike nitric acid, which dissociates completely in solution, nitrous acid is a weak acid that dissociates partially according to the reaction and equilibrium constant below:
For pH equal to pKa (3.39), the concentrations of nitrous acid and its conjugate base (nitrite ion) are equal, and any variation in the pH of the solution affects the equilibrium described by reaction 15. In addition, the water solubility of nitrous acid is significantly lower (Henry constant, H = 49 mol L-1 atm-1) than the solubility of nitric acid (H = 89,166 mol L-1 atm-1).35 Thus, at low pHs (< 4.0), the concentration of HNO2 in the aqueous phase is significant, and due to its lower solubility, its transfer to the gas phase can be important. The HNO2 can then follow the gas flow to the next trap, decreasing the nitrite concentration of the first trap.
The transfer to the acids in the gas phase was visually observed with the formation of a mist in the upper part of the traps above the liquid interface (headspace). This mist was generated more intensely in the first trap. The pH of this mist was measured with indicator paper, resulting in significantly more acidic values (pH 1 to 2) than those observed for the pH of the solution (3.3 to 3.8). These results corroborate the hypothesis of the transfer of the acids (HNO2 and HNO3) from the aqueous solution to the gas phase. The vapors of these acids can condense and/or be adsorbed on the water droplets deposited on the trap walls and follow the feed gas to the next trap.
Rathore and Nema25 also observed similar behavior in a DBD plasma used to evaluate the properties of plasma-activated water (PAW). These authors used four traps in series and observed the lowest nitrite contractions in the first trap solution. In addition to the significant decrease in pH, high redox potential (ORP) values were observed. According to Rathore and Nema,25 under these conditions, the nitrite ions reacted with dissolved O3 and H2O2 to form stable nitrate ions, conditions that are more intensely observed in the first trap.
It is important to emphasize that complementary ion chromatography analysis was performed for a few samples and indicated the presence of nitrate and nitrite ions. The sum of nitrite and nitrate concentrations obtained by ion chromatography (8 mg L-1) is similar to the N-total concentration (7 mg L-1) obtained by total organic carbon (TOC) analyses. These results suggest that these two ions are the main nitrogenous species present.
Influence of humidity
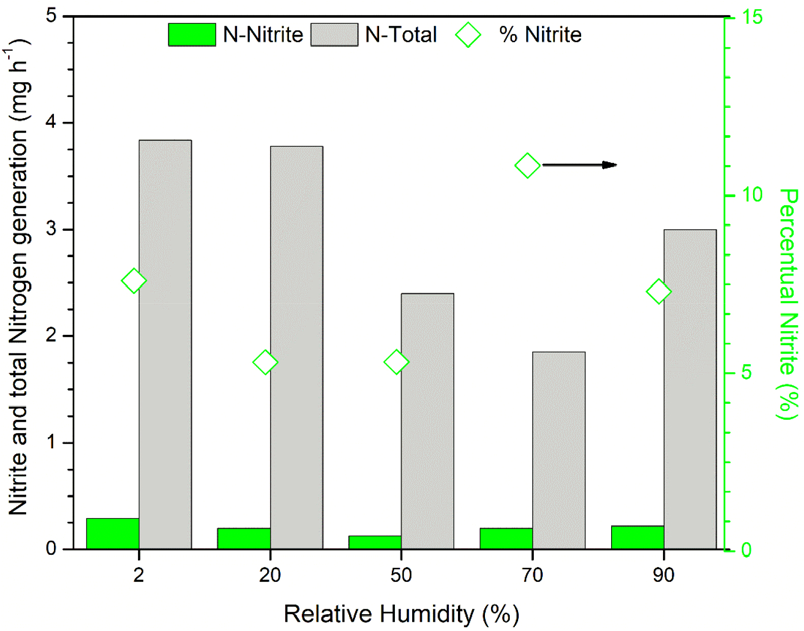
Figure 6 shows the formation rate of N-nitrite and N-total (mg h-1) for tests with relative humidity from 2 to 90% of the feed gas (clean air at 2 L min-1). A decrease in the formation of nitrite and N-total is observed with the increase of humidity from 2 to 70%, followed by an increase for higher humidity (90%). The contribution of nitrite to total nitrogen formation varies from 3 to 8%, with the lowest value for a humidity of 70%. The observed behavior reinforces the complexity of the mechanisms involved since the increase humidity in the DBD cell should increase the production of nitrogenous acids.

Formation rate of N-nitrite and N-total in tests with different relative humidity of the feed gas (2 L min-1 of clean air or ambient air at 20 ± 2 °C).
Influence of flow
Higher feed gas flow rates increase the amount of oxygen available in the DBD cell, reducing the specific input energy and, consequently, less breaking of the bonds in the N2 molecule. Figure 7 shows the formation rate of nitrite and total nitrogen expressed as mg h-1. There was a significant decrease in N-total (3.78 to 2.16 mgN h-1) and N-nitrite (0.2 to 0 mgN-NO2 h-1) as the flow rate increased from 2 to 20 L min-1. A further increase of the flow rate to 90 L min-1 did not reduce the formation of N-total, nor was there any nitrite formed. These results suggest that the presence of nitrite can be suppressed entirely at medium to high flow rates. However, the other nitrogenous species are still formed, especially nitrate/nitric acid, inferred by the decrease in the pH of the trap solutions (pH 4.90 in trap 1 compared to pH 6.09 in water solution, at 90 L min 1). The use of ambient air can lead to an increase in the concentration of NOx due to its previous presence as an atmospheric pollutant. However, this contribution is very small, given the average concentration of NOx in ambient air (see SI section).

Nitrite and N-total formation rate at different flow rates of the clean air (2 and 20 L min-1) and ambient air (90 L min-1).
Influence of the mode of production
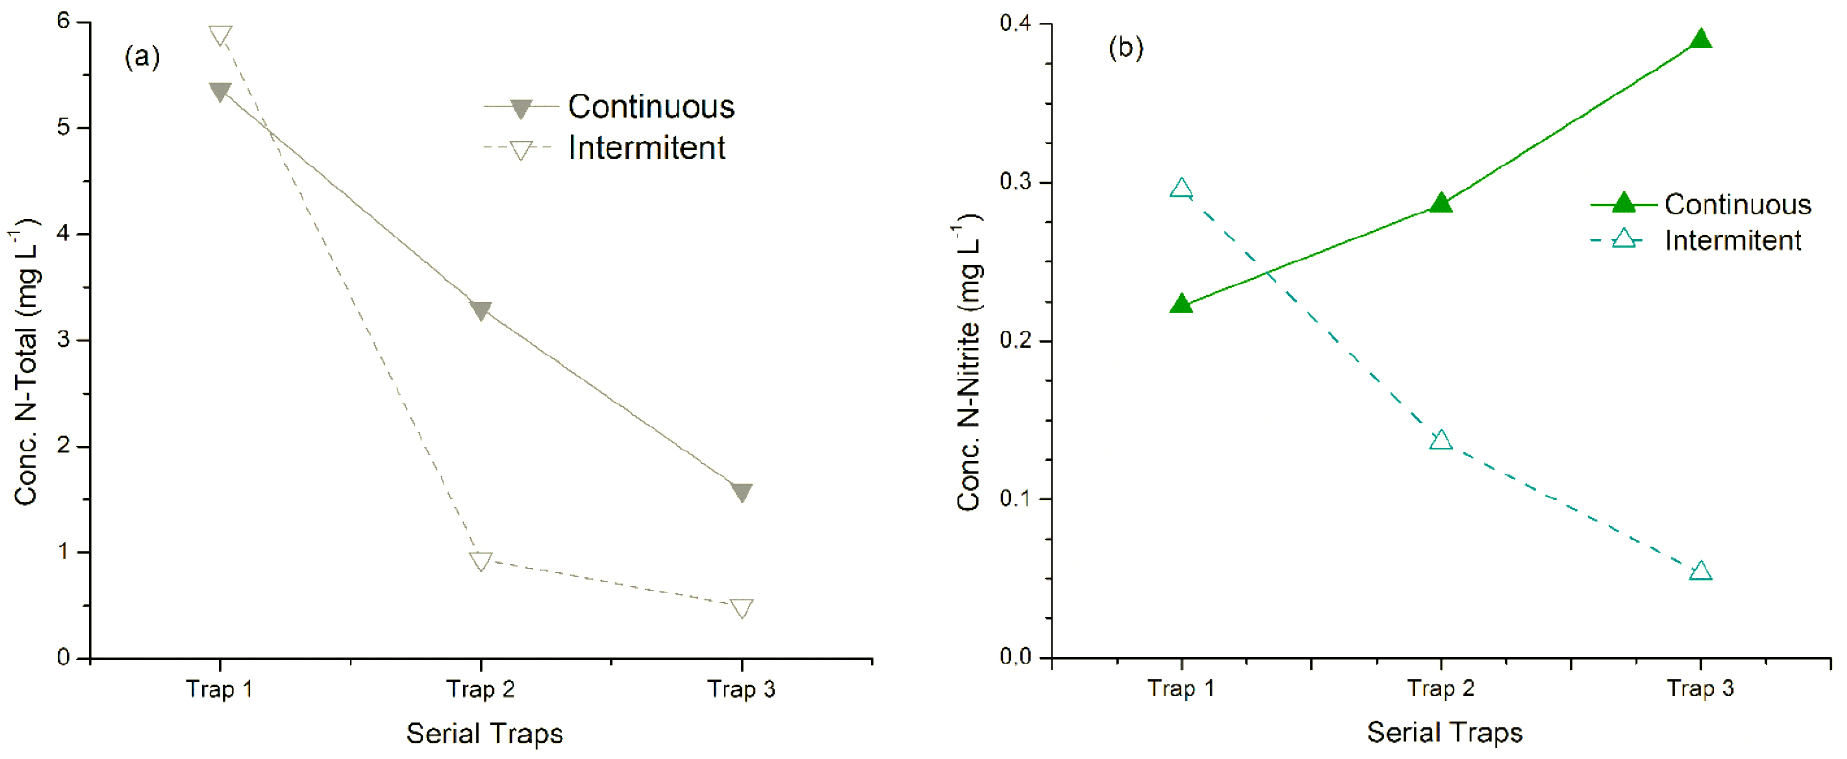
Figure 8 shows the concentration of contaminants in the solution of traps observed in continuous and intermittent modes. In both modes, the N-total concentrations in the first trap are similar, decreasing in the follow traps. However, in the intermittent mode, the concentration decrease is more pronounced (0.5-0.9 mgN L-1) than in the continuous mode (1.6-3.3 mgN L-1). It results in N-total formation rate three times higher in continuous mode (3.7 mg h-1) than intermittent mode (1.3 mg h-1).

N-total (a) and N-nitrite (b) concentrations in trap solutions of the continuous and intermittent tests (2 L min-1, clean air, RH 25 ± 5% at 20 ± 2 °C).
As previously reported, the nitrite concentration profiles (Figure 8b) showed different unexpected behavior in continuous mode as they increased from the first to the third trap (0.22 to 0.39 mgN-NO2 L-1). The opposite trend was observed in intermittent mode with a significant decrease in nitrite concentration (0.30 to 0.05 mgN-NO2 L-1). The nitrite formation rate is lower in intermittent (0.1 mg h-1) than in continuous mode (0.3 mg h-1).
This behavior may be partly related to the lower pH reduction (Figure S6, SI section) in the trap solutions in the intermittent mode test compared to the continuous mode. While in the continuous mode, the pH variation from the first to the third trap is from 3.39 to 4.11, in the intermittent mode, the pH varies from 3.49 to 5.05, with the final value closer to the initial pH of the water (6.19). As previously discussed, the decrease in pH can influence the aqueous phase reactions involving ozone with other active nitrogenous or oxygenated species present (ROS and RNS).9
The formation mechanisms of nitric acid in the ozonators that use ambient air as feed gas are reported in the literature.9 Instead, the generation of nitrous acid is less known and rarely cited. In this context, the obtained results are important and suggest different formation processes for these contaminants.36,37 As the generation of nitrogenous contaminants depends on the presence of nitrogen gas in the feed gas, supplementary tests were performed using oxygen (99% purity). As expected, the concentration of nitrite and total nitrogen are below the limit of detection of the analytical methods used.
In applications such as indoor disinfection, where small-scale ozonators are used, ambient air is commonly used as the feed gas. The use of ambient air significantly lowers the cost of ozone production. Therefore, a better understanding of the mechanisms of contaminant formation is essential to make the use of ozonators safer and increase their range of applications.
Conclusions
The ozonators evaluated in continuous operational mode showed an ozone peak followed by a significant decrease in O3 concentration when using low air flow rates as the feed gas. Increasing the air flow rate (up to 20 L min 1) makes ozone production higher and more stable. Higher flow rates (90 L min-1) decrease O3 production due to the dilution effect. The highest O3 production was seen in intermittent mode (short cycles). Increasing the humidity of the feed gas decreased the production of O3. As expected, the increase in cell temperature contributes to the decrease in O3 concentration, but other factors, such as the specific energy available, also contribute to this decrease.
Regarding the formation of contaminants, nitrite and nitrate ions and a decrease in pH were verified in the trap solution, suggesting the generation of HNO3 and HNO2 in the DBD cell. To minimize or avoid the formation of contaminants, the ozonator must operate with a more significant feed gas flow (> 20 L min-1) in intermittent mode, producing higher O3 concentration.
This study showed that ambient air could be a more practical and lower-cost alternative for intermittent ozone production with low contaminant levels if adequate conditions are used.
Supplementary Information
Supplementary data (graphics) are available free of charge at http://jbcs.sbq.org.br as PDF file.
Acknowledgments
The authors would like to thank Fundação de Amparo à Pesquisa do Estado do Rio Grande do Sul (FAPERGS) and OZ Engenharia for funding the project and Financiadora de Estudos e Projetos (FINEP) for providing the equipment for the analysis of total nitrogen. M. P., R. B. and F. A. would like to thank Conselho Nacional de Desenvolvimento Científico e Tecnológico (CNPq, grant 308885/2021-0), FAPERGS (grant 21/2551-0002172-1) and Coordenação de Aperfeiçoamento de Pessoal de Nível Superior (CAPES, finance code 001) for the scholarships awarded and financial support.
References
-
1 Suh, Y.; Patel, S.; Kaitlyn, R.; Gandhi, J.; Joshi, G.; Smith, N.; Khan, S.; Med. Gas Res. 2019, 9, 163. [Crossref]
» Crossref -
2 Epelle, E. I.; Macfarlane, A.; Cusack, M.; Burns, A.; Okolie, J. A.; Mackay, W.; Rateb, M.; Yaseen, M.; Chem. Eng. J. 2023, 454, 140188. [Crossref]
» Crossref -
3 Li, J.; Ge, J.; Xiao, B.; Wei, Z.; Zhang, W.; Ding, X.; Nano 2022, 17, 2250065. [Crossref]
» Crossref -
4 Yuan, D.; Wang, Z.; Ding, C.; He, Y.; Whiddon, R.; Cen, K.; J. Phys. D: Appl. Phys. 2016, 49, 455203. [Crossref]
» Crossref -
5 Dimitriou, M. A.; Design Guidance Manual for Ozone Systems; International Ozone Association, Pan American Committee: Sacramento, 1990. [Link] accessed in January 2025
» Link -
6 Kogelschatz, U.; Plasma Chem. Plasma Process. 2003, 23, 1. [Crossref]
» Crossref -
7 Alonso, J. M.; Valdés, M.; Calleja, A. J.; Ribas, J.; Losada, J.; Ozone: Sci. Eng. 2003, 25, 363. [Crossref]
» Crossref -
8 Torigoe, Y.; Iwasaki, A.; Namihira, T.; Wang, D.; Int. J. Plasma Environ. Sci. Technol. 2019, 12, 114. [Crossref]
» Crossref -
9 Abdelaziz, A. A.; Ishijima, T.; Osawa, N.; Seto, T.; Plasma Chem. Plasma Process. 2019, 39, 165. [Crossref]
» Crossref -
10 Eliasson, B.; Kogelschatz, U.; IEEE Trans. Plasma Sci. 1991, 19, 309. [Crossref]
» Crossref -
11 Xi, W.; Luo, S.; Liu, D.; Wang, Z.; Liu, Z.; Guo, L.; Wang, X.; Rong, M.; Phys. Plasmas 2022, 29, 090701. [Crossref]
» Crossref -
12 Lamichhane, P.; Pourali, N.; Rebrov, E. V.; Hessel, V.; ChemistrySelect 2024, 9, e202401076. [Crossref]
» Crossref -
13 Wang, Z.; Liu, L.; Liu, D.; Zhu, M.; Chen, J.; Zhang, J.; Zhang, F.; Jiang, J.; Guo, L.; Wang, X.; Rong, M.; Plasma Sources Sci. Technol. 2022, 31, 05LT01. [Crossref]
» Crossref -
14 Domonkos, M.; Tichá, P.; Trejbal, J.; Demo, P.; Appl. Sci. 2021, 11, 4809. [Crossref]
» Crossref -
15 Valko, M.; Leibfritz, D.; Moncol, J.; Cronin, M. T. D.; Mazur, M.; Telser, J.; Int. J. Biochem. Cell Biol. 2007, 39, 44. [Crossref]
» Crossref -
16 Lim, J. S.; Admasu, K. A.; Choi, E. H.; Plasma Processes Polym. 2024, 21, e2400098. [Crossref]
» Crossref -
17 Miranda, F. S.; Tavares, V. K. F.; Gomes, M. P.; Azevedo Neto, N. F.; Chiappim, W.; Petraconi, G.; Pessoa, R. S.; Koga-Ito, C. Y.; Water 2023, 15, 4045. [Crossref]
» Crossref -
18 Kaiga, N.; Takase, O.; Todo, Y.; Yamanashi, I.; Ozone: Sci. Eng. 1997, 19, 169. [Crossref]
» Crossref -
19 Braun, D.; Kuchler, U.; Pietsch, G.; Pure Appl. Chem. 1988, 60, 741. [Crossref]
» Crossref -
20 Franzblau, E.; J. Geophys. Res. 1991, 96, 22337. [Crossref]
» Crossref -
21 Park, J. Y.; Lee, Y. N.; J. Phys. Chem. 1988, 92, 6294. [Crossref]
» Crossref -
22 Noori, H.; Raud, J.; Talviste, R.; Jõgi, I.; Ozone: Sci. Eng. 2021, 43, 284. [Crossref]
» Crossref -
23 Finlayson-Pitts, B. J.; Pitts, J. N.; Air Waste 1993, 43, 1091. [Crossref]
» Crossref -
24 Elshorbany, Y.; Ziemke, J. R.; Strode, S.; Petetin, H.; Miyazaki, K.; de Smedt, I.; Pickering, K.; Seguel, R. J.; Worden, H.; Emmerichs, T.; Taraborrelli, D.; Cazorla, M.; Fadnavis, S.; Buchholz, R. R.; Gaubert, B.; Rojas, N. Y.; Nogueira, T.; Salameh, T.; Huang, M.; Atmos. Chem. Phys. 2024, 24, 12225. [Crossref]
» Crossref -
25 Rathore, V.; Nema, S. K.; Phys. Plasmas 2022, 29, 033510. [Crossref]
» Crossref -
26 Gorshelev, V.; Serdyuchenko, A.; Weber, M.; Chehade, W.; Burrows, J. P.; Atmos. Meas. Tech. 2014, 7, 609. [Crossref]
» Crossref -
27 Rakness, K.; Gordon, G.; Langlais, B.; Masschelein, W.; Matsumoto, N.; Richard, Y.; Robson, C. M.; Somiya, I.; Ozone: Sci. Eng. 1996, 18, 209. [Crossref]
» Crossref - 28 Associação Brasileira de Normas Técnicas (ABNT); ABNT NBR 12619: Águas - Determinação de Nitrito - Método de Sulfanilamida e N-(1- Naftil) - Etilenodiamina; ABNT: Rio de Janeiro, 1992.
-
29 Shimadzu; TOC Application Handbook; Shimadzu Europa: Duisburg, 2018. [Link] accessed in January 2025
» Link -
30 Peyrous, R.; Ozone: Sci. Eng. 1990, 12, 41. [Crossref]
» Crossref -
31 Jodzis, S.; Baran, K.; Vacuum 2022, 195, 110647. [Crossref]
» Crossref -
32 Pekárek, S.; Mikeš, J.; Červenka, M.; Hanuš, O.; Plasma Chem. Plasma Process. 2021, 41, 779. [Crossref]
» Crossref -
33 Zhang, X.; Lee, B. J.; Im, H. G.; Cha, M. S.; IEEE Trans. Plasma Sci. 2016, 44, 2288. [Crossref]
» Crossref -
34 Homola, T.; Pongrác, B.; Zemánek, M.; Šimek, M.; Plasma Chem. Plasma Process. 2019, 39, 1227. [Crossref]
» Crossref -
35 Sander, R.; Atmos. Chem. Phys. 2015, 15, 4399. [Crossref]
» Crossref -
36 Talviste, R.; Raud, S.; Jogi, I.; Plank, T.; Raud, J.; Teesalu, T.; Plasma Res. Express 2019, 1, 045002. [Crossref]
» Crossref -
37 Tachibana, K.; Nakamura, T.; Jpn. J. Appl. Phys. 2020, 59, 056004. [Crossref]
» Crossref
Edited by
-
Editor handled this article:
Ivo M. Raimundo Jr. (Associate)