Eco-Friendly Collagen Films: Valorization of Leather Tannery Waste and Bioactive Potential of Hymenaea martiana Extract
Abstract
The aim of this study was to develop sustainable films based on collagen recovered from tanned leather waste with Hymenaea martiana stem extracts (HMEC) obtained by microextraction, with an emphasis on evaluating their physical and chemical properties. The phytochemical analysis of HMEC revealed a high content of phenolics (396.6 mg of gallic acid equivalents per gram of extract (mg EAG g-1) and flavonoids (296.2 mg of catechin equivalents per gram of extract (mg EC g-1)), with a predominance of flavonoids (74.7%). The liquid chromatography electrospray ionization quadrupole time-of-flight mass spectrometry (LC-ESI-Q-TOF-MS) characterization evidenced a wide diversity of secondary metabolites, highlighting flavonoids such as fustin, isokaempferide, liquiritigenin, myricitrin, quercitrin, and quercetin derivatives, in addition to compounds such as quinic acid and glycosides. Furthermore, hydrolyzed collagen obtained from leather industry waste was combined with polyvinyl alcohol (PVA), glycerol, and different concentrations of HMEC to produce the films. The films exhibited high tensile strength (3833-4570 mPa), a significant increase in elongation at break (187.5-311.1%), and a swelling rate of up to 624.2% in samples with 3% HMEC, retaining 70% moisture after 18 h. The results highlight the great potential of these films for wound treatment and reinforce the sustainable reuse of leather industry waste.
Keywords:
circular economy; leather shavings; recycling; Jatobá; natural products
Introduction
Tanning transforms the skin into leather by cross-linking the collagen fibers, making it resistant to various factors such as heat, humidity, enzymatic degradation and mechanical stress.1 Chrome tanning is the most widely used method in the leather industry, as it is faster and cheaper than vegetable tanning.2 The leather production process generates substantial amounts of waste. For every ton of salted animal hide, 200 kg of finished material is obtained, and approximately 600 kg of solid waste is produced, such as tanned leather shavings (TLS) or wet-blue.3 Although landfilling TLS is a common practice, it causes significant environmental damage including water and soil contamination due to the bioaccumulation of pollutants.4
Against oxidizing agents, the CrIII present in TLS is oxidized at CrVI, its most toxic form, recognized by its carcinogenic and mutagenic capacity, posing a serious risk to public health and ecosystems due to its high mobility and persistence in soils and groundwater.5,6 Therefore, strategies aimed at reusing and valorizing of this waste, such as its conversion into hydrolyzed collagen and a posterior application in polymeric materials, not only mitigate environmental impact but also foster the principles of the circular economy within the sector.4
The collagen present in TLS has a wide range of applications in different fields, including the medical field, where it is used in various formulations, such as ointments, hydrogels, membranes and artificial skin.7-9 Although collagen is widely used, it has limitations, such as fragility and difficulty in molding.10 To overcome these limitations, collagen is often combined with other materials.11 Polyvinyl alcohol (PVA) stands out because it is water-soluble, non-toxic, biodegradable, biocompatible, transparent and has excellent film-forming capacity.10
The combination of collagen with materials such as PVA, along with the incorporation of plant extracts, further extends the versatility of collagen, making it a valuable resource for the development of new materials. Collagen-based films act as barriers that protect the wound from the external environment and provide high levels of hydration, essential for effective healing.11,12 In addition, collagen films promote cell proliferation and migration, essential processes in wound healing.11
Jatobá (Hymenaea martiana), a tree native to Central and South America, is widely used in folk medicine for the treatment of injures, inflammations, bronchitis, stomachs disorders and bacterial infections.13-15 Over the years, research have been proving and relating to terpenes or phenolic compounds its antibacterial, antinociceptive, analgesic, antioxidant and anti-inflammatory potentials.16-19
In view of the bioactive potentials of H. martiana and collagen, this study proposes the development of a collagen-based film incorporating the ethanolic extract of H. martiana (HMEC) as a sustainable alternative for the management of waste generated during leather processing. This approach aims to promote circularity in the tanning industry by valorizing TLS waste and, consequently, reducing the environmental impact of leather production.
Experimental
Materials
TLS were donated by a partner company. The H. martiana stalks were collected at Federal University of Vale do São Francisco, Petrolina-PE (9°19’30.0”S, 40°33’00.0”W) and the access was registered in the National System for The Management of Genetic Heritage and Associated Traditional Knowledge (SisGen) under record number A247F3C. Commercial grade chemicals were used to obtain collagen and plant extracts. Polyvinyl alcohol (PVA) composite polymer, glycerol (Gly) and polyethylene glycol 400 were purchased from Dinâmica®, ISAFAR® and Viafarma®, respectively.
Extraction and characterization of collagen from TLS
TLS were characterized through chromic oxide content determination, Fourier-transformed infrared spectroscopy (FTIR) (IRTracer-100, Shimadzu, Japan), scanning electron microscopy (Hitachi, TM 1000, Japan) X-ray spectroscopy with energy dispersive analysis (Hitachi, TM 1000, Japan), and then, submitted to dechroming route as described in the following sub-sections.20
Alkaline oxidation dechroming
The alkaline oxidation dechroming of TLS was adapted from the procedure described by Balarim et al.21 Therefore, four groups with 40 g of washed TLS were humidified in alkalized water (pH 10) by CaO 3% (m/v) solution, in systems containing 1:10 (m/v) material-medium proportion during 30 min. Then, aqueous Na2SO4 5% (m/v) solution was added to media and 2 h later, H2O2 solutions (at 3 or 30% m/v) were added to mixtures, where remained at a third rest for 18 and 24 h. Whenever necessary, the pH was adjusted through CaO 3% (m/v) solution addition. After filtration, the remains solids of each system were successively washed on agitation per 30 min and then, washed sequentially with solutions of sodium sulfate 10% (m/v), sulfuric acid 1% (v/v) and sodium chloride 6% (m/v), respectively. The obtained collagen was dried in an oven at 45º C under air circulation and weighed.
Collagen hydrolysis
The collagen acid hydrolysis was performed according to Masilamani et al.,22 with few adaptations. Treated collagen was soaked in an acetic acid solution with a standardized concentration of 0.501 M and heated to 70 °C under constant agitation for 8 h. Then, the material was sieved and dried in an oven with air circulation for 72 h at 45 °C.
UV-visible (UV-Vis) spectroscopy of hydrolyzed collagen
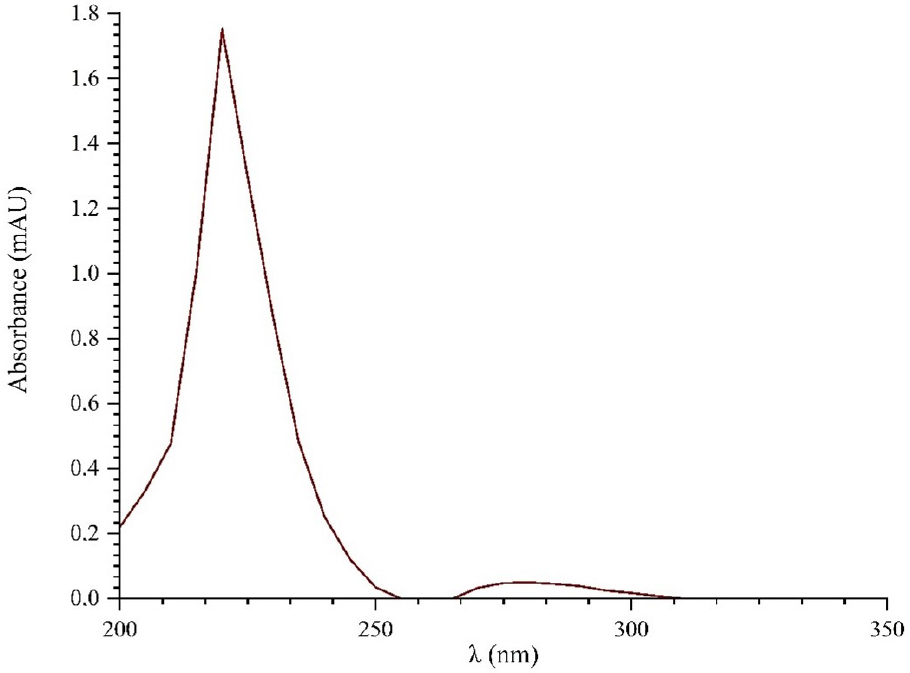
Solutions of hydrolyzed collagen (HC) at 0.5 mg mL-1 in 0.5 M acetic acid were prepared and centrifuged at 5000 RCF (relative centrifugal force) for 10 min at 4 °C. UV-Vis spectra were obtained in a range of 190 to 450 nm, with an interval of 5 nm between lectures, using a UV-Vis spectrophotometer (EVEN®, model IL-592, Spain).23
Acetic acid dosage in hydrolyzed collagen
Aliquots of HC were weighed, dissolved in distilled water using a heating plate and submitted to potentiometric titration with a standardized 0.011 M NaOH solution, using a digital pHmeter (Hanna Instruments, HI 2221, USA). The acetic acid content was determined as the percentage of acid per gram of sample. The experiment was conducted in triplicate.24
Preparation and characterization of crude ethanol extract
Ultrasound assisted extraction
The plant material was dried in an oven with air circulation at 40 °C for 72 h and pulverized. The crude ethanol extract was obtained after exhaustive ultrasonic extraction cycles of drug vegetal, using ethanol 95% as solvent at 1:10 (m/v) drug-solvent proportion and posterior distillation at 45 ºC under vacuum system.25
Determination of the content of total phenolic compounds
HMEC hydroalcoholic solutions at 1000 μg mL-1 were submitted to Folin-Ciocalteau method. A curve calibration of acid gallic standard range 50 to 1000 μg mL-1 was prepared and the absorbances of samples plotted in calibration equation (y = 0.001x - 0.0314, coefficient of determination (R2) = 0.9982). The experiment was performed in triplicate and results expressed in mg of gallic acid equivalents per gram of extract (mg EAG g-1).26
Determination total flavonoid compounds content
Hydroalcoholic solutions of HMEC at 1000 μg mL-1 were submitted to total flavonoid compounds assay using AlCl3 as a colorimetric agent. After the reaction steps, the flavonoid content was calculated based on the equation of a straight line (y = 0.0028x - 0.0037, R2 = 0.9992), obtained considering the calibration curve of the catechin standard (25 to 500 μg mL-1). The results were expressed in mg of catechin equivalents per gram of extract (mg EC g-1).27
Liquid chromatography electrospray ionization quadrupole time-of-flight mass spectrometry (LC-ESI-Q-TOF-MS) analysis
The analysis using LC-ESI-Q-TOF-MS was carried out based on the method described by Macêdo et al.,28 with some modifications. Fifteen microliters of the HMEC sample (1 mg mL-1) were injected into the LC-40D X3 (Shimadzu) equipped with the CBM-40, DGU-40S, LC 40D X3, SIL 40C X3, and CTD-40S modules, coupled to a LCMS-9050 mass spectrometer (Shimadzu) with an electrospray ionization (ESI) source and a quadrupole time-of-flight (Q-TOF) analyzer. LC experiments were performed using a C18 column (Kromasil-250 mm × 4.6 mm × 5.0 µm). The mobile phase consisted of water (solvent A) and methanol (solvent B). A linear gradient (5-100%) was applied for elution over 27 min, with a flow rate of 0.3 mL min-1. The mass spectrometer parameters were as follows: capillary voltage: -3.0 kV, nebulizing gas flow rate: 3.0 L min-1, drying gas flow rate: 10 mL min-1, and interface temperature: 300 °C. Substances were analyzed in negative ionization mode (m/z 100-1200). For fragmentation, argon was used as the collision gas, and the collision cell was operated with a collision energy (CE) of 5-55. Product ions in the range of m/z 50-1200 were monitored. The interpretation of the data was aided by a literature review and the use of resources such as the MS-DIAL Library, version 5.5.250820, Japan.
Free radical 2,2-diphenyl-1-picrylhydrazyl (DPPH) scavenging
Solutions of HMEC, PVA, Gly and HC were prepared in ethanol and diluted in a concentration gradient. The free radical DPPH was dissolved in ethanol and adjusted to absorbance of 0.460-0.470 at 518 nm. In glass cuvettes, 2 mL of the dilutions were mixed with 1 mL of the DPPH solution and left to rest for 30 min, protected from light. The reading was performed on a spectrophotometer at 518 nm.29 The results were expressed in half maximal effective concentration (EC50) and compared with ascorbic acid, butylated hydroxyanisole (BHA) and butylated hydroxytoluene (BHT) standards.
Inhibition of β-carotene auto-oxidation
To evaluate the antioxidant activity in lipophilic media, the same samples used in DPPH assay were submitted to methodology proposed by Aidi Wannes et al.30 To determine the antioxidant activity (AA) the following equation was used:
where: A0 is the initial absorbance of samples, A1 is the final absorbance of samples, A°0 is the initial absorbance of negative control (blank) and A°1 is the final absorbance of negative control (blank).
Evaluation of antimicrobial activity against Staphylococcus aureus strains
Antibacterial activity of the extract was evaluated by the broth Santos et al.31 and recommended by the Clinical Laboratory Standards Institute.32 A methicillin-resistant clinical isolate of Staphylococcus aureus (MRSA 8536) and a reference bacterial strain (ATCC 25923) were used. Blood culture isolates were provided by the microbiology laboratory of the University of Santa Maria. The reference strains were obtained from National Institute for Quality Control in Health (INCQS FIOCRUZ - Brazil).
Solutions of HMEC, PVA, Gly and HC were prepared at 25 mg mL-1 and solubilized in an 3% dimethyl sulfoxide (DMSO) aqueous solution. Then, in 96-well microplates, serial dilutions were performed, resulting in concentrations from 12.5 to 0.19 mg mL-1 in sterile BHI (brain heart infusion) broth. Subsequently, 10 μL of the inoculum, containing 1.5 × 10⁸ colony forming units (CFU) mL-1, were added to each well and incubated in an oven at 37 °C for 24 h. After this period, 100 μL of 2,3,5-triphenyl-tetrazolium chloride (CTT) solution at 1% (m/v) were added to each well and the appearance of a red tone indicated the presence of metabolically active bacteria. The minimum inhibitory concentration (MIC) was determined by the lowest concentration capable of inhibiting bacterial growth. In order to, 10 μL from each well were transferred to petri plates containing Muller-Hinton agar medium and incubated at 37 °C for 24 h to determine the minimum bactericidal concentration (MBC), considering the lowest concentration capable of preventing the development of colonies.
Phytochemical screening
The samples were dissolved in chloroform and applied to chromatography plates (Silicycle TLC - Aluminum F 254). Subsequently, the plate was eluted using different solvent systems. The main classes of secondary metabolites were identified using specific revealers and a UV camera at wavelengths of 254 and 365 nm, based on the intensity of the staining, following the method of Wagner and Bladt.33
Film preparation and characterization
Initially, HMEC solutions at 1, 3 and 5% using aqueous polyethylene glycol 4000 solution at 10% (m/v) as solvent were prepared and reserved. Then, PVA solutions at 5.5% were performed by dissolution in distilled water at 90 °C under stirring, followed by addition of 6 g of HC, 10 mL of Gly and temperature reducing to 40 °C. Each HMEC was individually added to systems that remained at stirred continuously for 60 min. Finally, 15 mL aliquots of the film-forming solutions were distributed in glass molds with a diameter of 10 cm and dried at room temperature for seven days.22
Thickness determination
Film thickness was measured in five random positions using a handheld digital micrometer (Mitutoyo, Series 395). The values were expressed as average, and all assays performed out in triplicate.34
Mechanical properties
Tensile strength (TS) and elongation at break (EB) were evaluated using a universal testing machine (Instron Ltd., EMiC DL-30000, USA), according to Lin et al.,35 with modifications. Before testing, the films were conditioned at 25 ± 2 °C, with a relative humidity of 50 ± 5%, for 48 h. Then, the films were cut into rectangles (0.5 × 2 cm). Analyzes were performed using a 5 kN load cell with a cruising speed of 20 mm min-1.
Solubility determination
The weight (m1) of rectangles with (10 mm × 4 mm) area were measured after drying in an oven during 2 h at 105 °C. Subsequently, they were immersed in 30 mL of distilled water for 24 h at room temperature. The samples were filtered through filter paper and dried in an oven under increasing temperatures, starting at 80 °C for 1 h, then increasing to 105 °C for 2 h and weighed (m2).34 The percentage of solubility was expressed by equation 2:
Swelling index and water vapor retention
The films were cut into 30 mm × 30 mm squares, dried in an oven at 105 °C for 2 h, and then immersed in 20 mL of solution with varying pH (5, 7 and 8) for 2 h. After swelling, the samples were carefully removed, dried on filter paper and weighed. The swelling index (SI) was calculated using equation 3:
where: m1 and m2 are the dry and wet film mass, respectively. The assay was performed in triplicate.35 The moisture retention of the dressing was evaluated according to the method suggested by Liang et al.36 The wet films were transferred to a glass desiccator at 25 °C, and moisture retention was recorded over 18 h.
Opacity
The opacity of films was quantified by measuring the absorbance at a wavelength of 600 nm with a UV-Vis spectrophotometer (Dinko instruments, UV4000, Spain). The films were cut into rectangular shapes to fill the translucent area of the glass cuvette. The blank was carried out using an empty cuvette. The opacity of the films was calculated by equation 4:
where: T is transparency, Abs600 is the absorbance value 600 nm and X the films thickness.37
Fourier transform infrared spectroscopy (FTIR)
The FTIR spectra of samples, HC and films, were carried out on Fourier transform infrared spectrophotometer (IRTracer-100, Shimadzu, Japan), equipped with reflectance horizontal total attenuation (ATR) apparatus, using a spectral window 600-4000 cm-1, 50 scans and 4 cm-1 of resolution.22
Scanning electron microscopy (SEM)
The morphological analysis of the samples was conducted using images obtained in a scanning electron microscope (Hitachi, TM 1000, Japan). The samples were fixed in aluminum stubs with carbon tape and metallized with gold powder for 12 min under vacuum. The images were captured at a magnification of 10000 times and a voltage of 10 kV.38
Differential scanning calorimetry (DSC)
The thermal behavior of films was evaluated by differential scanning calorimetry (DSC) using a differential scanning calorimeter model differential scanning calorimeter (Shimadzu, DSC-60, Japan). Initially, 5 mg of each film were placed in aluminum pans and hermetically sealed using a hydraulic press. Analyzes were conducted with a heating ramp from 30 to 300 °C, at a heating rate of 10 °C min-1 in an inert atmosphere, using an empty pan as a reference.22
Statistical analysis
Results were presented as mean ± MSE (mean standard error). EC50 and CL50 (letal concentration) were calculated using nonlinear regression, and statistical analysis was performed using one-way analysis of variance (one-way ANOVA), followed by Tukey’s multiple comparison test. P values < 0.05 were considered statistically significant. All analyzes were performed using the GraphPad software. Prism® 8.0 (GraphPad Prism Software, Inc., San Diego, CA, USA).
Results and Discussion
Extraction of collagen from TLS
The generation of shavings from leather during tanning processing entails serious environmental problems, since under ideal circumstances, CrIII present in this material can oxidize and form CrVI, a toxic form associated with adverse effects on human health in acute and chronic exposures, as well as its negative ecological impact.6,39 In line with other reports that presented contents in the range of 3.0 to 7.5%, the analysis of TLS samples, used in this study, revealed a chromium oxide content (Cr2O3) content of 3.129% (Table 1).40 Despite standing next to lower limits reported in other studies, is still a concern and it turns management alternatives necessary, as well as treatments that reduce the polluting potential of these tailings.
The oxidation route in an alkaline medium proved efficient in removing chromium, especially with the use of 30% hydrogen peroxide (H2O2), with no significant differences between the time intervals of 18 and 24 h (Table 1). The energy dispersive X-ray spectroscopy (EDS) analysis (Figure 1) confirmed these results by showing a reduction in the chromium percentage between the tanned leather waste (39.4%) and the collagen treated with H2O2 for 18 h (1.1%), resulting in a decrease of more than 97% of chromium. CrIII is considered an essential micronutrient in the metabolism of glucose, lipids, and proteins, with a recommended daily intake of 50 200 μg for adults.41 Regulatory agencies such as the United States Department of Agriculture - Foreign Agricultural Service (USDA FAS) establish a maximum limit of 0.5 mg kg-1 for total chromium in vegetables due to its potential toxicity at high concentrations.42 The toxicity of CrIII varies according to the ligand in its complex, influencing its cellular permeability and cytotoxic effects and the literature reports that exposures of human dermal fibroblasts to concentrations of up to 100 µM of CrIII and 250 ppm in macrophages (U937) can induce cytotoxic effects after 72 h of contact.41,43 In the treated material, the reduction of more than 97%, in the chromium content ensures that the residual level remains below the concentrations considered cytotoxic in biological systems.41,43,44 Doing a comparison between the results in the present study and the literature data, it is possible to affirm that the material performed is safety. Each film plate has 0.75 g of collagen and 10.0 µmol of residual CrIII. Converting the data in ration body mass and CrIII, the ration is 8.75 μg kg-1, considering a human with 60 kg, a ration lower than the maximum limit established by USDA-FAS.42

Energy dispersive X-ray spectroscopy (EDS) for samples: (a) tanned leather shavings (TLS); (b) collagen substrate obtained after treatment.
Scanning electron microscopy revealed that the TLS had a microfiber structure before Cr leaching. However, after treatments, the material lost its physical integrity and assumed an amorphous characteristic. These changes in the leather structure can be attributed to tanning agents action, since CrIII covalently binds to the carboxylic groups of collagen, altering the structure of the microfiber.6,45
The breakdown of chromium-collagen during the oxidation route is promoted by a series of consecutive reactions. Initially, the addition of CaO raises the pH of the TLS aqueous mixture, affecting the electronic stability of the complex formed between chromium and collagen in leather, leading to breakdown of chromium-collagen bond by attacking hydroxyl ions (OH-) in solution.40 Then, the attack of SO42- and forming of 2Cr(OH)SO4 occurs.
The dechroming process continues with addition of hydrogen peroxide, which oxidizes Cr3+ to Cr6+, forming the chromate ion. The final step includes the previously mentioned baths, which are responsible for increasing the percentage of Na and Cl, as observed in the EDS spectra (Figure 1).
Characterization of collagen treatments by Fourier transform infrared spectrometry
After oxidation process, the characteristic hydrolyzed collagen bands were maintained (Figure 2a). In the highest frequency region, bands were identified at 3402 cm-1, referring to amide A (NH stretching coupled with hydrogen bonding), and at 3244 cm-1, referring to amide B (stretching vibration of CH2 and absorption due to the CH2 alkyl chain).46 All spectra shown bands among 1620-1631 cm-1, which attributed to the vibrational stretching of the C=O of amide I.46 In addition, bands referring to CN and NH stretching in the amide bond flexion plane, corresponding to amides II and III, were observed at region range 1440 to 1460 cm-1 and 1240 cm-1, respectively.22

(a) FTIR (ATR) spectra of TLS and treatments: oxidation with 3 and 30% of H2O2 for 18 h; (b) FTIR (ATR) spectra of (HC) with developed film (HC/PVA/Gly) and its formulations containing HMEC at 1% (HC/PVA/Gly/HMEC1), 3% (HC/PVA/Gly/HMEC3) and 5% (HC/PVA/Gly/HMEC5).
The appearance of a band in the region of angular deformation at 921 cm-1, referring to the -OH of carboxylic acids in treatments, proves the effectiveness of the methods in removing chromium, due to hydroxyls of aspartic acid and glutamic acid being sites of complex formation.6,45 The spectra of the oxidation treatment showed greater intensity in regions of amides and carboxylic acids, as well as an intense band at 1130 cm-1 corresponding to CO stretching and an angular deformation of aromatic HC at 676 cm-1. In this way, it was possible to indicate that the existing interactions or bonds with chromium were broken during the waste treatment process.
The literature indicates that FTIR spectroscopy can also be used to monitor the integrity from triple helix of collagen structure.47 Thus, a ratio between absorbances 1235 cm-1/1450 cm-1 was used to indicate the integrity of the tertiary collagen structure. Values close to 1 indicate that the triple helix structure of collagen exists and maintains intermolecular interactions. In the present work, the ratios for collagen obtained in oxidation treatment with H2O2 at 30%, at 3% and TLS were, respectively, 0.9460, 0.9613 and 0.9970. The lower value for oxidation with 30% peroxide is justified due to high denaturing action of peroxide on the collagen structure. Therefore, in view the profile of FTIR spectra from residue and treated material, the chromium removing rate and final yield, the chosen method to the next steps in film formulation was the treatment with 30% H2O2 during 18 h.
UV-Vis spectroscopy of hydrolyzed collagen
The HC exhibited λmax at 220 nm (Figure 3) related to collagen triple helix similar to reported in the literature (λmax 210-240 nm).48 UV-Vis absorption in this region may be related to -COOH and CONH2 groups in polypeptide chains and n→π* C=O transitions in peptide bonds.49 In addition, as shown in Figure 3, a low-intensity band at 280 nm can be also identified, suggesting the presence of aromatic amino acids released during treatment by oxidation and/or hydrolysis, such as phenylalanine (λmax 250-270 nm), tyrosine (λmax 270-290 nm) and tryptophan (λmax 280 300 nm).48

In vitro hydrolyzed collagen potentials
According to Table 2, HC showed no antioxidant activity in both methods used and no significant antibacterial activity. These results were expected, once which, as reported,50 collagen has no intrinsic antioxidant or antibacterial activity. Therefore, to confer such biological properties, treatments such as chemical or enzymatic hydrolysis are necessary, obtaining peptides with biological activity.50-53
Antioxidant properties and antimicrobial activity of HMEC and components in film formulation
HMEC characterization
HMEC chemical characterization and in vitro potentials
In phytochemical screening were confirmed the presence of several phytochemical classes, including alkaloids, anthocyanins, phenolic compounds, coumarins, anthracene derivatives, lignans, monoterpenes, sesquiterpenes, diterpenes, naphtoquinones, saponins, condensed tannins, triterpenes, and steroids. In view the high positivity for phenolic compounds, assays to determine total content of phenolic compounds and flavonoids were carried out.
HMCE presented a content of 396.636 ± 8.64 mg EAG g-1 of total phenolic compounds and 296.210 ± 5.35 mg EC g-1 of flavonoids (Table 2). The phytochemical analysis demonstrates a wide diversity of secondary metabolites, with a predominance of phenolic substances, 17.51 with flavonoids corresponding to 74.683% of the total. The LC-ESI-Q-TOF-MS analysis allowed to identifier different flavonoids (Table 3), including fustin (Figure 4, peak 3), 3’,4’,7-trihydroxyflavone (Figure 4, peak 8), rutin (Figure 4, peak 5), isokaempferide (Figure 4, peak 10), kaempferol-7-O-neohesperidoside (Figure 4, peak 11), liquiritigenin (Figure 4, peak 9), myricitrin (Figure 4, peak 4), quercetin-3-O-galactoside (Figure 4, peak 6), and quercitrin (Figure 4, peak 7), in addition to other compounds such as quinic acid (Figure 4, peak 1) and a 2-[[5-(4-hydroxy-3,5-dimethoxyphenyl)-6,7-bis(hydroxymethyl)-1,3 dimethoxy-5,6,7,8 tetrahydronaphthalen-2-yl]oxy]-6 (hydroxymethyl)oxane-3,4,5-triol (Figure 4, peak 2). Among these, the presence of fustin 3’,4’,7-trihydroxyflavone and quinic acid, quercetin-3 O-galactoside already described in species of the same family, as well as the occurrence of quercitrin, previously reported in H. martiana itself are highlighted.54-57 Mass spectra were acquired in negative mode, generating the deprotonated ion [M - H]-. The results are summarized in Table 3, including retention time (tR), mass accuracy error, and fragment ions for each peak. MS2 experiments were used to characterize and confirm the structures of the indicated compounds.

LC-ESI-Q-TOF-MS chromatogram of the analyzed extract showing the flavonoid and phenolic compounds identified, (1) quinic acid; (2) 2-[[5-(4-hydroxy-3,5-dimethoxyphenyl)-6,7-bis(hydroxymethyl)-1,3-dimethoxy-5,6,7,8-tetrahydronaphthalen -2-yl]oxy]-6-(hydroxymethyl)oxane-3,4,5 triol; (3) fustin; (4) myricitrin; (5) rutin; (6) quercetin-3-O-galactoside; (7) quercetrin; (8) 3’,4’,7-trihydroxyflavone; (9) liquiritigenin; (10) isokaempferide; (11) kaempferol-7-O-neohesperidoside.
Beyond phenolic compounds and flavonoids, that have antioxidant, anti-inflammatory, antimicrobial, cytotoxic, antitumor and photoprotective activity, H. martiana also produces in its barks and stems the pinitol, a cyclitol, with anti-inflammatory and antibacterial activity, reported recently which makes this species an excellent candidate to produce films for medicinal use.58,59
The use of antioxidant compounds in the development of biomaterials for wound healing is a constantly growing area of research.60 Studies61,62 demonstrate that antioxidants can convert reactive oxygen species (ROS) into more stable molecules, and in wound tissues, this action allows antioxidants to maintain non-toxic levels of ROS, contributing to more fast-healing process. In contrast to collagen, PVA and Gly, HMEC exhibited strong antioxidant activity showing a IC50 of 10.601 µg mL-1 and 67.96% of peroxidation inhibition in DPPH and β-carotene assays, respectively, (Table 2), turning it a promissory candidate to healing materials.
Phenolic compounds have a capacity to scavenging free radicals, donating electrons, hydrogen atoms or chelating metal ions, and the high content in HMEC, explain the significant antioxidant capacity found.62-64
HMEC showed antibacterial activity against strains of S. aureus, including methicillin-resistant strains (MRSA), showing a MIC of 3.125 and 6.25 mg mL-1 for the reference and MRSA strains, respectively, and a MBC of 12.50 mg mL-1 for both strains. One more time, the results found can be explained by significant presence of phenolic compounds and pinitol, once that compounds have many mechanisms of action against bacteria, including inhibition of bacterial virulence factors (enzymes and toxins), interacting with cytoplasmic membrane, and also the ability to suppress biofilm formation and exert a synergistic effect with antibiotics.65,66 H. martiana Hayne is known for antibacterial activity, and in another study,18 its potential was observed also for its leaves against S. aureus and S. epidermidis.
Films characterization
In this study, four film formulations were developed, where the first, containing only HC/PVA/Gly was used as control and three others containing extract incorporated at concentrations of 1% (HC/PVA/Gly/HMEC1), 3% (HC/PVA/Gly/HMEC3) and 5% (HC/PVA/Gly/HMEC5) (Figure 5a). For characterization, all materials were submitted to SEM, thickness, solubility, opacity, tensile strength (TS), breaking deformation (BD) swelling, vapor retention, FTIR and DSC assays.

(a) Collagen-based films incorporated with ethanol extract of H. martiana. SEM images for samples: (b) TLS; (c) collagen obtained by 30% oxidation treatment for 18 h; (d) HC; (e) HC/PVA/Gly; (f) HC/PVA/Gly/HMEC1; (g) HC/PVA/Gly/HMEC3; (h) HC/PVA/Gly/HMEC5.
In the present study, the morphology of the material was evaluated by SEM images (Figure 5). The surface of the HC/PVA/Gly (Figure 5e) showed uniform properties and good film formation. However, the films containing HMEC exhibited greater roughness and cracks on their surface compared to the control film (Figures 5f to 5h). The presence of cracks on the film surfaces was observed, and this heterogeneity can be attributed to the distribution of the extract within the polymer matrix.74
The films thickness ranged among 0.273 and 0.319 mm (Figure 6A), without significant differences (p < 0.05) among the groups with and without HMEC.

Films mechanical and physical properties (a) HC/PVA/Gly; (b) HC/PVA/Gly/HMEC1; (c) HC/PVA/Gly/HMEC3; (d) HC/PVA/Gly/HMEC5; equal symbols on the same graph indicate no statistical difference (p < 0.05) according to ANOVA (followed by Tukey’s multiple comparison test). (A Thickness; (B) opacity; (C) solubility; (D) deformation at break; (E) tensile strength; (F) vapor retention tests.
Opacity is an essential property in food coating or packaging films, as it directly influences the appearance and color of the material.75Figure 6B shows the opacity values of HC films with different extract concentrations. The HC/PVA/Gly and HC/PVA/Gly/HMEC5 films presented the highest opacity values, 0.870 ± 0.0436 and 0.887 ± 0.0348, respectively, with no significant difference between them (p < 0.05). Moreover, the films were also less transparent compared to pure gelatin films (Y = 0.2-0.8).76
The high opacity of HC/PVA/Gly film can be attributed to its compacted structure, which limits the light passage. Considering that opacity is related to film characteristics such as thickness, color and state of the matrix.77 Other factors such as degree of hydrolysis of the matrix components can influence light permeability.78
The films exhibited partial solubility in water, ranging from 75.40 to 87.46%. This property allows them to act as alternative release systems capable of increasing the therapeutic index of bioactive compounds.79 The incorporation of higher amounts of extracts enriches the film matrix with phenols and hydrophilic compounds, such as sucrose, which consequently increases the solubility of the material (Figure 6C).25 Furthermore, previous analyses demonstrated that the treated material presents a residual chromium content below the cytotoxic limits reported for biological systems, indicating that the films do not release toxic substances during contact with the organism.41,43,44 During the treatment process, hexavalent chromium is reduced to its trivalent state (Cr3+), which exhibits lower skin permeability, and a limited capacity to cross cell membranes, thereby reducing potential cytotoxic effects.41
Although collagen is widely used in film formation due to its ability to form networks, its standalone mechanical properties remain limited.80 To overcome these limitations, the addition of PVA as a cross-linking agent has proven to be an effective strategy.81 PVA, a biodegradable polymer with a high concentration of hydroxyl groups, forms hydrogen bonds with the amino acids in collagen, creating a denser and stronger network.50 These bonds increase both tensile strength and elongation capacity, expanding the applicability of the materials.81-83 In addition to hydrogen bonds, other cross-linking mechanisms, such as covalent bonds and physical entanglement, also significantly contribute to the enhancement of the mechanical properties of collagen-PVA composites.80
In this context, the mechanical properties of the materials were evaluated by measuring TS and BD, as illustrated in Figures 6d and 6e. TS values ranged from 3833 to 4570 mPa, with no significant differences between them, indicating that the materials are suitable for potential wound treatment applications.84 However, the introduction of plant extracts into the materials provided additional improvements, especially with increasing concentrations of the extracts. Such improvements result from intermolecular interactions, such as hydrogen bonds between the hydroxyl groups of phenolic compounds and collagen chains or cross-linking agents. For example, fish gelatin films exhibited a TS of 7.65 MPa; after the addition of mango peel extract at concentrations of 3 and 5%, TS values increased significantly, reaching up to 15.78 MPa.34
Water uptake is an essential characteristic in materials aimed at wound healing, as observed by Rezaii et al.85 This property plays an important role in facilitating cell penetration and the transportation of metabolic products and nutrients to the affected area.86 The degree of swelling (Table 4) of the HC/PVA/Gly film ranged from 23.550 to 209.309%, depending on the pH, after immersion in saline solution. With addition of extract, the degree of swelling increased in all formulations, ranging between 70.350 and 296.217% for HC/PVA/Gly/HMEC5 and between 76.281 and 516.032% for HC/PVA/Gly/HMEC1. HC/PVA/Gly/HMEC3 showed the highest degree of swelling (637.487% ± 33.140, at pH 8).
When analyzing the influence of pH on swelling rate, a progressive increase was observed with pH increasing. This result is related to the presence of amino and carboxyl groups, which give HC an amphoteric character. pH 4.9 is the isoelectric point of collagen leading to matrix collapse and resulting in the lowest swelling rate at pH 5. At pH 7, different of the isoelectric point, the degree of ionization increases, enhancing absorption of liquid by the membrane.87
Materials that retain moisture reduce the need to replace dressings, facilitating removal and reducing scar formation.35 In the present study, a decrease in moisture was observed in all samples, mainly to control film, where the retain moisture was lost after 10 h of experiment. On the order hand, the film containing 3% HMEC3 showed an interesting capacity to maintain the moisture in a minimum of 70% (Figure 6F).
FTIR studies showed that HC sample continued to show characteristic collagen bands (Figure 2b) at 3028, 1635, 1544 and 1242 cm-1, referring to amide B (asymmetrical elongation of -CH2), amide I (C=O axial deformation), amide II and amide III, which represent NH bending coupled with CN stretching vibration.88 In films spectra (Figure 2b), a great reduction in intensity of bands referring to amide groups A, I and II was observed. Moreover, the appearance of an intensity around 3300 cm -1, related to -OH, and at 1050 cm-1, referring to C-O of alcohols, indicating the occurrence of physical crosslinking among hydroxyl groups of glycerol and PVA with amides of hydrolyzed collagen.89
The DSC technique is widely used to determine the thermal transition of materials, and, in this report, it was used to analyze the melting temperature (Tm) and enthalpy (∆H) of films (Figure 7). The HC/PVA/Gly film presented a Tm of 134.04 °C, a lower value than that demonstrated by Masilamani et al.,22 who produced a similar matrix composed of PVA, glycerol, glutaraldehyde and gelatin, and obtained a Tm of 207 °C. This difference may be related to the degree of crosslinking of collagen-based materials and the presence of glutaraldehyde. The present formulations containing HMEC showed Tm of 128.09, 132.04 and 131.58 °C for HC/PVA/Gly/HMEC3, HC/PVA/Gly/HMEC1 and HC/PVA/Gly/HMEC5, respectively. Although the melting temperatures did not change significantly, there was a reduction in the energy required to melt the films (Figure 7), indicating that the extract disturbed the matrix organization. When considering the FTIR spectra (Figure 2b), thermograms (Figure 7) and the results of mechanical properties (Figure 6D), it was observed that the extract present in the films did not establish relevant interactions or cause marked disturbances in the organization of the polymeric matrix. However, as the extract concentration increased, the interactions were strengthened, requiring more heat and force to melt and to break the films. And all these thermal properties turning the developed formulations very promisors to application in wound healing.

Conclusions
The films showed high solubility, water absorption capacity, moisture retention and mechanical properties, such as high elasticity and tensile strength, making them suitable for application in dressings. The incorporation of the crude ethanolic extract of H. martiana added bioactive potential to the materials due its chemical composition.
In resume, this report highlights the potential of tanned leather shavings as a source for collagen and development of high-performance materials, contributing to reduction of environmental impacts caused by the generation of solid waste in tanning industry. In addition, it promotes advances in the field of biodegradable and sustainable materials, encouraging the recovery of waste and the search for eco-friendly solutions. Future research can further explore the potential of these films for clinical and pharmaceutical applications, driving innovation and development of more effective and environmentally responsible therapies.
Acknowledgments
The authors would like to thank CAPES and FACEPE for financial support, and to CAFMA-UNIVASF, IFSertaoPE, LEIMO laboratory and UFPB for all experimental contributions. The present article was funded by the research funding institutions CAPES and FACEPE, which granted a scholarship to the author Guilherme U. M. Novaes, under process No. (88887.615981/2021-00). This work was supported by Foundation for the Support of Science and Technology of Pernambuco - FACEPE, processes - PBPG-0016-4.03/21, PBPG-2145-4.03/22 and APQ-0805-1.06/21.
Supplementary Information
Supplementary information contains the mass spectra (MS and MS/MS) used to confirm the annotation of the eleven compounds and is available free of charge at http://jbcs.sbq.org.br as file.
Data Availability Statement
All data are available in the text.
References
-
1 Jia, X.; Zhang, C.; Ali Chattha, S.; Peng, B.; J. Cleaner Prod. 2020, 244, 118706. [Crossref]
» Crossref -
2 Quaratesi, I.; Bruno, I.; Pauciulo, A.; Bartiromo, A. R.; Badea, E.; Carşote, C.; Neri, P.; Talotta, C.; Gliubizzi, R.; Di Tullio, V.; Proietti, N.; Cepparrone, A.; Nuti, F.; Ferrara, V.; Gaeta, C.; Polym. Test. 2023, 129, 108268. [Crossref]
» Crossref -
3 Jiang, H.; Liu, J.; Han, W.; Waste Manage. Res. 2016, 34, 399. [Crossref] [PubMed]
» Crossref» PubMed -
4 Parisi, M.; Nanni, A.; Colonna, M.; Polymers 2021, 13, 429. [Crossref]
» Crossref -
5 China, C. R.; Maguta, M. M.; Nyandoro, S. S.; Hilonga, A.; Kanth, S. V.; Njau, K. N.; Chemosphere 2020, 254, 126804. [Crossref] [PubMed]
» Crossref» PubMed -
6 Nickens, K. P.; Patierno, S. R.; Ceryak, S.; Chem.-Biol. Interact. 2010, 188, 276. [Crossref] [PubMed]
» Crossref» PubMed -
7 Irastorza, A.; Zarandona, I.; Andonegi, M.; Guerrero, P.; de la Caba, K.; Food Hydrocolloids 2021, 116, 106633. [Crossref]
» Crossref -
8 Tang, C.; Zhou, K.; Zhu, Y.; Zhang, W.; Xie, Y.; Wang, Z.; Zhou, H.; Yang, T.; Zhang, Q.; Xu, B.; Food Hydrocolloids 2022, 131, 107748. [Crossref]
» Crossref -
9 Alam, M. R.; Shahid, M. A.; Alimuzzaman, S.; Khan, A. N.; Biomedi. Eng. Adv. 2022, 4, 100064. [Crossref]
» Crossref -
10 Leng, Q. Q.; Li, Y.; Pang, X. L.; Wang, B. Q.; Wu, Z. X.; Lu, Y.; Xiong, K.; Zhao, L.; Zhou, P.; Fu, S. Z.; Drug Delivery 2020, 27, 1676. [Crossref] [PubMed]
» Crossref» PubMed -
11 Gajbhiye, S.; Wairkar, S.; Biomaterials Adv. 2022, 142, 213152. [Crossref]
» Crossref -
12 Rathod, L.; Bhowmick, S.; Patel, P.; Sawant, K.; J. Drug Delivery Sci. Technol. 2022, 72, 103363. [Crossref]
» Crossref -
13 Gazzaneo, L. R. S.; De Lucena, R. F. P.; de Albuquerque, U. P.; J. Ethnobiol. Ethnomed. 2005, 1, 9. [Crossref]
» Crossref -
14 Marsaioli, A. J.; Leitao-Filho, H. F.; Campello, J. P.; Phytochemistry 1975, 14, 1882. [Crossref]
» Crossref -
15 Agra, M. F.; de Freitas, P. F.; Barbosa-Filho, J. M.; Rev. Bras. Farmacogn. 2007, 17, 114. [Crossref]
» Crossref -
16 Oliveira, F. G. S.; de Lima-Saraiva, S. R. G.; Oliveira, A. P.; Rabelo, S. V.; Rolim, L. A.; Almeida, J. R. G. S.; Pharmacognosy Res. 2016, 8, 270. [Crossref]
» Crossref -
17 Neves, M. C. A.; Neves, P. C. A.; Zanini Jr., J. C.; Medeiros, Y. S.; Yunes, R. A.; Calixto, J. B.; Phytotherapy Res. 1993, 7, 356. [Crossref]
» Crossref -
18 Silva, M. S.; Leite, K. R. B.; Saba, M. D.; Rev. Bras. Plantas Med. 2012, 14, 673. [Crossref]
» Crossref -
19 Vieira, D. S.; Peixoto, R. M.; Costa, M. M.; Freire, D. P.; Silva, T. M. G.; Silva, T. M. S.; Pesq. Vet. Bras. 2018, 38, 462. [Crossref]
» Crossref - 20 NBR ISO5398-1: Leather - Chemical Determination of Chromic Oxide Content - Part 1: Quantification by Titration, ISO, 2014.
-
21 Balarim, N. G.; Cavalcante, D. G. S. M.; Gomes, A. S.; Cabrera, F. C.; Job, A. E.; Mater. Sci. Forum, 2018, 930, 535. [Crossref]
» Crossref -
22 Masilamani, D.; Srinivasan, V.; Ramachandran, R. K.; Gopinath, A.; Madhan, B.; Saravanan, P.; J. Cleaner Prod. 2017, 164, 885. [Crossref]
» Crossref -
23 Duan, R.; Zhang, J.; Du, X.; Yao, X.; Konno, K.; Food Chem. 2009, 112, 702. [Crossref]
» Crossref - 24 Vogel, A. I.; Química Analítica Qualitativa, 6th ed.; LTC: Rio de Janeiro, 2002, p. 363-367.
-
25 Silva, J. M. S.; Rolim, L. A.; Almeida, J. R. G. S.; Feitosa, T. A.; Nery, D. A.; Araújo, C. S.; de Oliveira, A. P.; Phytochem. Lett. 2024, 61, 158. [Crossref]
» Crossref -
26 Slinkard, K.; Singleton, V. L.; Am. J. Enol. Vitic. 1977, 28, 49 LP. [Crossref]
» Crossref -
27 Marques, G. S.; Monteiro, R. P. M.; Leão, W. F.; Lyra, M. A. M.; Peixoto, M. S.; Rolim-Neto, P. J.; Xavier, H. S.; Soares, L. A. L.; Quim. Nova 2012, 35, 517. [Crossref]
» Crossref -
28 Macêdo, N. S.; Silveira, Z. S.; Dantas, D. M.; Barbosa, C. R. S.; dos Santos, A. T. L.; Brito, T. A. M.; Tavares, J. F.; Leite, D. O. D.; Alexandre, P. R. F.; da Costa, J. G. M.; Oliveira Tintino, C. D. M.; Coutinho, H. D. M.; Morais-Braga, M. F. B.; da Cunha, F. A. B.; Food Chem. Toxicol. 2025, 197, 115305. [Crossref] [PubMed]
» Crossref» PubMed -
29 Mensor, L. L.; Menezes, F. S.; Leitão, G. G.; Reis, A. S.; dos Santos, T. C.; Coube, C. S.; Leitão, S. G.; Phytother. Res. 2001, 130, 127. [Crossref]
» Crossref -
30 Aidi Wannes, W.; Mhamdi, B.; Sriti, J.; Ben Jemia, M.; Ouchikh, O.; Hamdaoui, G.; Kchouk, M. E.; Marzouk, B.; Food Chem. Toxicol. 2010, 48, 1362. [Crossref]
» Crossref -
31 Santos, T. G.; Rebelo, R. A.; Dalmarco, E. M.; Guedes, A.; de Gasper, A. L.; Cruz, A. B.; Schmit, A. P.; Cruz, R. C. B.; Steindel, M.; Nunes, R. K.; Quim. Nova 2012, 35, 477. [Crossref]
» Crossref - 32 Clinical and Laboratory Standards Institute (CLSI); Methods for Dilution Antimicrobial Susceptibility Tests for Bacteria That Grow Aerobically, 12th ed.; CLSI, 2024.
- 33 Wagner, H.; Bladt, S.; Plant Drug Analysis: A Thin Layer Chromatography Atlas; Springer Science & Business Media: Berlin, 1996.
-
34 Adilah, A. N.; Jamilah, B.; Noranizan, M. A.; Hanani, Z. A. N.; Food Packag. Shelf Life 2018, 16, 1. [Crossref]
» Crossref -
35 Lin, Z.; Wu, T.; Wang, W.; Li, B.; Wang, M.; Chen, L.; Xia, H.; Zhang, T.; Int. J. Biol. Macromol. 2019, 140, 330. [Crossref] [PubMed]
» Crossref» PubMed -
36 Liang, D.; Lu, Z.; Yang, H.; Gao, J.; Chen, R.; ACS Appl. Mater. Interfaces 2016, 8, 3958. [Crossref] [PubMed]
» Crossref» PubMed -
37 Siripatrawan, U.; Harte, B. R.; Food Hydrocolloids 2010, 24, 770. [Crossref]
» Crossref -
38 Zhang, Y.; Chen, Z.; Liu, X.; Shi, J.; Chen, H.; Gong, Y.; J. Culture Heritage 2020, 48, 205. [Crossref]
» Crossref -
39 Nigam, H.; Das, M.; Chauhan, S.; Pandey, P.; Swati, P.; Yadav, M.; Tiwari, A.; Adv. Appl. Sci. Res. 2015, 6, 129. [Link] accessed in January 2026
» Link -
40 Malek, A.; Hachemi, M.; Didier, V.; J. Hazard Mater. 2009, 170, 156. [Crossref] [PubMed]
» Crossref» PubMed -
41 Levina, A.; Lay, P. A.; Chem. Res. Toxicol. 2008, 21, 563. [Crossref] [PubMed]
» Crossref» PubMed -
42 Reis, G. A.; Martins, M. V. A.; Santos, L. M. G.; Vicentine Neto, S. A.; Barbosa Jr., F. B.; Geraldes, M. C.; Bergamaschi, S.; Figueira, R. C. L.; Patinha, C.; da Silva, E. F.; Rocha, F.; Arch. Environ. Contam. Toxicol. 2025, 89, 195. [Crossref] [PubMed]
» Crossref» PubMed -
43 Shrivastava, H. Y.; Ravikumar, T.; Shanmugasundaram, N.; Babu, M.; Nair, B. U.; Free Radical Biol. Med. 2005, 38, 58. [Crossref]
» Crossref -
44 Wang, Y.; Su, H.; Gu, Y.; Song, X.; Zhao, J.; Onco Targets Ther. 2017, 10, 4065. [Crossref]
» Crossref -
45 Wang, L.; Chen, M.; Li, J.; Jin, Y.; Zhang, Y.; Wang, Y.; Waste Manage. 2020, 103, 276. [Crossref]
» Crossref -
46 Schmidt, M. M.; da Fontoura, A. M.; Vidal, A. R.; Dornelles, R. C. P.; Kubota, E. H.; Mello, R. O.; Cansian, R. L.; Demiate, I. M.; de Oliveira, C. S.; Food Sci. Technol. 2020, 40, 355. [Crossref]
» Crossref -
47 Tonhi, E.; Plepis, A. M. G.; Quim. Nova 2002, 25, 943. [Crossref]
» Crossref -
48 Chinh, N. T.; Manh, V. Q.; Trung, V. Q.; Lam, T. D.; Huynh, M. D.; Tung, N. Q.; Trinh, N. D.; Hoang, T.; Nat. Prod. Commun. 2019, 14 [Crossref]
» Crossref -
49 Coscueta, E. R.; Brassesco, M. E.; Pintado, M.; Preprints 2021 [Crossref]
» Crossref -
50 Ahmed, M.; Verma, A. K.; Patel, R.; Sustainable Chem. Pharm. 2020, 18, 100315. [Crossref]
» Crossref -
51 Wisuthiphaet, N.; Kongruang, S.; Chamcheun, C.; J. Med. Bioeng 2015, 4 [Crossref]
» Crossref -
52 Pal, G. K.; Suresh, P. V.; Innovative Food Sci. Emerging Technol. 2016, 37, 201. [Crossref]
» Crossref -
53 Chen, Y. P.; Liang, C. H.; Wu, H. T.; Pang, H. Y.; Chen, C.; Wang, G. H.; Chan, L. P.; J. Food Sci. Technol. 2018, 55, 2310. [Crossref]
» Crossref -
54 da Costa, M. P.; Bozinis, M. C. V.; Andrade, W. M.; Costa, C. R.; da Silva, A. L.; Alves de Oliveira, C. M.; Kato, L.; Fernandes, O. F. L.; Souza, L. K. H.; Silva, M. R. R.; BMC Complementary Altern. Med. 2014, 14, 245. [Crossref] [PubMed]
» Crossref» PubMed -
55 Tenório, C. J. L.; Silva, S. L.; e Silva, J. P. R.; Tavares, J. F.; Ferreira, M. R. A.; Soares, L. A. L.; Rev. Bras. Farmacogn. 2022, 32, 365. [Crossref]
» Crossref -
56 Del Angelo, G. L.; de Oliveira, I. S.; de Albuquerque, B. R.; Kagueyama, S. S.; Vieira da Silva, T. B.; dos Santos Filho, J. R.; Dias, M. I.; Pereira, C.; Calhelha, R. C.; Alves, M. J.; Ferrari, A.; Yamaguchi, N. U.; Ferreira Zielinski, A. A.; Bracht, A.; Peralta, R. M.; Corrêa, R. C. G.; Plants 2024, 13, 3207. [Crossref]
» Crossref -
57 Pacheco, A. G. M.; Branco, A.; Câmara, C. A.; Silva, T. M. S.; Silva, T. M. G.; de Oliveira, A. P.; Santos, A. D. C.; Dutra, L. M.; Rolim, L. A.; de Oliveira, G. G.; Mendonça, J. N.; Lopes, N. P.; Almeida, J. R. G. S.; Nat. Prod. Res. 2021, 35, 2414. [Crossref] [PubMed]
» Crossref» PubMed -
58 Hanganu, D.; Olah, N.-K.; Benedec, D.; Mocan, A.; Crisan, G.; Vlase, L.; Popica, I.; Oniga, I.; Pak. J. Pharm. Sci., 2016, 29, 301. [Link] accessed in January 2026
» Link -
59 Panche, A. N.; Diwan, A. D.; Chandra, S. R.; J. Nutr. Sci. 2016, 5, e47. [Crossref] [PubMed]
» Crossref» PubMed -
60 Fitzmaurice, S. D.; Sivamani, R. K.; Isseroff, R. R.; Skin Pharmacol. Physiol. 2011, 24, 113. [Crossref]
» Crossref -
61 Comino-Sanz, I. M.; López-Franco, M. D.; Castro, B.; Pancorbo-Hidalgo, P. L.; J. Clin. Med. 2021, 10, 3558. [Crossref] [PubMed]
» Crossref» PubMed -
62 Dunnill, C.; Patton, T.; Brennan, J.; Barrett, J.; Dryden, M.; Cooke, J.; Leaper, D.; Georgopoulos, N. T.; Int. Wound J. 2017, 14, 89. [Crossref]
» Crossref -
63 Parcheta, M.; Świsłocka, R.; Orzechowska, S.; Akimowicz, M.; Choińska, R.; Lewandowski, W.; Materials 2021, 14, 1984. [Crossref]
» Crossref -
64 Simunkova, M.; Barbierikova, Z.; Jomova, K.; Hudecova, L.; Lauro, P.; Alwasel, S. H.; Alhazza, I.; Rhodes, C. J.; Valko, M.; Int. J. Mol. Sci. 2021, 22, 1619. [Crossref]
» Crossref -
65 Miklasińska-Majdanik, M.; Kępa, M.; Wojtyczka, R. D.; Idzik, D.; Wąsik, T. J.; Int. J. Environ. Res. Public Health 2018, 15, 2321. [Crossref] [PubMed]
» Crossref» PubMed -
66 Pereira, D. M.; Valentão, P.; Pereira, J. A.; Andrade, P. B.; Molecules 2009, 14, 2202. [Crossref]
» Crossref -
67 Ye, M.; Yang, W. Z.; Liu, K. Di; Qiao, X.; Li, B. J.; Cheng, J.; Feng, J.; Guo, D. A.; Zhao, Y. Y.; J. Pharm. Anal. 2012, 2, 35. [Crossref]
» Crossref -
68 Li, J.; Jiang, K.; Wang, L. J.; Yin, G.; Wang, J.; Wang, Y.; Jin, Y. B.; Li, Q.; Wang, T. J.; J. Sep. Sci. 2018, 41, 1752. [Crossref] [PubMed]
» Crossref» PubMed -
69 de Senes-Lopes, T. F.; da Luz, J. R. D.; Guterres, Z. R.; Barbosa, E. A.; Batista, D.; Galdino, O. A.; Ururahy, M. A. G.; Gomes dos Santos, E. C.; López, J. A.; Araujo-Silva, G.; Almeida, M. G.; Metabolites 2023, 13, 748. [Crossref]
» Crossref -
70 Hering, A.; Stefanowicz-Hajduk, J.; Hałasa, R.; Olech, M.; Nowak, R.; Kosiński, P.; Ochocka, J. R.; Molecules 2022, 27, 6181. [Crossref] [PubMed]
» Crossref» PubMed -
71 El Sayed, A. M.; El-Abd, E. A. W.; Afifi, A. H.; Hashim, F. A.; Kutkat, O.; Ali, M. A.; El Raey, M. A.; El Hawary, S. S.; Heliyon 2024, 10, e32335. [Crossref]
» Crossref -
72 Wang, Y.; Fan, Y.; Deng, Z.; Wu, W.; Liu, J.; Wang, H.; Rev. Bras. Farmacogn. 2021, 31, 102. [Crossref]
» Crossref -
73 Maharaj, V.; Ezeofor, C. C.; Naidoo Maharaj, D.; Muller, C. J. F.; Obonye, N. J.; Molecules 2022, 27, 8095. [Crossref]
» Crossref -
74 Bitencourt, C. M.; Fávaro-Trindade, C. S.; Sobral, P. J. A.; Carvalho, R. A.; Food Hydrocolloids 2014, 40, 145. [Crossref]
» Crossref -
75 Fadini, A. L.; Rocha, F. S.; Alvim, I. D.; Sadahira, M. S.; Queiroz, M. B.; Alves, R. M. V.; Silva, L. B.; Food Hydrocolloids 2013, 30, 625. [Crossref]
» Crossref -
76 Vanin, F. M.; Sobral, P. J. A.; Menegalli, F. C.; Carvalho, R. A.; Habitante, A. M. Q. B.; Food Hydrocolloids 2005, 19, 899. [Crossref]
» Crossref -
77 Wang, W.; Liu, Y.; Liu, A.; Xiao, J.; Wang, K.; Zhao, Y.; Zhang, S.; Zhang, L.; Int. J. Food Prop. 2017, 20, 968. [Crossref]
» Crossref -
78 Maria, T. M. C.; de Carvalho, R. A.; Sobral, P. J. A.; Habitante, A. M. B. Q.; Solorza-Feria, J.; J. Food Eng. 2008, 87, 191. [Crossref]
» Crossref -
79 Nunes, P. S.; Albuquerque-Júnior, R. L. C.; Cavalcante, D. R. R.; Dantas, M. D. M.; Cardoso, J. C.; Bezerra, M. S.; Souza, J. C. C.; Serafini, M. R.; Quitans-Jr., L. J.; Bonjardim, L. R.; Araújo, A. A. S.; J. Biomed. Biotechnol. 2011, 2011, 761593. [Crossref]
» Crossref -
80 Zhu, K.; Yu, Z.; Li, J.; Chiou, B. Sen; Chen, M.; Zhong, F.; Liu, F.; Food Hydrocolloids 2024, 150, 109676. [Crossref]
» Crossref -
81 Zulkiflee, I.; Fauzi, M. B.; Biomedicines 2021, 9, 979. [Crossref]
» Crossref -
82 Deshmukh, K.; Basheer Ahamed, M.; Deshmukh, R. R.; Khadheer Pasha, S. K.; Bhagat, P. R.; Chidambaram, K. In Biopolymer Composites in Electronics; Elsevier, 2017, p. 27. [Crossref]
» Crossref -
83 Limpan, N.; Prodpran, T.; Benjakul, S.; Prasarpran, S.; Food Hydrocolloids 2012, 29, 226. [Crossref]
» Crossref -
84 Reis, T. C.; Castleberry, S.; Rego, A. M. B.; Aguiar-Ricardo, A.; Hammond, P. T.; Biomater. Sci. 2016, 4, 319. [Crossref] [PubMed]
» Crossref» PubMed -
85 Rezaii, M.; Oryan, S.; Javeri, A.; Mater. Sci. Eng., C 2019, 98, 347. [Crossref] [PubMed]
» Crossref» PubMed -
86 Peter, M.; Ganesh, N.; Selvamurugan, N.; Nair, S. V.; Furuike, T.; Tamura, H.; Jayakumar, R.; Carbohydr. Polym. 2010, 80, 687. [Crossref]
» Crossref -
87 Ooi, S. Y.; Ahmad, I.; Cairul, M.; Mohd, I.; Ind. Crops Prod. 2015, 93, 227. [Crossref]
» Crossref -
88 He, L.; Mu, C.; Shi, J.; Zhang, Q.; Shi, B.; Lin, W.; Int. J. Biol. Macromol. 2011, 48, 354. [Crossref]
» Crossref -
89 Perkasa, D. P.; Erizal; Abbas, B.; Indonesian J. Chem. 2013, 13, 221. [Crossref]
» Crossref
Edited by
-
Editor handled this article:
Hector Henrique F. Koolen (Associate)