Raman Analysis of Natural Pigments During the Ripening Process in Different Types of Peppers
Abstract
In this work, Raman spectroscopy was employed to identify compounds present in different ripening stages of various exocarp varieties of peppers from the Solanaceae family, pink peppercorns (Anacardiceae), and black and white peppercorns (Piperaceae). In situ analysis of Solanaceae peppers revealed the characteristic bands of phenolic compounds, carotenoids, fatty acids, and alkaloids such as capsaicin. In the malagueta peppers, habanero, “biquinho”, and red karneval, a shift of the ν(C=C) stretching bands of carotenoids to lower wavenumbers and an increase in the band intensity were observed during ripening. In pink peppercorns, analyses of the peel and seeds at different ripening stages did not show significant changes. However, bands attributed to anthocyanins, such as pelargonidin, were observed, suggesting that these flavonoids are responsible for the color of the peel. Analyses of black and white peppercorns revealed characteristic bands mainly attributed to piperine. The assignment of Raman bands was proposed through comparison with literature data and spectra obtained by the Density Functional Theory (DFT) method. The sum of the theoretical spectra was used to simulate the spectral profile and the contribution of each substance in the experimental spectra.
Keywords:
Raman spectroscopy; plant pigments; peppers; carotenoids; flavonoids
Introduction
Natural pigments, such as flavonoids and carotenoids, play fundamental roles in nature, contributing to ecological and essential plant functions, such as photo-oxidation protection, sexual signaling, chemical defense, and as precursors of phytohormones.1,2 Structurally, these compounds present carbon chains with conjugated unsaturated bonds and highly polarizable π electron systems, making them excellent targets for analysis by Raman spectroscopy.3 This technique, based on the inelastic scattering of light, allows the characterization of their vibrational spectra, enabling the distinction of polyenes by the length of the conjugated chains and the identification of functional groups.4,5 Additionally, the non-destructive nature and speed of the analysis make Raman spectroscopy an ideal tool for studying these compounds in complex matrices and in situ.3,6
Peppers are appreciated worldwide for their varied and spicy flavors, being a fundamental ingredient in various cuisines. Besides adding flavor to dishes, peppers have a high nutritional value, being rich in bioactive compounds such as carotenoids, flavonoids, and alkaloids.7-9 These compounds confer upon peppers antioxidant and anti-inflammatory properties and have the potential to prevent diseases such as diabetes and heart problems.10-13
Peppers classified under the genus Capsicum, of the Solanaceae family, are native to tropical and humid zones of Central and South America.14 Capsicum is known for its five main domesticated species, C. annuum, C. baccatum, C. chinense, C. frutescens, and C. pubescens, each with their unique characteristics in terms of flavor, pungency, color, and metabolite profiles.14 The pungency or spiciness of peppers of this genus is due to the presence of capsaicinoids, among which the alkaloid capsaicin (Figure 1) stands out.14,15 Carotenoids, on the other hand, mainly comprise capsanthin and capsorubin (Figure 1), along with β-carotene, β-cryptoxanthin, lutein, zeaxanthin, anteraxanthin, and violaxanthin (Figure 1).14 The most common flavonoids found are glycosides of myricetin, quercetin, luteolin, kaempferol, and apigenin (Figure 1).15

Another prominent pepper is black pepper (Piper nigrum L.), from the Piperaceae family, native to India, which is the main producer, along with Brazil, Indonesia, Malaysia, Vietnam, and Sri Lanka.16,17 Recognized as one of the most used spices in the world, it has pharmacological properties such as antioxidant, antitumor, analgesic, and anti-inflammatory activities.16-19 It is mainly commercialized in two forms: black pepper, obtained from the dried immature fruit, and white pepper, obtained from the ripe fruit, whose process includes the removal of the pulp and drying of the seeds.17,20 Among the bioactive compounds found in its composition, we can mention the flavonoids catechin, quercetin, myricetin, and the carotenoids, lutein, and β-carotene,21,22 as well as piperine (Figure 1), which is the main alkaloid found in black pepper and contributes to its characteristic aroma and spicy flavor.23
Pink pepper (Schinus terebinthifolia), also called Brazilian pepper, is the fruit of a tree popularly known as “aroeira-vermelha” or “aroeira-da-praia” (Schinus terebinthifolius Raddi), a member of the Anacardiaceae family, which also contains mango and cashew. Schinus terebinthifolius R., native to South America, and particularly to Brazil, Paraguay, Uruguay, and eastern Argentina,24,25 is known as a medicinal plant. Dried bark of the stem, leaves, fruits, and roots are used in remedies in popular medicine.26,27 Several studies have already described pharmacological activities such as antimicrobial activity against different strains of microorganisms, anti-inflammatory and antioxidant activity, possibly linked to the chemical constituents of this species, such as phenolic compounds and carotenoids.28-31 Among the identified constituents, the flavonoids quercetin, myricetin, catechin, and naringenin are notable, as well as phenolic acids such as caffeic acid, syringic acid, p-coumaric acid, ellagic acid, and gallic acid. Additionally, carotenoids, such as β-carotene, and capsaicin were detected (Figure 1).27,32
The identification of the pepper metabolites has been mainly performed by conventional analytical methods such as high-performance liquid chromatography (HPLC) and nuclear magnetic resonance (NMR), which typically require extensive sample preparation and long-time processing. Raman spectroscopy offers significant advantages over chromatographic techniques due to its non-destructive and reagentless nature, rapid measurement times, minimal sample requirements, and low susceptibility to water content in biological samples.33-37 Raman spectroscopy has been an ideal tool for the food industry, particularly in quality control and authenticity assessment of pepper-based products.33,36-38 The food and beverage industry, and pharmaceutical companies, play a crucial role in demanding pepper with its increasing use as a culinary ingredient (food), natural preservative (food), flavoring component (cosmetic), and in nutraceutical products.39,40 For instance, capsaicinoids found in chili peppers and pepper extracts, are responsible for enhanced metabolism, decreasing the percent body fat and fat mass.41 Therapeutic properties addressed to several peppers highlight the importance of quality control management of the main compounds in dried fruits, powder, and encapsulated.42-45
Although Raman spectroscopy is widely used for the characterization of different metabolites present in various types of organisms, studies with peppers using this technique are scarce. Baranski et al.4 showed the composition of carotenoids in red bell peppers (C. annuum L.) present in three ripening stages. Zamora Peredo et al.46 analyzed immature and mature pericarp of some varieties of habanero peppers (C. chinense Jacq.).
Furthermore, Raman spectroscopy can be effectively integrated with chemometric methods and electronic structure calculations, particularly Density Functional Theory (DFT).36,37,47,48 This combined approach provides distinct advantages for analyzing complex matrices where spectral bands from different compounds may overlap. DFT calculations enable the prediction of theoretical vibrational frequencies, which can be directly correlated with experimentally observed Raman bands.47-49 This powerful combination facilitates the interpretation of spectral changes associated with various ripening stages and the detection of potential food adulterants.
Thus, in this work, Raman spectroscopy was used to identify the main constituents, such as carotenoids, flavonoids, and alkaloids, present in different ripening stages of three pepper families: pink pepper (Anacardiaceae), peppers of the genus Capsicum (Solanaceae), and white and black pepper (Piperaceae). In addition, vibrational frequency calculations of the main constituents were performed using the DFT method, to propose the vibrational assignments of the experimental Raman bands observed during the ripening of the different samples analyzed.
Experimental
Sample preparation and experimental design
Fresh peppers from the Solanaceae family, acquired in January 2024, were selected at two ripening stages, by visual inspection of the degree of ripeness, for analysis of the compounds produced at each ripening stage, with S1 being the greenest and S2 the ripest. Additionally, the ripe “biquinho” pepper was also analyzed after processing, in a preserved state, in October 2023. The exocarps of malagueta peppers (S1-Ml and S2-Ml), habanero (S1-Hb and S2-Hb), “biquinho” (S1-Bq, S2-Bq, and S2-BqP), and red karneval S1-KrR and S2-KrR), orange (S1-KrO and S2 KrO), and yellow (S1-KrY and S2-KrY) were analyzed in duplicate with an excitation laser line at 1064 nm (Figure 2).

Peppers at two ripening stages: (a) malagueta, (b) habanero, (c) “biquinho”, karneval (d) red, (e) orange, (f) yellow, (g) pink pepper, (h) black pepper and (i) white, analyzed with an excitation line at 1064 nm.
Fresh pink pepper samples, acquired in April 2024, were also selected at two ripening stages, with S1 being the greenest and S2 the ripest. Pink pepper at the S2 developmental stage, as commercially available in their dried fruit form, were analyzed in October 2023 (S2-PP and S2-SPP). Analyses were performed on the fruit exocarp (S1-P, S2-P, and S2-PP) and seeds (S1-SP, S2-SP, and S2 SPP), in duplicate and with an excitation laser line at 1064 nm (Figure 2).
Finally, analyses of processed black (BP) (Figure 2) and white (WP) (Figure 2) peppercorns, acquired in October 2023, were performed on the seeds, with an excitation laser line at 1064 nm.
Pink pepper extraction
Whole processed pink pepper fruits, peels, and seeds were subjected to extraction with ethanol and acetone. Ethanol extraction aimed to obtain an extract containing both pigments, carotenoids, and flavonoids,50 while acetone extraction aimed to obtain an extract enriched only in carotenoids.32,51 The whole fruits (approximately 100 g of each) were moistened with 100 mL of ethanol/acetone at 25 °C and finely ground using a grinder for about 10 min. This process was repeated two more times.32,50 The solution was filtered, and the solvent was removed under reduced pressure. The extracts were analyzed with a 1064 nm excitation laser line.
Theoretical methodology
To assign the main Raman bands of the theoretical spectra of some of the constituents present in the analyzed peppers, vibrational frequency calculations were performed. Theoretical vibrational spectra were obtained using the Gaussian09 software, revisions D.01 and A.02.52 Optimization of stationary points on the potential energy surfaces and vibrational frequency calculations were performed using the Density Functional Theory (DFT) method, with the hybrid functional PBEPBE and the 6-311G(2d,p) basis set.53,54 Figure S1 (Supplementary Information (SI) section) shows the optimized structures of the phenolic compounds (quercetin, chlorogenic acid, and pelargonidin), alkaloids (capsaicin and piperine), carotenoid (capsanthin), and fatty acid (linoleic acid).
After calculating the vibrational frequencies (-νi), their Raman activities (Ai) were used to calculate the intensity of each normal mode of vibration, using equation 1:55,56
where a = 10-12, -ν0 is the wavenumber/laser frequency (in cm-1), h is Planck’s constant, c is the speed of light in vacuum, kB is the Boltzmann constant, and T is the thermodynamic temperature. The full width at half maximum of the Raman bands in the theoretical spectra was adjusted to 10 cm-1. Finally, with the calculated intensities, it was possible to obtain the theoretical Raman band spectra using the Origin program.57 The vibrational assignments were performed using the Vibrational Energy Distribution Analysis 4 (VEDA 4) software,58 and when necessary, by observing the normal modes of vibration in the GaussView 05 software.52 The assignments of the VEDA 4 software58 are divided into stretching (ν), in-plane bending (δ), and out-of-plane bending (τ) modes. Finally, a comparison was made with the experimental data obtained.
Spectroscopic analyses
The analyses were performed directly on the exocarp (in situ) of the peppers, and pink pepper crude extract samples and were recorded using a Bruker RFS 100 FT Raman instrument, equipped with an Nd:YAG laser operating at 1064 nm, with a spectral resolution of 4 cm-1, covering a wavenumber range from 4000 to 50 cm-1, and using a laser power ranging from 150 to 400 mW. The number of spectral scans accumulated varied between 256, 512, and 1024 scans. All in situ spectra were obtained in duplicate and at three different points on each specimen (Figure S2, SI section) to confirm sample integrity based on the position and intensity of the observed bands. The Raman spectra were processed using Origin program.57 The Raman spectra of habanero, “biquinho” and yellow Karneval peppers, all at the S1 ripening stage, were processed using spectral smoothing (Savitzky-Golay method with a 15-point cubic polynomial algorithm) and linear baseline correction over the defined spectral range.
The extracts obtained from pink peppercorn were analyzed using an Ocean Optics spectrometer, within the 200 to 1100 nm range. The samples were diluted in ethanol/acetone and added to a quartz cuvette with a 10 mm optical path for obtaining the electronic spectra. The spectra were processed using the Origin program.57
Results and Discussion
In situ Raman analysis of peppers of the Solanaceae family
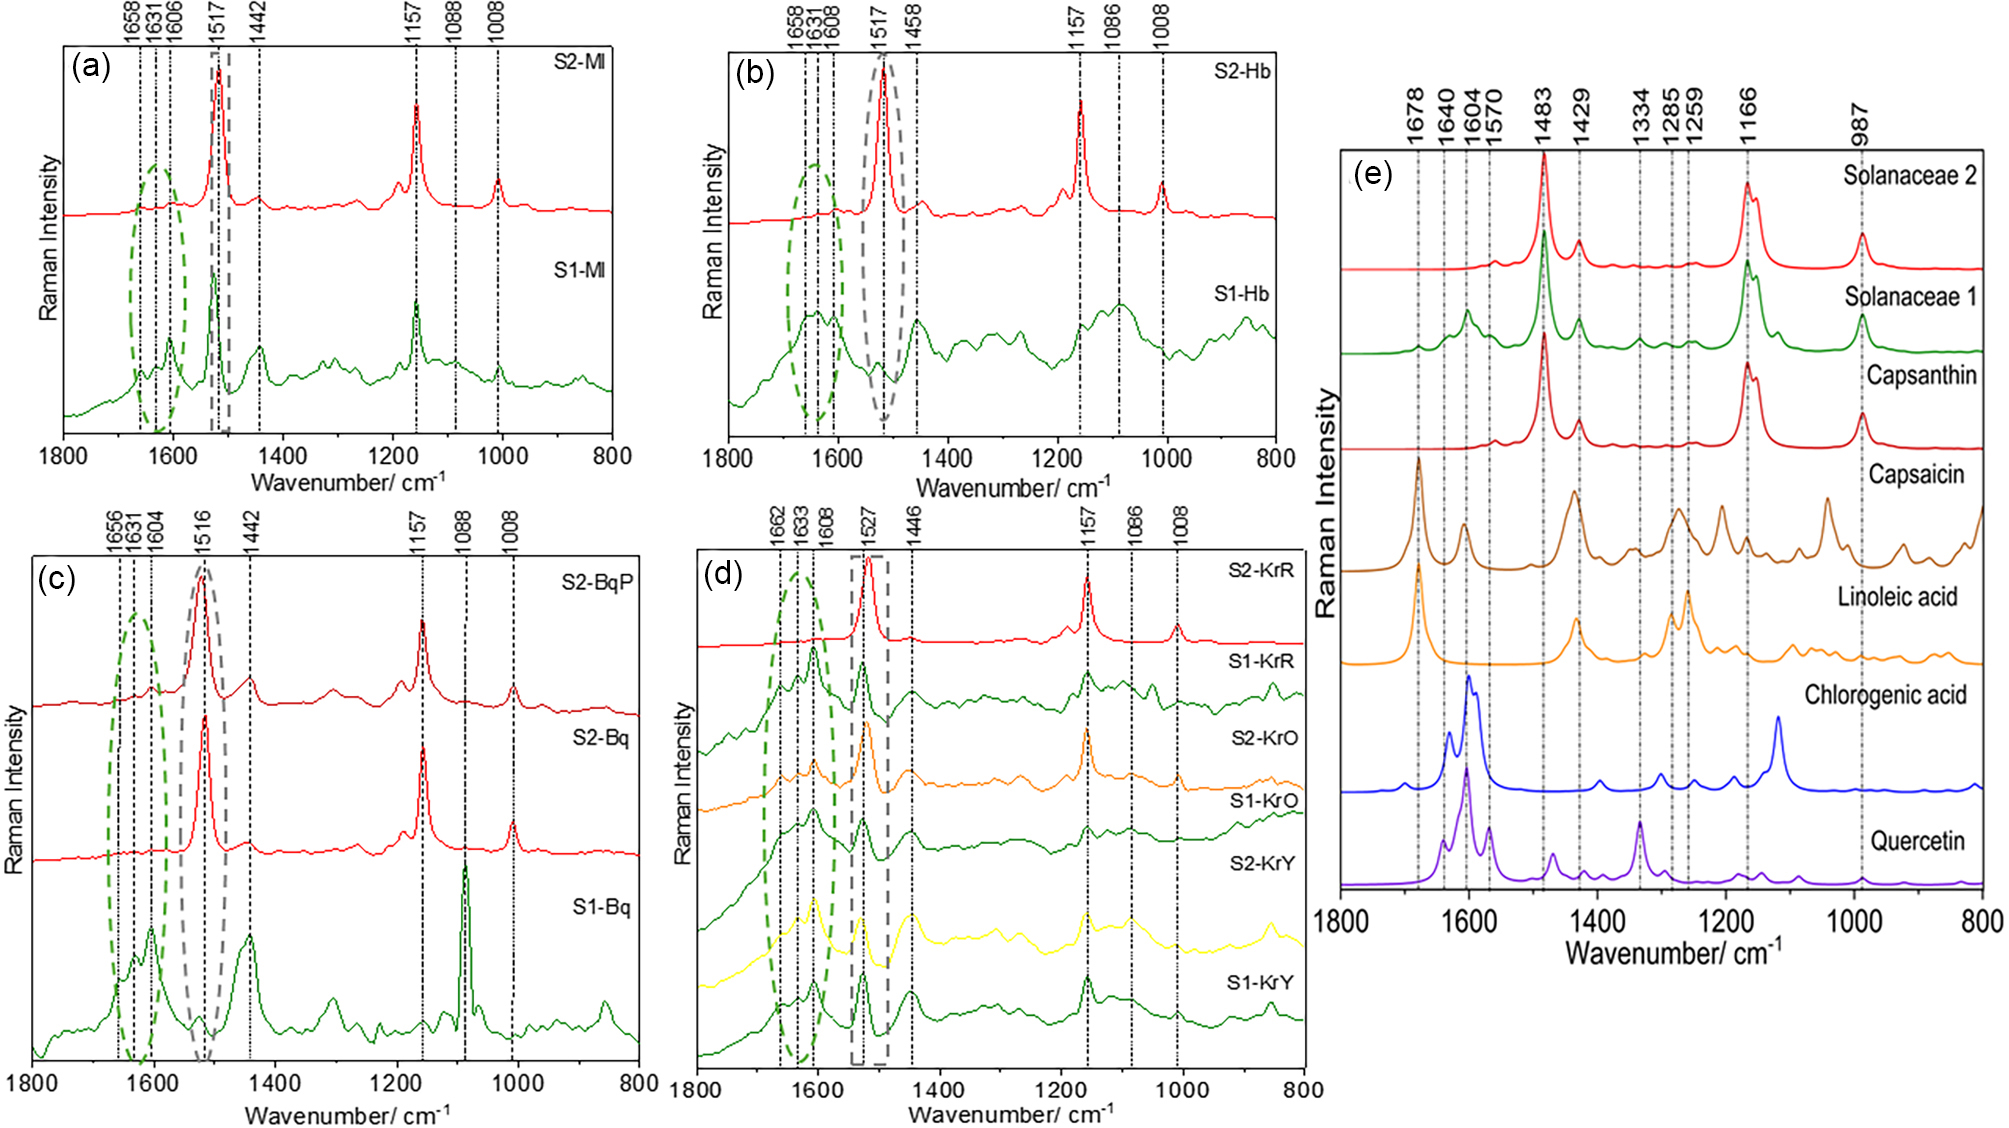
The analysis of the in situ Raman spectra of two maturation stages of pepper samples from the Solanaceae family, obtained with a 1064 nm laser excitation line, demonstrated the main bands characteristic of different classes of compounds, such as phenolics, carotenoids, fatty acids, and also alkaloids, such as capsaicin (Figures 3 and S3 (SI section); Table 1). In general, bands attributed to fatty acids can be observed around 1656 ν(C=C), 1440 1460 δ(CH2), 1303 δ(CH2), 1265 δ(=CH), and 1090 cm-1 ν(C-C) (Table 1).59-61 Furthermore, bands around 1660 and 1610 cm-1 can also be attributed to the ν(C=C) ring stretching of capsaicin.62 Bands of phenolic compounds are observed around 1630-1554 cm-1 ν(C=C), 1380 1340 cm-1 ν(C-O), 1360-1300 cm-1 δ(COH), and 1270-1250 cm-1 δ(OH)/ν(C-O) (Table 1).63-67 Finally, the characteristic bands of carotenoids can be seen between 1527-1516 cm 1, attributed to ν(C=C), 1163-1155 cm-1 to ν(C-C), and 1008 cm-1 attributed to ρ(C-CH3) (Table 1).3,68-70
Tentative assignment of the Raman bands observed in the maturation stages of different types of peppers from the Solanaceae family, obtained with an excitation line at 1064 nm

Raman spectra of the two ripening stages of peppers (a) malagueta (S1-Ml and S2-Ml), (b) habanero (S1-Hb and S2-Hb), (c) “biquinho” (S1 Bq, S2-Bq and S2-BqP) and (d) Karneval red (S1-KrR and E2-KrV), orange (S1-KrO and S2-KrO) and yellow (S1-KrY and S2-KrY), obtained with excitation line at 1064 nm. (e) Calculated Raman spectra of some compounds present in peppers of the Solanaceae family and two different sums of the spectra (Solanaceae 1 and 2). Green oval-dashed line highlights differences in the intensity of Raman bands observed during ripening. Gray oval-dashed line highlight differences in the intensity and Raman shifts. Gray squared-dashed line highlights the differences in Raman shifts.
The malagueta pepper (Capsicum frutescens) has fruits with red coloration when ripe, are slightly aromatic, and with a pungency ranging from medium to high, being widely used in sauces, condiments, preserves, and pastes.72 The data corresponding to the in situ Raman spectra of the S1-Ml and S2-Ml maturation stages of chili pepper (C. frutescens) can be observed in Figures 3a, S3 (SI section), and Table 1. Comparing the two stages, it is possible to notice differences in the spectral profile. In stage S1-Ml, the bands attributed to phenolics/flavonoids (1631 and 1606 cm-1) and fatty acids (1658, 1458-1442, and 1269 cm-1) are more intense than in stage S2-Ml (Figure S3a, green oval-dashed). Furthermore, a shift of the ν(C=C) stretching band, characteristic of carotenoids, to lower wavenumbers is observed, from 1527 cm-1 (S1-Ml) to 1517 cm-1 (S2-Ml) (gray squared-dashed), suggesting that a structural variation of this class of substances has occurred during the ripening process.47
The habanero pepper (Capsicum chinense Jacq.) can exhibit extremely pungent fruits, in addition to their variability in shape, size, and color.73 The in situ spectra of the two maturation stages of the habanero pepper (C. chinense Jacq.) can be observed in Figure 3b (Figure S3; Table 1). Similar to the malagueta pepper, differences are noted between the maturation stages, where the bands referring to phenolics/flavonoids (1635 and 1610 cm-1) and fatty acids (1662, 1458, and 1269 cm-1) are more intense in stage S1 Hb (green and gray oval-dashed). Studies that evaluated the fatty acid composition in pepper varieties of the Capsicum genus, including habanero, using gas chromatography with flame ionization detector (GC FID), found that the major fatty acid was linoleic acid.74,75 In addition to the bands at 1662, 1458, and 1269 cm-1, characteristic of fatty acids, a more intense band around 1086 cm-1 is also observed in S1-Hb, which, in conjunction with the others, is characteristic of linoleic acid (Figure S4).76 Regarding the carotenoid bands, in addition to the shift of the ν(C=C) stretching band to lower wavenumbers (1525 to 1517 cm-1), an increase in the intensity of the characteristic bands of this class of substances (1517 cm-1 ν(C=C), 1157 cm-1 ν(C-C), and 1008 cm-1 ρ(C-CH3)) is also observed, suggesting an increase in total carotenoids with ripening.47,77,78
Another pepper belonging to the C. chinense species is the BRS Moema pepper (Capsicum chinense), known as “biquinho,” which is popular in the Brazilian market and has as its main characteristic aromatic, crunchy fruits with a sweet taste and has a considered weak pungency; in addition, when ripe, it has a reddish coloration.79 The “biquinho” pepper was analyzed at two maturation stages (S1-Bq and S2-Bq) and also processed as a preserve (S2 BqP), due to its consumption being highly appreciated in this way.79 The spectra of the in situ analyses can be observed in Figure 3c (additional information in Figure S3 (SI section) and Table 1). Stage S1-Bq presented a distinct spectral profile from the others; the characteristic bands of carotenoids can be observed with significantly lower intensity (1527, 1160, and 1007 cm-1) when compared to the bands of phenolics, such as those around 1631 and 1604 cm-1, and at 1656 and 1458 cm-1 of fatty acids. Stage S2-Bq presented the predominant bands of carotenoids (1516, 1159, and 1008 cm-1) (gray oval-dashed), in addition to a shift of the band at 1516 cm-1 ν(C=C) to a lower wavenumber when compared to the green stage (S1-Bq). The spectral profile of the “biquinho” pepper processed as a preserve (S2-BqP) is similar to that of the stage S2 Bq pepper; however, the bands attributed to phenolics at 1631, 1604, 1442 cm-1 and to fatty acids at 1656, 1308, and 1192 cm-1 are slightly more intense here. Data from literature demonstrated differences between phenolic compounds and carotenoids in Capsicum spp. peppers evaluated by electronic spectroscopy after heat treatments. It was found that cooked “biquinho” pepper had more total phenolic compounds when compared in natura; however, the opposite was observed for total carotenoids.14
The C. annuum species is one of the most used as ornamental pepper plants, due to its small size, fruits of different colors and durability, in addition to being able to be consumed in natura when preserved, among others. Among them, there is the karneval pepper (Capsicum annuum), which also has yellow, orange, and red colorations.80 The analysis of the karneval peppers (C. annuum) was performed upon specimens with three different colors, red, orange, and yellow, and in two maturation stages. The spectra can be observed in Figure 3d (Figure S3; Table 1). As with the other analyzed peppers, it can be observed that in the green stages of the red and orange varieties (S1-KrR, S1-KrO), the characteristic bands of phenolics/flavonoids, around 1633 and 1608 cm-1, are more intense than those of the carotenoids (Figure 3d, green oval-dashed). With ripening, it is noticed that the spectral profile of the red variety (S2-KrR) is the one that changes the most, with predominant bands of carotenoids, in addition to the shift of the ν(C=C) stretching band to a lower wavenumber, from 1525 to 1518 cm-1. For the orange variety, an increase in the intensity of the characteristic bands of carotenoids and a shift from 1527 to 1519 cm-1 is observed (Figure 3d, gray square-dashed). However, for the yellow variety, the opposite is observed; in stage S2-KrY, there is a decrease in the intensity of the bands attributed to carotenoids (1527 cm-1 ν(C=C), 1157 cm-1 ν(C-C), and 1008 cm-1 ρ(C-CH3)).
The average intensities of the characteristic Raman bands for polyphenols around 1608 cm-1 and carotenoids around 1520 cm-1 (Ipol/Icar) in the S1 maturation stages of yellow karneval peppers revealed a subtle increase in the average intensity of the carotenoid band (Figure S7, SI section). On the other hand, the ratio between the band intensities of flavonoids and carotenoids (Ipol/Icar) in the S2 stage exhibited a significant inversion along the ripening. Numerically, in the S1 stage, a slight predominance of the carotenoid band was observed (Ipol/Icar = 0.95), while in the S2 stage, the polyphenols’ band overcame (Ipol/Icar = 1.28). Different spectral patterns were observed in red karneval peppers, in the S1 stage the ratio Ipol/Icar = 0.81 was drastically reduced to 0.05 in the S2 stage, indicating a marked predominance of the carotenoid band in both stages, particularly in S2 (Figure S7).
The observed variation in the Raman bands of carotenoids and polyphenols/flavonoids between different pepper genotypes such as yellow versus red Karneval, reflects the differential regulation of the biosynthetic pathways of these secondary metabolites. While red genotypes tend to prioritize carotenogenesis, yellow genotypes may divert metabolic precursors towards flavonoid synthesis, demonstrating a strong genetic influence on the chemical composition of the fruit.81 It has been previously reported that Capsicum species, such as red peppers and bell peppers, accumulate increasing levels of total carotenoids during ripening, whereas non-red bell peppers accumulate lower levels of total carotenoids with variable composition.82-85
During ripening, as with most vegetables, the fruits of peppers of the Capsicum genus undergo several morphological, physiological, and metabolic modifications, especially in the content and composition of pigments. The types and concentrations of carotenoids in the fruits during ripening are determined by two metabolic processes: the transformation of existing pigments and the biosynthesis of new carotenoids, which can increase in presence from 2 to 60 times in ripe fruits when compared to unripe ones.77,78 Generally, lutein is more abundant in the green stages, while β-carotene has its concentration remaining constant during ripening. The yellow and orange colors are normally attributed to the accumulation of the carotenoids αand β-carotene, zeaxanthin, and β-cryptoxanthin, while capsanthin and capsorubin are responsible for the red colors.77
The profile and content of polyphenols in peppers are mainly related to the genotype of the plant, but the degree of maturity also plays an important role. Quercetin, catechin, luteolin, and chlorogenic acid appear to contribute more to the total content of phenolics in both unripe and ripe stages.9,15
In Raman spectroscopy, it is known that the concentration is proportional to Raman intensity, however, the intensity is also related to polarizability, an intrinsic characteristic of the molecule. Raman intensities reflect the concentration of the highest Raman scatter which may not be the major component in a complex matrix as biological samples. In this regard, even if the concentration of carotenes in some samples is low relative to other compounds, the Raman signal intensity is very high, as it is well established in the literature on Raman investigations of carotenes.4,5,47,68,86 Furthermore, the shift of the stretching band (νC=C), characteristic of conjugated polyenes such as carotenoids, is indicative of a structural variation that occurs during the ripening of vegetables, as this band shifts to lower wavenumbers with an increase in the number of conjugated unsaturations.4,5,47,68,86 This characteristic is correlated with the strong electronic delocalization effect present in carotenoids.
The calculated Raman spectra of some compounds present in peppers of the Solanaceae family (quercetin, chlorogenic acid, linoleic acid, capsaicin, and capsanthin) are presented in Figure 3e; furthermore, the sum of the theoretical spectra was performed to simulate the in situ spectra of the peppers. In “Solanaceae 1,” the sum was performed by multiplying the Raman intensity of the theoretical spectrum of the carotenoid capsanthin by 0.1, of linoleic acid by 20, and the others (quercetin, chlorogenic acid, and capsaicin) by 10, in an attempt to simulate the in situ spectrum of a pepper at the green maturation stage. In “Solanaceae 2,” the Raman intensity of all theoretical spectra was simply summed, with the objective of simulating the in situ spectrum of a pepper at the ripe maturation stage. The attempt to assign the calculated spectra can be observed in Table S1, and the experimental Raman bands of the malagueta pepper at two maturation stages (Figures 3a and 3e), S1-Ml and S2-Ml, were also assigned from the calculated spectra, for comparison purposes. The assignments performed by the VEDA program58 are divided into stretching (ν), in-plane bending (δ), and out-of-plane bending (τ). Comparing the sum of the calculated spectra “Solanaceae 1” (Figure 3e; Table S1) with the experimental spectrum of peppers of the Solanaceae family at the green maturation stage, especially that of the malagueta pepper S1-Ml (Figures 3a and 3e), it is noticed that the spectral profile is similar, with bands attributed to different compounds. For this, it was necessary to significantly decrease the contribution of the Raman intensity of the capsanthin carotenoid spectrum. However, in “Solanaceae 2” (Figure 3e; Table S1), where each Raman intensity was simply summed, it is noticed that the spectral profile resembles that of a pepper of the Solanaceae family at the ripe stage, such as the malagueta pepper S2-Ml (Figures 3a and 3e). This observation demonstrates how carotenoids are highly polarizable and, consequently, good light scatterers, and suggests that during fruit ripening, a significant increase of these metabolites occurs. Furthermore, as we only have the contribution of the theoretical spectrum of one carotenoid, there is no structural variation of such molecules as there is in a plant sample and the shift of the ν(C=C) band (1483 cm-1) is not observed, as occurs from S1-Ml to S2-Ml (1527-1517 cm-1).47,77,78,87
In situ Raman analysis and crude extracts of pink peppercorn (Anacardiaceae)
The in situ Raman analyses obtained with a 1064 nm laser excitation line from the barks of pink peppercorn at two maturation stages (S1-P and S2-P) and after processing (S2-PP), and the respective seeds (S1-SP, S2-SP, and S2 SPP), are presented in Figures 4a and 4b, respectively (Figure S5, SI section), and the attempt to assign the main bands can be seen in Table 2.
Tentative assignment to the Raman bands observed in the barks (S1-P, S2-P and S2-PP), seeds (S1-SP, S2-SP and S2-SPP), ethanolic and acetone extracts of pink pepper, obtained with a laser excitation line at 1064 nm

Raman spectra of (a) barks (S1-P, S2-P and S2-PP), (b) seeds (S1-SP, S2-SP and S2-SPP) and (c) crude extracts of pink pepper fruits, at two stages of ripening, obtained with excitation line at 1064 nm. (d) Calculated Raman spectra of some compounds present in pink pepper and the sum of all spectra (Anacardiaceae).
In the barks (Figures 4a and S5 (SI section); Table 2), we can observe the main bands around 1710, 1610, 1575, 1521, 1442, 1334, 1250, and 1176 cm-1, which could be attributed to a mixture of substances, such as phenolic compounds and capsaicin (Table 2).62-67 It is noticed that the spectral profile of the barks at different maturation stages and after being processed is similar. No characteristic bands of carotenoids are observed; however, we can observe lower intensity bands around 1521 ν(C=C) and 1176 cm-1 ν(C-C), which can be attributed to anthocyanins, such as pelargonidin,67 previously identified in pink peppercorn fruits by high-performance liquid chromatography mass spectrometry (HPLC-MS).34,88
The seeds (Figures 4b and S5 (SI section); Table 2) presented a different spectral profile from the barks, with main bands characteristic of polyphenols around 1633 1606 cm-1 attributed to ν(C=C), 1360-1300 cm-1 to δ(COH), and 1270-1250 cm-1 to δ(OH)/ν(C-O). Some bands related to fatty acids are also observed, such as in the 1460 1444 cm-1 range δ(CH2), 1316 δ(C-H), and 1090 cm-1 ν(C-C), with linoleic, oleic, palmitic, and palmitoleic acids being the main ones identified in pink peppercorn fruits by de Oliveira et al.,34 using GC.59-61,76
Several flavonoids have already been identified in pink peppercorn barks, such as naringenin, hesperidin, quercetin, kaempferol, rutin, in addition to phenolic acids such as gallic and chlorogenic acid.34,88-90 In a study89 on phenolic compounds in pink peppercorn barks, seeds, and oils, it was found that the bark has higher values of phenolic acids, flavonols, flavanols, and anthocyanins, as well as a greater antioxidant capacity.
The crude extracts performed with acetone and ethanol from the processed pink peppercorn samples (Figure 4c; Table 2) presented a similar spectral profile to each other. Vibrational bands attributed to phenolics can be observed at 1645, 1610, 1583 cm-1, and also bands attributed to fatty acids at 1666, 1444, 1307, 1250, and 1068 cm-1.59,60,63,65-67,76 The bands at 1666 and 1610 cm-1 could also be attributed to ν(C=C) of the aromatic ring, present in capsaicin.62
The extraction with ethanol was performed with the aim of obtaining an extract with the two classes of pigments, carotenoids and flavonoids,50 while with acetone, a more apolar solvent, the objective was to obtain an extract with more apolar substances such as carotenoids.32,51 Analyzing the Raman spectra of the two extracts, it is observed that in the acetonic extract there are low-intensity bands at 1521 cm-1 ν(C=C), 1160 ν(C-C), and 1010 cm-1 ρ(C-CH3), characteristic of carotenoids;3,68,70,71 however, this result was not conclusive, although such substances have already been previously characterized in pink peppercorn fruits by UV-Vis spectroscopy.32,34,91 This observation suggests that the major pigments in pink peppercorn and consequently responsible for the coloration of the barks are flavonoids, such as anthocyanins34,88,89
The analysis of the electronic spectra in the UV-Vis region was used as a complementary analysis. Although the extracts presented a similar Raman spectral profile (Figure 4c), the electronic spectra (Figure 5) demonstrated alterations in the composition of each extract. The acetonic extract (Figure 5) presents only one band with maximum intensity at 335 nm, attributed to phenolic acids and flavonoids.92-94 In the ethanolic extract (Figure 5), in addition to a shoulder around 330 nm, a band with maximum absorption at 270 nm is observed, characteristic of phenolic acids76,92 and capsaicin.95,96 Furthermore, low-intensity bands are observed at 476, 506, 536, and 664 nm in both extracts, which can be attributed to carotenoids (476 and 506 nm) 51 and chlorophylls (664 nm).97

In Figure 4d, the spectra of some of the compounds present in pink peppercorn (quercetin, chlorogenic acid, linoleic acid, capsaicin, and pelargonidin) and the sum of all Raman intensities, named “Anacardiaceae,” are observed. The spectral profile of the sum of the calculated spectra (Figure 4d) is similar to the experimental Raman spectrum of the seeds and, especially, of the barks of pink peppercorn (Figures 4d and 4a). The attempt to assign the Raman bands can be observed in Table S2 (SI section), as well as the experimental Raman bands of the bark and seed of pink peppercorn at the ripe maturation stage (S2-P and S2-SP). It can be noted that the only difference between the “Solanaceae 1”/”Solanaceae 2” and “Anacardiceae” spectra is the absence of the theoretical spectrum of the carotenoid capsanthin and the addition of the theoretical spectrum of the flavonoid pelargonidin. This corroborates with what has been observed in other studies, and also in this one, that the pigments that most contribute to the coloration of the pink peppercorn bark are flavonoids.34,88,89
In situ Raman analysis of black and white peppercorn (Piperaceae)
The in situ spectra of black peppercorn (BP) and white peppercorn (WP) are presented in Figure 6 (Table 3; Figure S6, SI section). Although black and white peppercorn are processed in distinct ways, the spectral profile of both is similar. Analyzing the spectra, we can observe bands at 1637, 1624, 1601 ν(C=C) and ν(N-C=O), 1448, 1295, 1255 δ(CH2), 1155 ν(C-C), 1135, and 1120 cm-1 attributed to piperine, previously described in the literature.98 The bands in the 1637-1601 ν(C=C), 1448 ρ(C-H2), and 1360 ν(C-O) cm-1 range can also be attributed to polyphenols and flavonoids, such as chlorogenic, gallic, caffeic acids, and quercetin, kaempferol, apigenin, luteolin, previously identified by chromatographic techniques in peppercorn fruits.23,99 Additional bands of fatty acids, such as linoleic, palmitic, myristic, and oleic acids, are observed at 1448 ρ(C-H), 1295 δ(C-H), and 1255 cm--1 δ(=CH).23,100
Tentative assignment to the Raman bands observed in black pepper (BP) and white pepper (WP), obtained with excitation line at 1064 nm

Raman spectra of (a) black pepper (BP) and white pepper (WP), obtained with excitation line at 1064 nm. (b) Calculated Raman spectra of some compounds present in black pepper and the sum of the spectra (Piperaceae).
The calculated spectra of some of the compounds present in peppercorn (quercetin, chlorogenic acid, linoleic acid, and piperine) and the sum of the spectra, designated “Piperaceae,” are presented in Figure 6b, and the attempted assignment and comparison with the experimental Raman bands of black peppercorn (BP) (Figure 6a) can be observed in Table S3. As with the experimental spectra (Figure 6b), it can be observed that the spectral profile of the sum of the calculated spectra (“Piperaceae”) is similar to that of the alkaloid piperine, with smaller contributions from the other constituents.98
Conclusions
The results obtained from the analysis of the in situ Raman spectra of pepper samples from the Solanaceae family, at different maturation stages, revealed information about the chemical composition and its variations throughout ripening. The analyses demonstrated the presence of characteristic bands of phenolic compounds, carotenoids, fatty acids, and alkaloids, such as capsaicin. In the Raman spectra of malagueta, habanero, “biquinho”, and red karneval peppers, it was possible to observe a shift of the ν(C=C) stretching bands attributed to carotenoids to lower wavenumbers, in addition to intensification, evidencing the structural variation and a significant increase in the carotenoid content during ripening. The karneval peppers presented distinct spectral profiles among the different colors and maturation stages, reinforcing the chemical diversity among the varieties and the chemical changes associated with the ripening process. Furthermore, the predominance of Raman bands of phenolics in the green stages and the increase in the intensity of Raman bands of carotenoids in the ripe phases indicate a transformation in the pigment composition over time.
The in situ Raman analysis of pink peppercorn bark and seeds at different maturation stages and after processing revealed information about the chemical composition, although no significant changes were observed throughout ripening. The bark spectra showed main bands attributed to phenolic compounds and capsaicin, while the characteristic bands of carotenoids were not observed. However, the presence of bands attributed to anthocyanins, such as pelargonidin, suggests that these flavonoids are the main responsible for the coloration of pink peppercorn bark. In the seeds, the spectra revealed a distinct profile from the barks, with characteristic bands of polyphenols and fatty acids.
The in situ Raman spectroscopic analysis of black and white peppercorn revealed similar spectral profiles, despite the differences in the obtaining processes of the two varieties. Both spectra exhibit characteristic bands mainly attributed to piperine, a predominant bioactive alkaloid in peppercorn, in addition to containing a variety of polyphenols, flavonoids, and fatty acids.
The calculated Raman spectra of the compounds present in peppers, performed by the DFT method, provided information about the contribution of each compound to the spectral profiles observed experimentally. Carotenoids are the predominant pigments in peppers and bell peppers of the Solanaceae family, while flavonoids are responsible for the coloration of pink peppercorn; peppercorns, on the other hand, have piperine as their main constituent.
Finally, the analyses of the different peppers and bell peppers by Raman spectroscopy indicate that the technique can be used to identify important chemical compounds, such as carotenoids, flavonoids, fatty acids, and alkaloids, present in these samples, in addition to pointing out possible markers that can be used to identify and differentiate each variety of pepper. These findings are fundamental for the characterization of bioactive components in peppers and can significantly contribute to studies on nutritional quality, maturation processes, and the development of derived products, thereby reinforcing the relevance of Raman spectroscopy as a powerful tool for food analysis. In particular, these insights pave the way for practical applications within the food industry, including the potential development of portable Raman-based devices for the rapid and non-destructive assessment of the maturity of peppers and other food items along the production chain. Such devices could assist in determining the optimal harvest point, thus optimizing product quality and nutritional value.
Supplementary Information
Supplementary data are available free of charge at http://jbcs.sbq.org.br as PDF file.
Data Availability Statement
Data will be made available on request.
Acknowledgments
Authors are grateful to CNPq, FAPEMIG, CAPES and FINEP (Brazilian agencies) for financial support.
References
-
1 Cazzonelli, C. I.; Pogson, B. J.; Trends Plant Sci. 2010, 15, 266. [Crossref]
» Crossref -
2 Falcone Ferreyra, M. L.; Rius, S. P.; Casati, P.; Front. Plant Sci. 2012, 3, 222. [Crossref]
» Crossref -
3 Maia, L. F.; de Oliveira, V. E.; Edwards, H. G. M.; de Oliveira, L. F. C.; ChemPhysChem 2021, 22, 231. [Crossref]
» Crossref -
4 Baranski, R.; Baranska, M.; Schulz, H.; Planta 2005, 222, 448. [Crossref]
» Crossref -
5 Schulz, H.; Baranska, M.; Vib. Spectrosc. 2007, 43, 13. [Crossref]
» Crossref - 6 Sala, O.; Fundamentos da Epectroscopia Raman e no Infravermelho, vol. 1, 2nd ed.; UNESP: São Paulo, 2008.
-
7 Ghasemnezhad, M.; Sherafati, M.; Payvast, G. A.; J. Funct. Foods 2011, 3, 44. [Crossref]
» Crossref -
8 Gomes, G. P.; Constantino, L. V.; Corte, L. E.-D.; Riger, C. J.; Chaves, D. S. A.; Gonçalves, L. S.; Hortic. Bras. 2019, 37, 429. [Crossref]
» Crossref -
9 Oney-Montalvo, J.; Uc-Varguez, A.; Ramírez-Rivera, E.; Ramírez-Sucre, M.; Rodríguez-Buenfil, I.; Agronomy 2020, 10, 1234. [Crossref]
» Crossref -
10 Hernández-Ortega, M.; Ortiz-Moreno, A.; Hernández Navarro, M. D.; Chamorro-Cevallos, G.; Dorantes-Alvarez, L.; Necoechea-Mondragón, H.; J. Biomed. Biotechnol. 2012, 2012, 1. [Crossref]
» Crossref -
11 Tundis, R.; Loizzo, M. R.; Menichini, F.; Bonesi, M.; Conforti, F.; Statti, G.; De Luca, D.; de Cindio, B.; Menichini, F.; Plant Foods Hum. Nutr. 2011, 66, 261. [Crossref]
» Crossref -
12 Tundis, R.; Menichini, F.; Bonesi, M.; Conforti, F.; Statti, G.; Menichini, F.; Loizzo, M. R.; LWT - Food Sci. Technol. 2013, 53, 370. [Crossref]
» Crossref -
13 Voutilainen, S.; Nurmi, T.; Mursu, J.; Rissanen, T. H.; Am. J. Clin. Nutr. 2006, 83, 1265. [Crossref]
» Crossref -
14 Salgaço, M. K.: Avaliação de Compostos Fenólicos em Pimentas Capsicum spp. em Função de Processos Térmicos; MSc Dissertation, Universidade Estadual Paulista, Araraquara, Brazil, 2019. [Link] accessed in June 2025
» Link -
15 Nascimento, P. L. A.: Atividade Antioxidante e Antimicrobiana da Pimenta Malagueta (Capsicum frutescens); PhD Thesis, Universidade Federal Rural de Pernambuco, Recife, Brazil, 2012. [Link] accessed in June 2025
» Link -
16 Dosoky, N. S.; Satyal, P.; Barata, L. M.; Da Silva, J. K. R.; Setzer, W. N.; Molecules 2019, 24, 4244. [Crossref]
» Crossref -
17 Salehi, B.; Zakaria, Z. A.; Gyawali, R.; Ibrahim, S. A.; Rajkovic, J.; Shinwari, Z. K.; Khan, T.; Sharifi-Rad, J.; Ozleyen, A.; Turkdonmez, E.; Valussi, M.; Tumer, T. B.; Monzote Fidalgo, L.; Martorell, M.; Setzer, W. N.; Molecules 2019, 24, 1364. [Crossref]
» Crossref -
18 Fan, R.; Qin, X. W.; Hu, R. S.; Hu, L. S.; Wu, B. D.; Hao, C. Y.; Eur. Food Res. Technol. 2020, 246, 2601. [Crossref]
» Crossref -
19 Meghwal, M.; Goswami, T.; Open Access Sci. Reports 2012, 1, 1. [Crossref]
» Crossref -
20 Li, Y.; Zhang, C.; Pan, S.; Chen, L.; Liu, M.; Yang, K.; Zeng, X.; Tian, J.; LWT 2020, 117, 108644. [Crossref]
» Crossref -
21 Ashokkumar, K.; Murugan, M.; Dhanya, M. K.; Pandian, A.; Warkentin, T. D.; Clin. Phytoscience 2021, 7, 52. [Crossref]
» Crossref -
22 Ashokkumar, K.; Pandian, A.; Murugan, M.; Dhanya, M. K.; Sathyan, T.; Sivakumar, P.; Raj, S.; Warkentin, T. D.; Nat. Prod. Res. 2020, 34, 1306. [Crossref]
» Crossref -
23 Milenković, A.; Stanojević, L.; Adv. Technol. 2021, 10, 40. [Crossref]
» Crossref - 24 Lorenzi, H.; Arvores Brasileiras, Manual de Identificcion e Cultivo de Plantas Arvoreas Nativas do Brasil, vol. 1, 2nd ed.; Plantarum: Nova Odessa, 1998.
-
25 Picolotto, A. M.; Ariati, A. M.; Franciscato, L. M. S. S.; Bittencourt, P. R. S.; Caramão, E. B.; Sakai, O. A.; Moritz, C. M. F.; Rev. Mundi 2020, 5, 1. [Crossref]
» Crossref -
26 Ministério da Saúde; Agência Nacional de Vigilância Sanitária (ANVISA); Monografia da Espécie Schinus terebinthifolius Raddi (Aroeira-da-praia); Ministério da Saúde: Brasília, 2014. [Link] accessed in June 2025
» Link -
27 Macedo, N. B.: Pimenta Rosa (Schinus terebinthifolius Raddi): Compostos Presentes nos Frutos e suas Atividades Antioxidante e Anti-Inflamatória; MSc Dissertation, Universidade Federal de Sergipe, São Cristóvão, Brazil, 2018. [Link] accessed in June 2025
» Link -
28 Degáspari, C. H.; Waszczynskyj, N.; Prado, M. R. M.; Cienc. Agrotecnol. 2005, 29, 617. [Crossref]
» Crossref -
29 da Rocha, P. S.; Boleti, A. P. A.; Vieira, M. C.; Carollo, C. A.; da Silva, D. B.; Estevinho, L. M.; dos Santos, E. L.; Souza, K. P.; Comp. Biochem. Physiol., Part C: Toxicol. Pharmacol. 2019, 220, 36. [Crossref]
» Crossref -
30 dos Santos Jr., H. M.; Oliveira, D. F.; de Carvalho, D. A.; Pinto, J. M. A.; Campos, V. A. C.; Mourão, A. R. B.; Pessoa, C.; de Moraes, M. O.; Costa-Lotufo, L. V.; J. Nat. Med. 2010, 64, 231. [Crossref]
» Crossref -
31 Heringer, A. P.; Aspectos Quimicos, Ecológicos e Farmacológicos de Schinus terebinthifolius Raddi; MSc Dissertation, Universidade Federal do Rio de Janeiro, Rio de Janeiro, Brazil, 2009. [Link] accessed in June 2025
» Link - 32 Gomes, L. J.; Silva-Mann, R.; Mattos, P. P.; Rabbani, A. R. C.; Pensando a Biodiversidade: Aroeira (Schinus terebinthifolius Raddi.), vol. 1, 1st ed.; UFS: São Cristóvão, 2013.
-
33 Petersen, M.; Yu, Z.; Lu, X.; Biosensors 2021, 11, 187. [Crossref]
» Crossref -
34 de Oliveira, V. S.; Augusta, I. M.; Braz, M. V. C.; Riger, C. J.; Prudêncio, E. R.; Sawaya, A. C. H. F.; Sampaio, G. R.; Torres, E. A. F. S.; Saldanha, T.; Food Chem. 2020, 315, 126274. [Crossref]
» Crossref -
35 Xu, J.; Lin, J.; Peng, S.; Zhao, H.; Wang, Y.; Rao, L.; Liao, X.; Zhao, L.; Molecules 2023, 28, 2362. [Crossref]
» Crossref -
36 Kolašinac, S. M.; Pećinar, I.; Gajić, R.; Mutavdžić, D.; Dajić Stevanović, Z. P.; Foods 2025, 14, 953. [Crossref]
» Crossref -
37 Sultanbawa, Y.; Smyth, H. E.; Truong, K.; Chapman, J.; Cozzolino, D.; Food Chem. Mol. Sci. 2021, 3, 100033. [Crossref]
» Crossref -
38 Huang, Y.; Wang, H.; Huang, H.; Tan, Z.; Hou, C.; Zhuang, J.; Tang, Y.; Agriculture 2025, 15, 195. [Crossref]
» Crossref -
39 Mandal, S. K.; Rath, S. K.; Logesh, R.; Mishra, S. K.; Devkota, H. P.; Das, N.; Phyther. Res. 2023, 37, 965. [Crossref]
» Crossref - 40 Thahira Banu, A.; Aswini, M.; Role of Piper Nigrum in Functional Food and Nutraceuticals, vol. 1, 1st ed.; Academic Press: New York, 2023.
-
41 Rogers, J.; Urbina, S. L.; Taylor, L. W.; Wilborn, C. D.; Purpura, M.; Jäger, R.; Juturu, V.; BMC Obes. 2018, 5, 22. [Crossref]
» Crossref -
42 Mayr, S.; Beć, K. B.; Grabska, J.; Schneckenreiter, E.; Huck, C. W.; Talanta 2021, 223, 121809. [Crossref]
» Crossref -
43 Johnson, J. B.; Mani, J. S.; Walsh, K. B.; Naiker, M.; J. Food Meas. Charact. 2023, 17, 1764. [Crossref]
» Crossref -
44 Kim, S. S.; Choi, J.-Y.; Lim, J. H.; Cho, J.-S.; Korean J. Food Preserv. 2023, 30, 224. [Crossref]
» Crossref -
45 Wu, S.; Wang, L.; Zhou, G.; Liu, C.; Ji, Z.; Li, Z.; Li, W.; Food Res. Int. 2023, 163, 112192. [Crossref]
» Crossref -
46 Zamora-Peredo, L.; Rodríguez-Jimenez, R.; García González, L.; Hernnández Torres, J.; Hernandez Quiroz, T.; Chilean J. Agric. Anim. Sci. 2018, 34, 68. [Crossref]
» Crossref -
47 Campos, M. T. C.; Maia, L. F.; Dos Santos, H. F.; Edwards, H. G. M.; de Oliveira, L. F. C.; J. Raman Spectrosc. 2022, 54, 1314. [Crossref]
» Crossref -
48 Peng, H.; Hou, H.-Y.; Chena, X.-B.; Quim. Nova 2021, 44, 929. [Crossref]
» Crossref -
49 Yao, G.; Muhammad, M.; Zhao, J.; Liu, J.; Huang, Q.; Food Chem.: Mol. Sci. 2022, 4, 100103. [Crossref]
» Crossref -
50 Miamoto, J. B. M.; Aazza, S.; Ruas, N. R.; de Carvalho, A. A.; Pinto, J. E. B. P.; Resende, L. V.; Bertolucci, S. K. V.; J. Appl. Res. Med. Aromat. Plants 2020, 16, 100238. [Crossref]
» Crossref - 51 Rodriguez, D.; A Guide to Carotenoid Analysis in Foods, vol. 1, 1st ed.; ILSI Press: Washington, 2001.
- 52 Frisch, M. J.; Trucks, G. W.; Schlegel, H. B.; Scuseria, G. E.; Robb, M. A.; Cheeseman J. R.; Scalmani, G.; Barone, V.; Mennucci, B.; Petersson, G. A.; Nakatsuji, H.; Caricato, M.; Li, X.; Hratchian, H. P.; Izmaylov, A. F.; Bloino, J.; Zheng, G.; Sonnenberg, J. L.; Hada, M.; Ehara, M.; Toyota, K.; Fukuda, R.; Hasegawa, J.; Ishida, M.; Nakajima, T.; Honda, Y.; Kitao, O.; Nakai, H.; Vreven, T.; Montgomery, Jr., J. A.; Peralta, J. E.; Ogliaro, F.; Bearpark, M.; Heyd, J. J.; Brothers, E.; Kudin, K. N.; Staroverov, V. N.; Kobayashi, R.; Normand, J.; Raghavachari, K.; Rendell, A.; Burant, J. C.; Iyengar, S. S.; Tomasi, J.; Cossi, M.; Rega, N.; Millam, J. M.; Klene, M.; Knox, J. E.; Cross, J. B.; Bakken, V.; Adamo, C.; Jaramillo, J.; Gomperts, R.; Stratmann, R. E.; Yazyev, O.; Austin, A. J.; Cammi, R.; Pomelli, C.; Ochterski, J. W.; Martin, R. L.; Morokuma, K.; Zakrzewski, V. G.; Voth, G. A.; Salvador, P.; Dannenberg, J. J.; Dapprich, S.; Daniels, A. D.; Farkas, Ö.; Foresman, J. B.; Ortiz, J. V.; Cioslowski, J.; Fox, D. J.; Gaussian 09, Revision D.01; Gaussian Inc.; Wallingford, CT, USA, 2009.
-
53 McLean, A. D.; Chandler, G. S.; J. Chem. Phys. 1980, 72, 5639. [Crossref]
» Crossref -
54 Perdew, J. P.; Burke, K.; Ernzerhof, M.; Phys. Rev. Lett. 1996, 77, 3865. [Crossref]
» Crossref -
55 Collier, W. B.; Magdó, I.; Klots, T. D.; J. Chem. Phys. 1999, 110, 5710. [Crossref]
» Crossref -
56 de Oliveira, R.; Sant’Ana, A. C.; J. Braz. Chem. Soc. 2023, 34, 1309. [Crossref]
» Crossref - 57 Origin(Pro), version 2018; OriginLab Corporation, Northampton, USA, 2018.
-
58 Jamróz, M. H.; Spectrochim. Acta, Part A 2013, 114, 220. [Crossref]
» Crossref -
59 Beattie, J. R.; Bell, S. E. J.; Moss, B. W.; Lipids 2004, 39, 407. [Crossref]
» Crossref -
60 Popović-Djordjević, J.; Špirović-Trifunović, B.; Pećinar, I.; Fernando Cappa de Oliveira, L.; Krstić, Ð.; Mihajlović, D.; Akšić, M. F.; Simal-Gandara, J.; Ind. Crops Prod. 2023, 191, 115797. [Crossref]
» Crossref -
61 Windarsih, A.; Arsanti Lestari, L.; Erwanto, Y.; Rosiana Putri, A.; Irnawati; Ahmad Fadzillah, N.; Rahmawati, N.; Rohman, A.; Food Rev. Int. 2023, 39, 3906. [Crossref]
» Crossref -
62 Tian, K.; Wang, W.; Yao, Y.; Nie, X.; Lu, A.; Wu, Y.; Han, C.; J. Raman Spectrosc. 2018, 49, 472. [Crossref]
» Crossref -
63 Aguilar-Hernández, I.; Afseth, N. K.; López-Luke, T.; Contreras-Torres, F. F.; Wold, J. P.; Ornelas-Soto, N.; Vib. Spectrosc. 2017, 89, 113. [Crossref]
» Crossref -
64 González Moreno, A.; Prieto, P.; Ruiz Delgado, M. C.; Domínguez, E.; Heredia, A.; De Cózar, A.; Phys. Chem. Chem. Phys. 2021, 23, 18068. [Crossref]
» Crossref -
65 Machado, N. F. L.; Batista de Carvalho, L. A. E.; Otero, J. C.; Marques, M. P. M.; Spectrochim. Acta, Part A 2013, 109, 116. [Crossref]
» Crossref -
66 Teslova, T.; Corredor, C.; Livingstone, R.; Spataru, T.; Birke, R. L.; Lombardi, J. R.; Cañamares, M. V.; Leona, M.; J. Raman Spectrosc. 2007, 38, 802. [Crossref]
» Crossref -
67 Wang, C.-H.; Huang, C.-C.; Chen, W.; Lai, Y.-S.; J. Food Drug Anal. 2020, 28, 239. [Crossref]
» Crossref -
68 de Oliveira, V. E.; Castro, H. V.; Edwards, H. G. M.; de Oliveira, L. F. C.; J. Raman Spectrosc. 2009, 41, 642. [Crossref]
» Crossref -
69 Koyama, Y.; Kanaji, M.; Shimamura, T.; Photochem. Photobiol. 1988, 48, 107. [Crossref]
» Crossref -
70 Saito, S.; Tasumi, M.; J. Raman Spectrosc. 1983, 14, 236. [Crossref]
» Crossref -
71 Koyama, Y.; Takatsuka, I.; Nakata, M.; Tasumi, M.; J. Raman Spectrosc. 1988, 19, 37. [Crossref]
» Crossref - 72 Reifschneider, F. J. B.; Nass, L. L.; Henz, G. P.; Heinrich, A. G.; Ribeiro, C. S. C.; Filho, K. E.; Boiteux, L. S.; Ritschel, P.; Ferraz, R. M.; Quecini, V.; Uma Pitada de Biodiversidade na Mesa dos Brasileiros, vol. 1, 1st ed.; EMBRAPA: Brasilia, 2015.
-
73 Oboh, G.; Ademiluyi, A. O.; Faloye, Y. M.; J. Med. Food 2011, 14, 1152. [Crossref]
» Crossref -
74 da Silva, V. M. B.; Pimentas do Gênero Capsicum: Constituintes Químicos e Potencial Antioxidante; PhD Thesis, Universidade Federal da Paraíba, João Pessoa, Brazil, 2017. [Link] accessed in June 2025
» Link -
75 Sora, G. T. S.; Souza, A. H. P.; Zielinski, A. A. F.; Haminiuk, C. W. I.; Matsushita, M.; Peralta, R. M.; Cienc. Agrotecnol. 2015, 39, 372. [Crossref]
» Crossref -
76 Martini, W. S.; Porto, B. L. S.; de Oliveira, M. A. L.; Sant’Ana, A. C.; J. Braz. Chem. Soc. 2017, 29, 390. [Crossref]
» Crossref -
77 Gómez-García, M.; Ochoa-Alejo, N.; Int. J. Mol. Sci. 2013, 14, 19025. [Crossref]
» Crossref -
78 Zhuang, Y.; Chen, L.; Sun, L.; Cao, J.; J. Funct. Foods 2012, 4, 331. [Crossref]
» Crossref -
79 dos Santos, A. S.: Características Agronômicas,Físico-Químicas e Sensoriais de Linhagens de Pimenta Biquinho Cultivadas em Sistema Orgânico; MSc Dissertation, Universidade Federal de São Carlos, Araras, Brazil, 2018. [Link] accessed in June 2025
» Link -
80 Rêgo, E. R.; Rêgo, M. M.; Finger, F. L.; Acta Hortic. 2015, 309. [Crossref]
» Crossref -
81 Tan, J.; Zhou, Z.; Niu, Y.; Sun, X.; Deng, Z.; Sci. Rep. 2017, 7, 8594. [Crossref]
» Crossref -
82 Wang, L.; Zhong, Y.; Liu, J.; Ma, R.; Miao, Y.; Chen, W.; Zheng, J.; Pang, X.; Wan, H.; Plants 2023, 12, 2156. [Crossref]
» Crossref -
83 Ha, S.-H.; Kim, J.-B.; Park, J.-S.; Lee, S.-W.; Cho, K.-J.; J. Exp. Bot. 2007, 58, 3135. [Crossref]
» Crossref -
84 Li, Z.; Wang, S.; Gui, X.-L.; Chang, X.-B.; Gong, Z.-H.; PLoS One 2013, 8, e61996. [Crossref]
» Crossref -
85 Tian, S.-L.; Li, Z.; Li, L.; Shah, S. N. M.; Gong, Z.-H.; Physiol. Mol. Biol. Plants 2017, 23, 685. [Crossref]
» Crossref -
86 Campos, M. T. C.; Maia, L. F.; Popović-Djordjević, J.; Edwards, H. G. M.; de Oliveira, L. F. C.; Food Chem. Mol. Sci. 2024, 8, 100204. [Crossref]
» Crossref - 87 Maia, L. F.; de Oliveira, V. E.; Oliveira, L. F. C.; Espectroscopia Raman de Polienos Conjugados, vol. 1, 1st ed.; UFJF: Juiz de Fora, 2021.
- 88 Siebeneichler, T. J.; Peixoto, E. C.; Antunes, B. F.; Galli, V.; Rombaldi, C. V.; Composição de Pimenta Rosa (Schinus Terebinthifolius Raddi), Atividades Biológicas, Encapsulamento e Aplicações em Alimentos: Uma Revisão, vol. 2, 2nd ed.; Agron Food Academy: Pelotas, 2022.
-
89 Carneiro, T. S.: Composto Fenólicos em Cascas, Sementes e Óleo da Pimenta Rosa Obtido por Prensagem a Frio: Estudo da Bioacessibilidade da Casca; MSc Dissertation, Universidade Federal do Sergipe, São Cristóvão, Brazil, 2022. [Link] accessed in June 2025
» Link -
90 Kim, M. J.; Kim, D. W.; Kim, J. G.; Shin, Y.; Jung, S. K.; Kim, Y.-J.; Antioxidants 2021, 10, 1062. [Crossref]
» Crossref -
91 Pagani, A. A. C.; de Souza, A. L. G.; Souza, D. S.; Batista, R. A.; Xavier, A. C. R.; Pagani, G. D.; Int. J. Eng. Innov. Technol. 2014, 4, 37. [Crossref]
» Crossref -
92 Kowalski, R.; Kowalska, G.; Polish J. Food Nutr. Sci. 2005, 14, 37. [Link]
» Link -
93 Martin, C.; Bruneel, J.-L.; Castet, F.; Fritsch, A.; Teissedre, P.-L.; Jourdes, M.; Guillaume, F.; Food Chem. 2017, 221, 568. [Crossref]
» Crossref -
94 Tsimogiannis, D.; Samiotaki, M.; Panayotou, G.; Oreopoulou, V.; Molecules 2007, 12, 593. [Crossref]
» Crossref -
95 Çınar, M.; Alım, B.; Alım, Z.; Şakar, E.; Radiat. Phys. Chem. 2023, 208, 110879. [Crossref]
» Crossref -
96 Koleva Gudeva, L.; Mitrev, S.; Maksimova, V.; Spasov, D.; Hem. Ind. 2013, 67, 671. [Crossref]
» Crossref -
97 Matti Linnanto, J. In Chlorophylls; Ameen, S.; Shaheer Akhtar, M.; Shin, H.-S., eds.; InTechOpen, 2022. [Crossref]
» Crossref -
98 Schulz, H.; Baranska, M.; Quilitzsch, R.; Schütze, W.; Lösing, G.; J. Agric. Food Chem. 2005, 53, 3358. [Crossref]
» Crossref -
99 Al-Khayri, J. M.; Upadhya, V.; Pai, S. R.; Naik, P. M.; Al Mssallem, M. Q.; Alessa, F. M.; Molecules 2022, 27, 5965. [Crossref]
» Crossref -
100 Liu, H.; Zheng, J.; Liu, P.; Zeng, F.; J. Food Sci. Technol. 2018, 55, 2130. [Crossref]
» Crossref
Edited by
-
Editor handled this article:
Josué Carinhanha Caldas Santos (Associate)